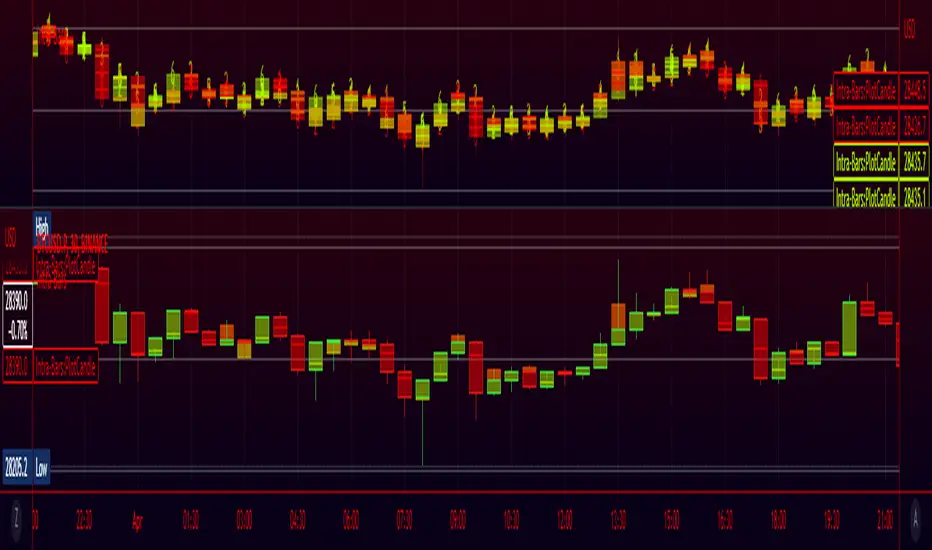
High Volume Footprint BreakoutThe High Volume Footprint Breakout indicator brings institutional-grade Order Flow analysis to your standard TradingView charts. By looking inside the candles using intrabar data, this tool identifies specific price levels where massive, aggressive buying or selling volume has occurred.
Unlike standard Volume Profiles which show volume over a long period, this indicator isolates specific moments of high-intensity participation. It draws extended support and resistance lines from these "High Volume Nodes," helping you identify where institutions have stepped in and where trapped traders might exist.
Why Use This Indicator?
Standard candlestick charts show you where price went, but they hide how it got there. A candle might look normal, but inside that candle, there could be a massive battle between buyers and sellers at a specific price level.
Reveal Hidden Liquidity : Find the exact price levels that defended a move.
Filter the Noise : Instead of showing every volume node, this script only highlights Breakout Levels —areas where the single-price volume exceeded a historical maximum (e.g., the highest volume node in the last 20 bars).
No External Tools Needed : Replicates the logic of professional Footprint/Order Flow software using native TradingView data.
How It Works (The Logic)
This script uses a strict algorithm to reconstruct a virtual "Footprint" of the market:
Intrabar Analysis : It accesses lower timeframe data (e.g., 1-minute data inside a Daily bar) to analyze price action at a granular level.
Volume Categorization : It separates volume into Buy Volume (Aggressive Buyers) and Sell Volume (Aggressive Sellers) based on price movement logic.
Volume Distribution : To ensure accuracy, it distributes the volume of intrabar candles across their High-Low range, preventing artificial volume spikes on single ticks.
Breakout Detection : It compares the highest volume node of the current bar against the highest nodes of the previous X bars. If the current volume is a new local record, a line is drawn.
How to Trade This Indicator
1. The Standard Rejection (Trend Continuation)
Green Lines (Aggressive Buyers) : These levels represent areas where buyers stepped in with massive force. In an uptrend, expect price to bounce off these lines. Treat them as Support.
Red Lines (Aggressive Sellers) : These levels represent areas where sellers unloaded heavy positions. In a downtrend, expect price to reject these lines. Treat them as Resistance.
2. The "Flip" Setup (Trapped Traders)
This is an advanced Order Flow concept. When the market disrespects a high-volume level, it creates "Trapped Traders."
Red Line Acting as Support : If price breaks above a Red (Sell) line and holds, the aggressive sellers at that level are now trapped underwater. When price returns to this line, these sellers often buy to close their positions at breakeven, fueling a bounce.
Green Line Acting as Resistance : If price breaks below a Green (Buy) line, the aggressive buyers are trapped. When price rallies back to this line, they often sell to exit, creating resistance.
Settings & Configuration
Auto-Select Intrabar Timeframe :
Enabled (Recommended) : Automatically selects the best resolution (1-min for Intraday/Daily, 60-min for Weekly/Monthly) to match the "Volume Data Source" standards.
Disabled : Allows you to manually force a specific intrabar resolution.
Breakout Lookback Period : Determines how significant a volume spike must be to trigger a line. (Default: 20). Higher values = fewer, stronger lines.
Max Visible Lines : Limits the number of lines on the chart to keep your workspace clean.
Label Offset : Adjusts how far to the right the text labels appear, allowing you to position them perfectly for your screen setup.
Who Should Use This?
Order Flow Traders : Who want footprint-style logic without complex grid charts.
Price Action Traders : Who want objective, data-driven Support & Resistance levels rather than subjective drawings.
Scalpers & Day Traders : Who need to see where the "heavy hands" are transacting in real-time.
Disclaimer & Limitations
Intrabar vs. Tick Data : This script uses TradingView's intrabar data to approximate the footprint. While highly accurate, it may differ slightly from tick-perfect software.
Volume Data Required : This indicator requires the asset to provide real volume data. It works best on Futures, Crypto, and Stocks. It may not work on FOREX pairs that do not provide tick volume.
Does it Repaint?
Short Answer:
No , it does not repaint on closed bars. Once a candle closes and a line is drawn, that line is permanent and will not move or disappear.
Long Answer (The Nuances):
There are two specific scenarios you need to be aware of regarding how TradingView handles data:
1. The "Forming Bar" (Wait for Close)
Behavior : While the current candle is still moving (open), the indicator is calculating the volume in real-time. If a massive volume spike happens right now, a line might appear. If the volume of previous bars suddenly looks smaller by comparison, the condition might change.
Solution : Like almost all indicators, you must wait for the bar to close to confirm the signal. Once the bar closes, the calculation is locked and the line is fixed forever.
2. Historical Data Limits (The "Disappearing History" Issue)
Behavior : This script relies on request.security_lower_tf (e.g., fetching 1-minute data inside a Daily bar). TradingView does not store infinite 1-minute data for every asset. They usually store a few thousand bars of lower timeframe history (more if you have a Premium account).
The Issue : If you scroll back 5 years on a Daily chart, the script will try to fetch the 1-minute data for a day in 2019. If TradingView has deleted that old 1-minute data to save space, the script will receive "empty" data.
Result : You might see lines on the recent chart (last few months/year), but if you scroll back too far, the lines will stop appearing because the underlying data doesn't exist anymore.
Is this Repainting? Technically, no. It's a Data Availability limitation. But it means that what you see on a chart from 5 years ago might look different than what you saw when you were trading it live 5 years ago.
Disclaimer
For Educational and Informational Purposes Only
This indicator is provided for educational and informational purposes only and DOES NOT constitute financial, investment, or trading advice. The "High Volume Footprint Breakout" tool is based on historical data analysis and algorithmic interpretation of market volume; it does not predict future market movements with certainty.
Risk Warning
Trading in financial markets (Stocks, Crypto, Futures, Forex, etc.) involves a high degree of risk and may not be suitable for all investors. You could lose some or all of your initial investment. Past performance of any trading system or methodology is not necessarily indicative of future results.
No Liability
The author of this script assumes no responsibility or liability for any errors or omissions in the content of this indicator, or for any trading losses or damages incurred as a result of using this tool. Users are solely responsible for their own trading decisions and should always use proper risk management. By using this script, you acknowledge and agree to these terms.
Pine Script®指標