Asset Correlation Tool v3, improvedI found this useful tool among the indicators but it wasn't doing the correlation study correctly.
Everything in markets, with only a few exceptions, are rising in value over time and therefore trended to time. The simplest method I found is to use link relative or first difference detrending, before calculating a correlation between assets.
I also updated it to include more assets, to use the latest Cryptocap indices like BTC.D/ETH.D/TOTAL2 and the top 100 crypto index CIX100. I improved the colour schemes, too
Included in the source code are some other ideas like the FRED:M1 and FRED:M2 (only on daily charts), the Yuan/Yen/EUR/USD, etc. There's lots of scope for correlating unrelated markets.
I'll keep updating it as I use it to find truly correlated assets. Some kind of signal line of known correlations, to subtract from the baseline fuzz of market activity.
Any improvements are most welcome; I'm a novice at best at statistics and build on others' work.
- mabonyi
J-BTC


Ease of Movement WatcherHere’s a handy Ease of Movement(EMV) Indicator. I tried to include detailed comments so that anyone that’s learning pine can follow along.
The Ease of Movement Indicator is a volume based oscillator that is designed to measure the ease (or movability) of price movement for a security. The EMV is a centered oscillator, meaning that values can fluctuate above and below zero.
To understand how to use and interpret the EMV Indicator, its crucial to first understand its two main calculations :
Distance Moved = ((high + low) / 2) - ((high + low ) / 2)
-This is the difference between the current period’s midpoint and the previous period’s
midpoint.
Box Ratio = (volume / 100,000) / (high - low)
-When calculating the Box Ratio, it is common to divide the volume by 100,000 for a clearer visualization of the data. However, users can choose
to modify this value with the ‘volumeDiv’ input.
The Ease of Movement Value is then pretty simple to calculate:
EMV = (Distance Moved / Box Ratio)
The indicator then plots a SMA of the previous 24 EMV Values.
Looking at the formula, we know that combining low volume with a large {high, low} range will result in a relatively small box ratio value. Thus, we know that the EMV value for that period will be higher since EMV is found by dividing the Distance Moved by the Box Ratio.
Here’s a simple guide to interpreting the EMV:
- If (EMV > 0)
then price is increasing with relative ease.
-If (EMV < 0)
then price is decreasing with relative ease.
- If high-low range is large and volume is low
then ease of movement is high.
-If high-low range is small and volume is high
then ease of movement is low.
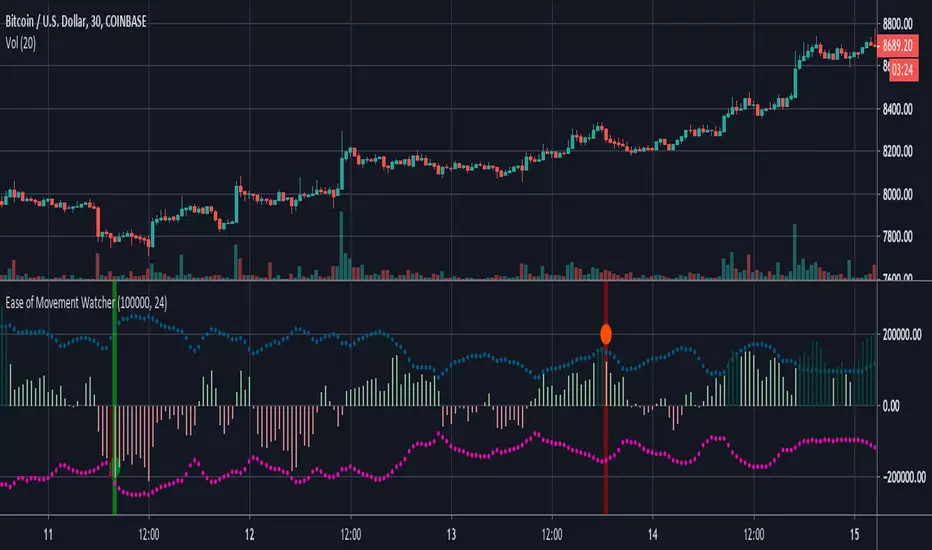
The Chart:
-The histogram represents the Simple Moving Average of EMV Values. The default length is 24, but users can adjust this value at the inputs menu(I've
found 24 works best).
-The teal and pink dotted lines represent the standard deviation of the SMA of EMV values multiplied by 2.5.
-The histogram turns dark green when the EMV SMA is greater than the top teal dotted standard deviations line.
-The histogram turns maroon when the EMV SMA falls below the bottom pink standard deviation line.
How To Use:
Enter a long position when the most recent EMV SMA value was below the lower pink stand. dev. line and the current EMV SMA value rises above that
same pink line. That means the previous bar was maroon and the current bar is not.
If the user enables the option to show entry points, a green dot will be plotted when it is time to enter a long position.
Exit the long position when the most recent EMV SMA value was above the upper green standard deviation line and the current EMV SMA value falls
below that same line. If this is true, then the previous bar will be dark green, and the current will be light green.
If the ‘showExits’ option is enabled, then a red dot will be plotted when it is time to exit the long position.
Input Options:
- 'volumeDiv' : Integer. Used in the calculation of Box Ratio.
- 'lenSMA' : Integer. The length of the Simple Moving Average of Ease of Movement Values.
- 'showStDev' : Bool. If true, dotted green and red lines will be shown at values equal to 2.5 * standard deviation of emvSMA and -2.5 * standard deviation of
emvSMA.
- 'showEntries' and 'showExits' : Bool. If true, a green circle will be plotted at long entry points and a red circle will be plotted at long exit points.
- 'changeBgColor': Bool. If true, the background color will change to green when it is time to enter a long position and red when it is time to exit.
Alerts:
- When it is time to enter a long position, an alert with the message "EMV Tracker - Enter Long" is sent.
- When it is time to exit a long position, an alert with the message "EMV Tracker - Exit Long" is sent.
NOTE:
- I usually use this indicator to confirm signals from other indicators rather than relying on it solely.
- Most accurate signals are generated on 30 minutes with the default input values I've set in the script.
Shoot me a message if you have any ideas for modifications or questions.
~ Happy Trading ~
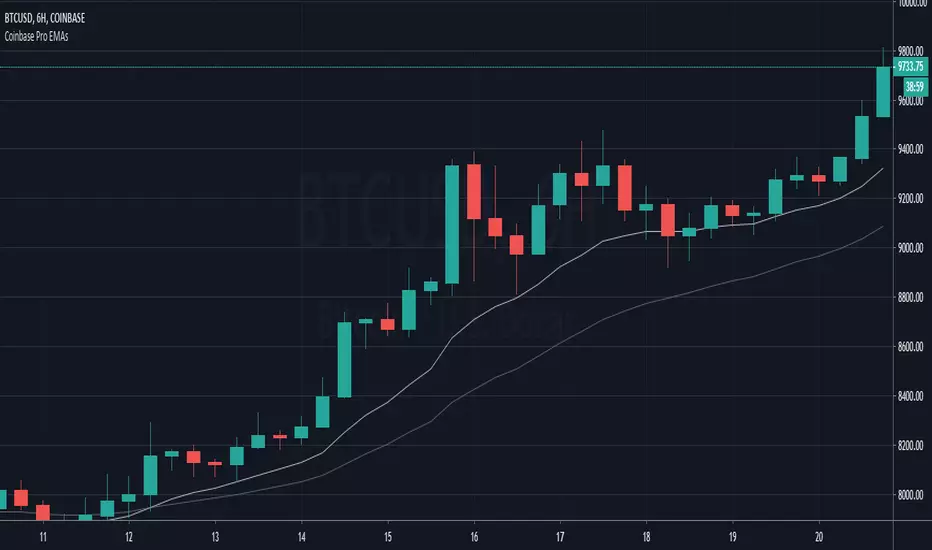
Coinbase Pro EMAsAn indicator to match the only overlays available on Coinbase Pro charts, the EMA12 and EMA26.
Golden Ratio Multiplier: Multiplied Moving AveragesThe script for plotting DMAs from the study made by @PositiveCrypto (twitter)

Golden Ratio Multiplier: Multiplied Moving AveragesMultiplied moving averages script visualizing the study made by @PositiveCrypto (twitter).

bitFlyer DeviationbitFlyer price deviation percent between FXBTCJPY and BTCJPY.
bitFlyerのBTCFXとBTC現物の価格乖離(%)を表示します。

weekend rally bloody mondayTracks the gain-loss of the price on Mondays and the range gain-loss from Monday (configurable) to Sunday. Then, it identifies Sunday's pumps that end with a Monday dump.

What is ProfitableBTC, BNB or your favorite Alt Coin? This indicator shows what is profitable at the moment. Red bars are alt days, green bars are BTC days. Otherwise, it is a BNB day.
Hmm, most of the time it is a BNB day!

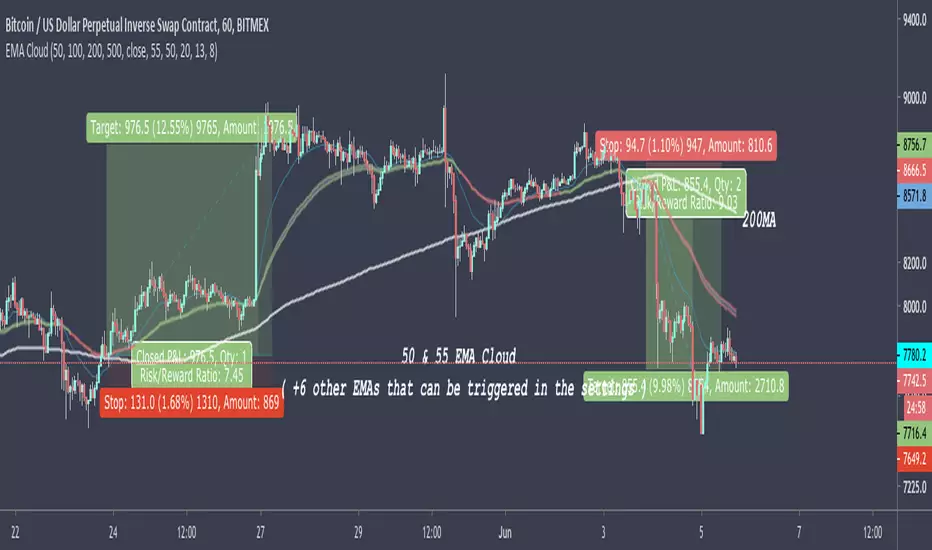
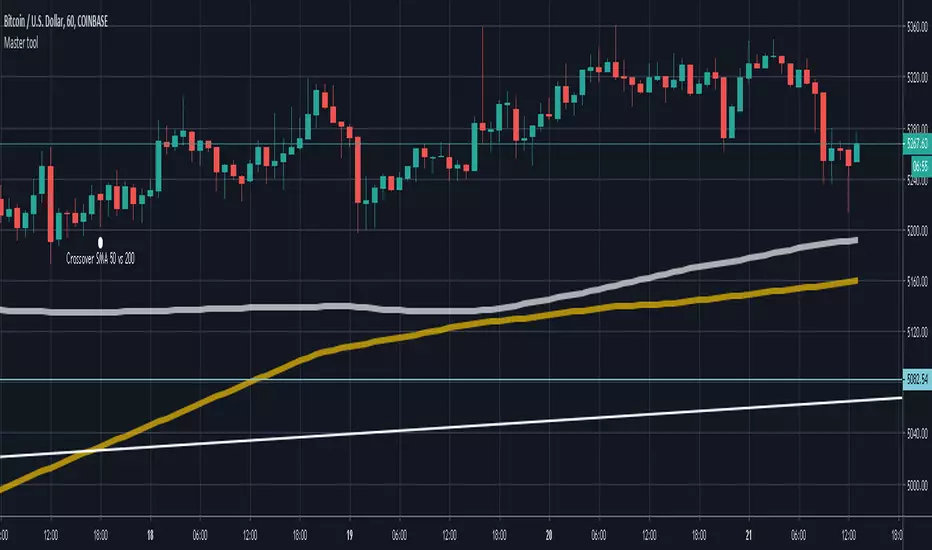
50 & 55 EMA CloudAfter testing thousands of indicators over the years, this simple EMA cloud indicator that I built is still my main weapon. It's always the first one I add to a blank charts and that is not going to change anytime soon.
I find EMAs and MAs are such underrated tools, By observing the price action surrounding these, I can see straight away if it's a good time to get into a trade or not.
As seen here, I also use the 200MA along with the 50/55EMA cloud to find extra strong support and resistances. If price starts to reject both the cloud and the 200MA at the same time/level, then it's a very good indication the price is going to make a big move in that direction as seen here in this chart.
QuantNomad - Pivot Reversal Strategy - XBTUSD - 1hPivot reversal strategy almost always works pretty good for crypto.
Here is setup with 4 left, 4 right bars for pivot points for XBTUSD 1h chart.
It shows a pretty nice performance of 350% with only 10% dd, Sharpe is 1.16.
If you're interested in using this strategy in my scripts you can find alerts for it and a version with added backtesting range.
And remember:
Past performance does not guarantee future results.

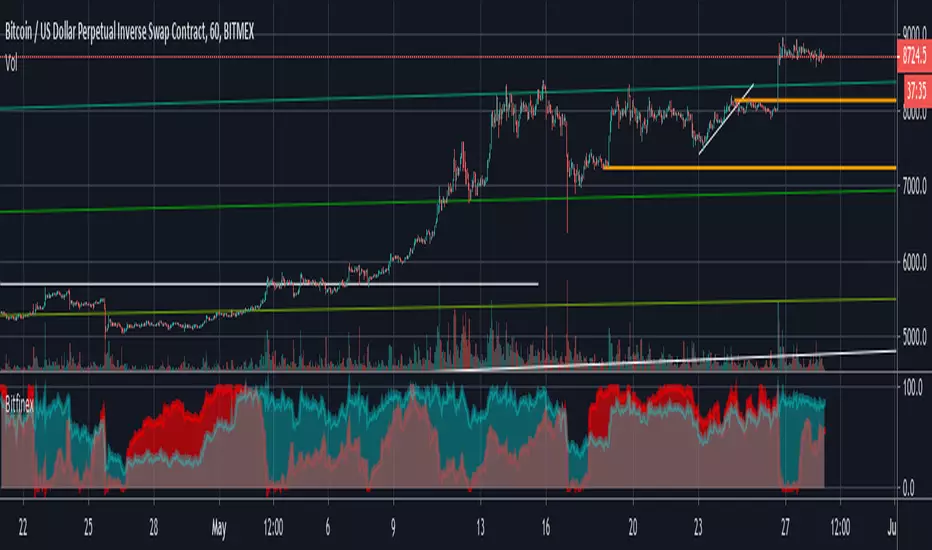
stress Birfinex and BitmexThis script identifies stress points in the major exchanges, recommended use in 1h.
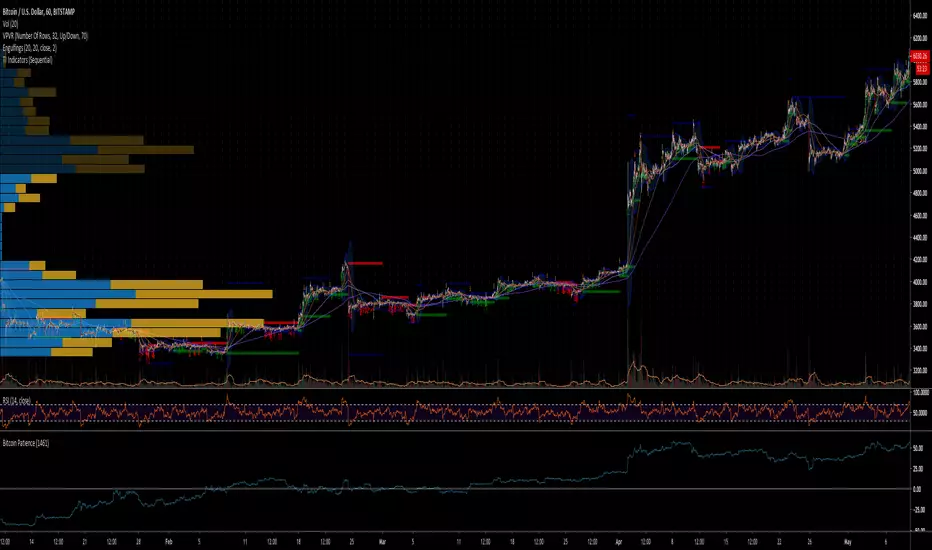
Bitcoin PatienceThis indicator shows how long every Bitcoin buyer ever had to wait to be in profit. Best to use this on the daily chart. At the time of publishing this indicator (May 2019), 1250 days of patience means gains for every BTC buyer ever. Can also be used for other assets of course.
Moving Average Strategy of BiznesFilosofWhat is brilliant is simple! Therefore, this strategy works very well. It is configured on bitcoin. But you can use it for other tools. Only need to change the settings.
Remember that this is not a panacea, but only an assistant! You yourself have to choose which entry and exit points to choose.
In more detail about strategy on my channel in YouTube.
===
Что гениально, то просто! Потому, эта стратегия очень хорошо работает. Настроена она на биткоин. Но можно использовать и для других инструментов. Только нужно поменять настройки.
Помните, что это не панацея, а только помощник! Вы сами должны панимать, какие выбирать точки входа и выхода.
Более подробно про стратегию на моём канале в Ютуб.

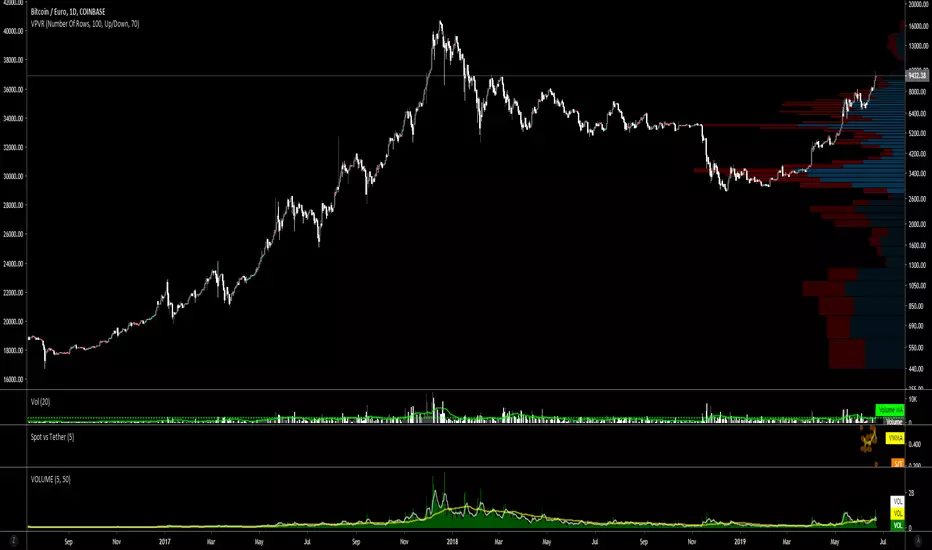
BTC Spot vs Tether Volumespot_volume / tether_volume
spot = Coinbase + bitFlyer + Kraken + Bitstamp
tether = Bitfinex + binance + Huobi + HitBTC

Crypto Indicators #u9tusA set of low timeframe (LTF), medium timeframe (MTF), and high timeframe (HTF) indicators for use in crypto currencies / bitcoin.
Traditionally the 10, 20, 50, 100, and 200 SMAs are used in TA. With cryptos, I've found that the 8 EMA, 21, 55, and 128 SMAs backtest better, while no change in length was necessary for the 200. I wanted to combine all these into one indicator to easily add them to a chart layout, hence this script.
You can customize the length of each MA to your liking in the settings, or accept the defaults.
LTF Indicators:
8 EMA in blue hues, medium line stroke.
MTF Indicators:
21, 55 SMA in purple hues, medium line stroke.
HTF Indicators:
128, 200 SMA in yellow hues, thick line stroke.
Defaults are for daily timeframes and lower; suggest changing up the intervals for weekly and monthly to:
21 -> 30
55 -> 50
128 -> 100
$BTC, $ETH, #ALTS
twitter.com
(c) @jhaurawachsman 20190515

Finex PremiumThis is a simple script for the Bitfinex premium against Bitstamp
Easy to modify values
Simple Moving Average from Justin DartHi All,
This is my 1st script, what I want it to do is cut down on some of the SMA on my chart...
At the same time figure out , how to make a buy call that makes sense ( I Need work on it )...
I'm open to your input and your help...
Thanks...
Justin
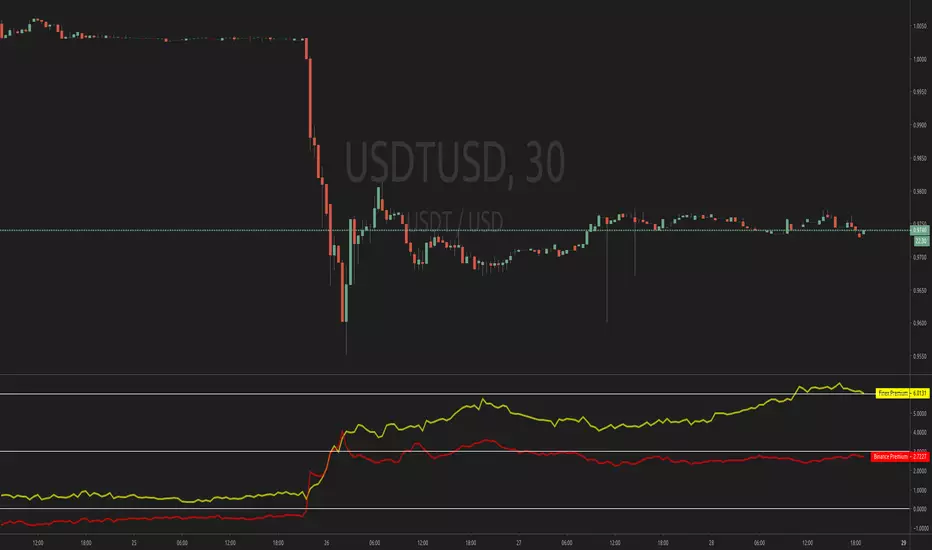
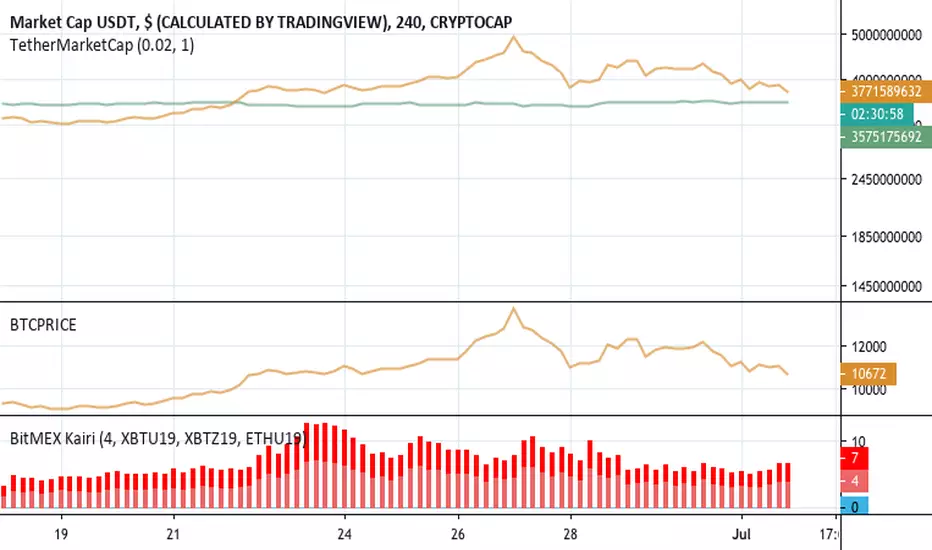
BitMEX KairiBitMEX Kairi
# Abstract
This script shows the divergence between BTC futures price and BTC actuals price of bitFlyer FX and BitMEX in percentage.
Usually, when people bought it or sold it too much on futures , the divergence between actuals and futures are getting expanding.
I believe this is really useful to find when the conversion of the trend happens.
Also supports USDT divergence too. If you wish to enable USDT mode, please check "Show only USDT divergence (Poloniex)" on the settings menu.
Enjoy :)
# Supports:
- BitMEX BTC Futures 3mo (orange)
- BitMEX BTC Futures 6mo (red)
- bitFlyer FX (blue)
- USDTUSD (Poloniex)
# Disclaimer:
This is a free script. Feedbacks are welcome! But I don't have any responsibility when this script has broken or something went wrong.
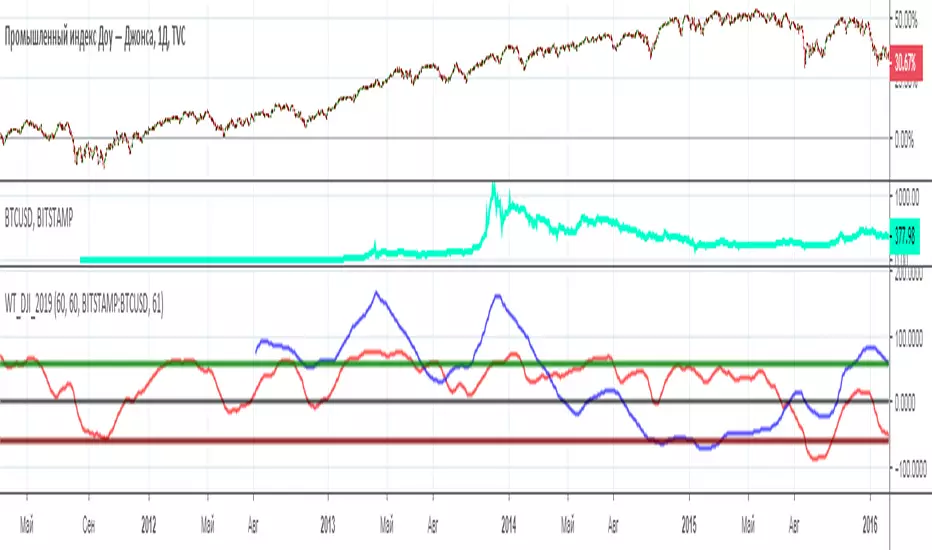
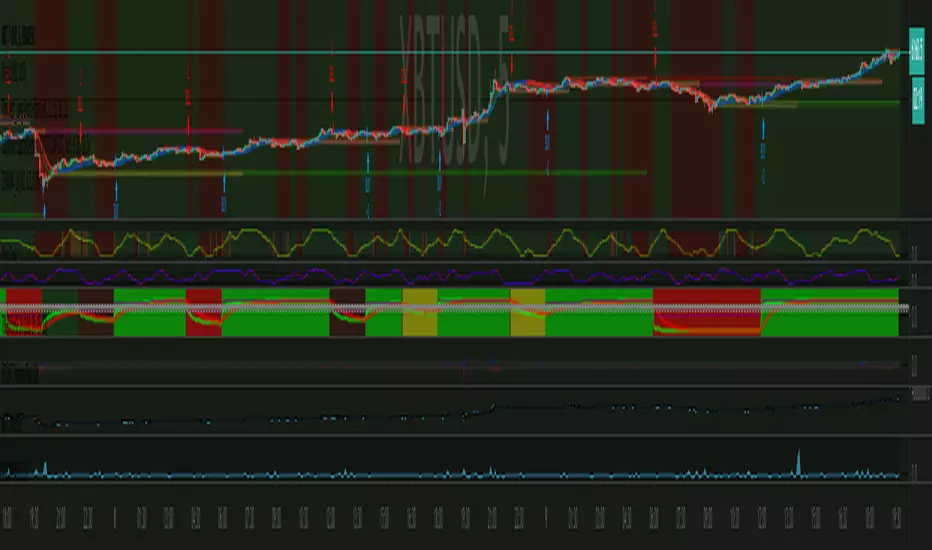
WT_BTC_Dow Jones_2019[wozdux]Comparison of two trading instruments using the indicator. Visual comparison often does not provide complete information. The scale and amplitude of the fluctuations of the two trading pairs are very different. Therefore, it is better to compare indicators from these pairs. I have used for this purpose, the speed indicator of price movement wt. The red line is the wt indicator from the trading instrument that is in the main window. The blue line is an indicator from the pair, which is written in the indicator settings. In addition, the calculation periods for each pair can be taken as the same or different. Often, trading pairs do not fluctuate synchronously, so it is necessary to select the periods of calculation of the wt indicator individually. In this example, Dow Jones and bitcoin were used.
-----------------------
Сравнение двух торговых инструментов с помощью индикатора. Визуальное сравнение часто не дает полной информации. Масштаб и амплитуда колебаний двух торговых пар бывают сильно различаются. Поэтому сравнивать лучше индикаторы от данных пар. Я использовала для этой цели индикатор скорости движения цены wt. Красная линия это индикатор wt от того торгового инструмента, который находится в главном окне. Синяя линия это индикатор от пары, которая прописывается в настройках индикатора. Кроме того, периоды вычислений для каждой пары можно брать как одинаковые, так и разные. Часто торговые пары колеблются не синхронно, поэтому стоит подбирать периоды вычислений индикатора WT индивидуально. В данном примере использовался Доу Джонс и биткоин.