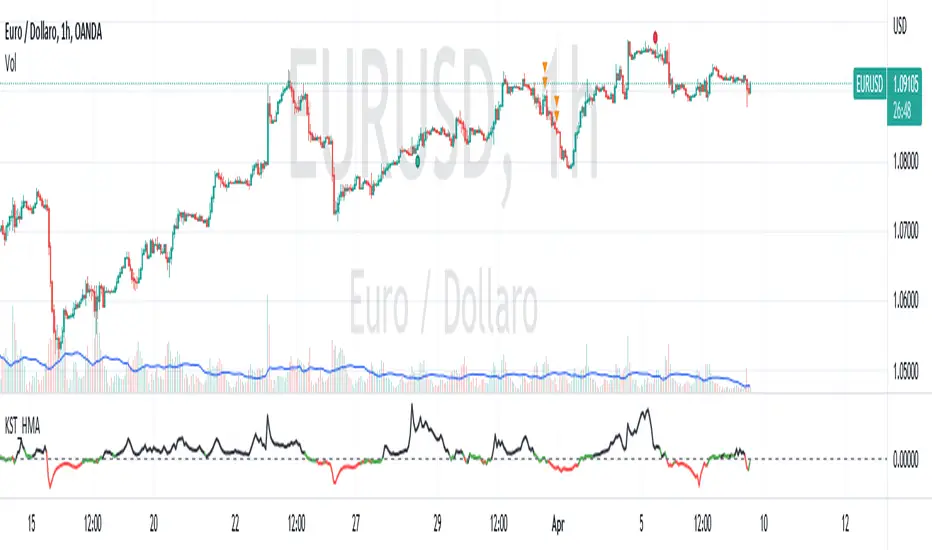
Long-term KST (Know Sure Thing)Description
Long-term Know Sure Thing (KST) oscillator, specifically adapted for non-24h markets such as stocks, indices, ETFs and futures.
This version correctly scales the weekly ROC periods based on the actual trading week length and daily session duration of the instrument — making it accurate across different asset classes (European indices, US equities, crypto, etc.).
Key features:
• Fully customizable trading week (5 days for most stock markets, 7 days for crypto/24h markets)
• Customizable daily session length (8.5h for FTSE MIB/DAX, 6.5h for US equities, 24h for crypto/forex)
• Automatically adjusts bar count per week on any chart timeframe (including Weekly)
• Classic Martin Pring KST parameters (10/13/15/20 ROC weeks, 10/13/15/20 SMA weeks, 1-2-3-4 weighting)
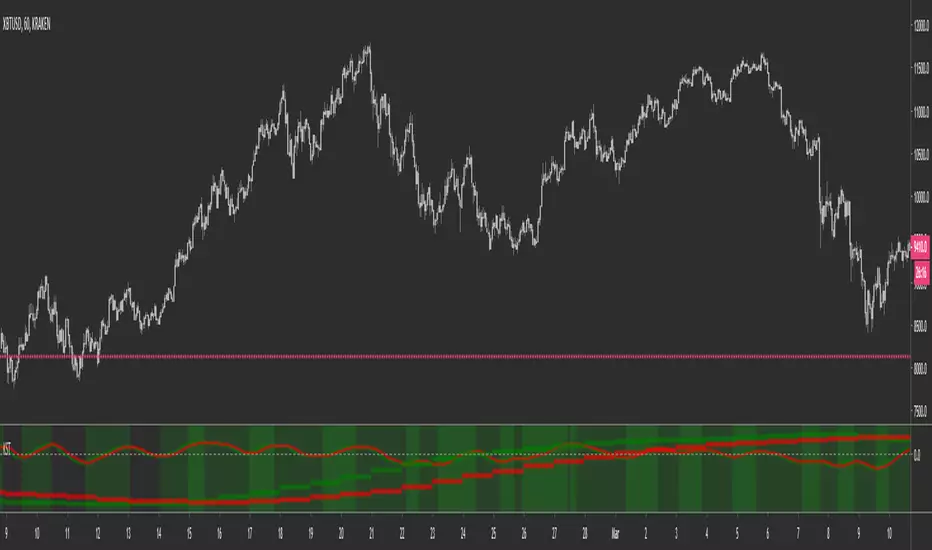
• Includes signal line (SMA of KST) and visual fill between KST and signal (green/red)
What is the Long-term KST used for?
The KST (Know Sure Thing) is a momentum oscillator created by Martin Pring to detect major trend changes, confirm the primary trend direction, and identify significant reversals in medium- to long-term cycles (weeks to months).
Main practical uses:
• Major trend reversals: KST crossing above/below signal line
• Primary trend confirmation: KST above/below zero line
• Classic divergences: Price vs KST divergences often precede important tops/bottoms
• Cycle identification: Helps spot the end of multi-month corrections or the start of new bull/bear phases
• Trend-following filter: Stay long when KST > 0 and rising, stay short when KST < 0 and falling
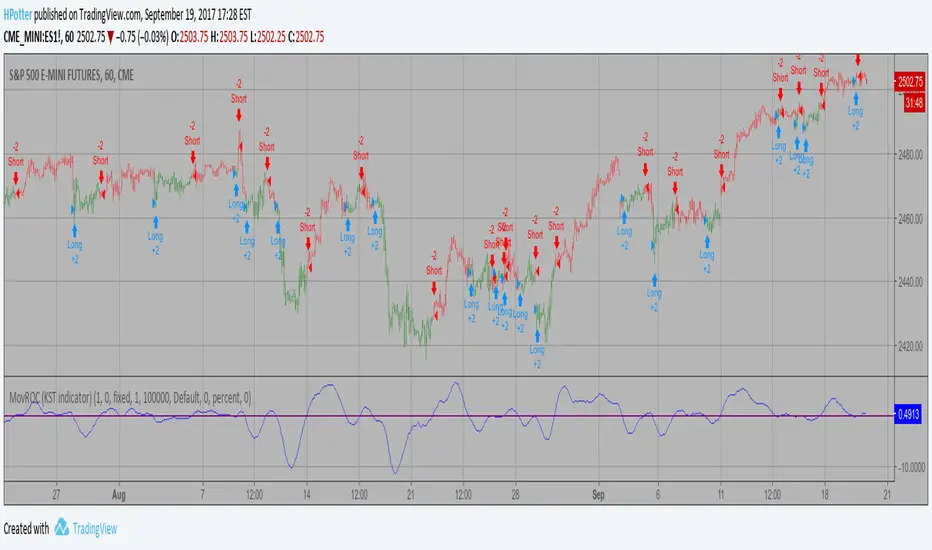
It is especially powerful on major indices (FTSE MIB, DAX, SPX, NDX, RUT, CAC40, Nikkei…) because it captures institutional money flow with fewer, higher-quality signals compared to faster oscillators.
Best used on:
• Daily, 4H, Weekly charts
• European indices (FTSE MIB, DAX, IBEX…)
• US indices/ETFs (SPX, NDX, RUT…)
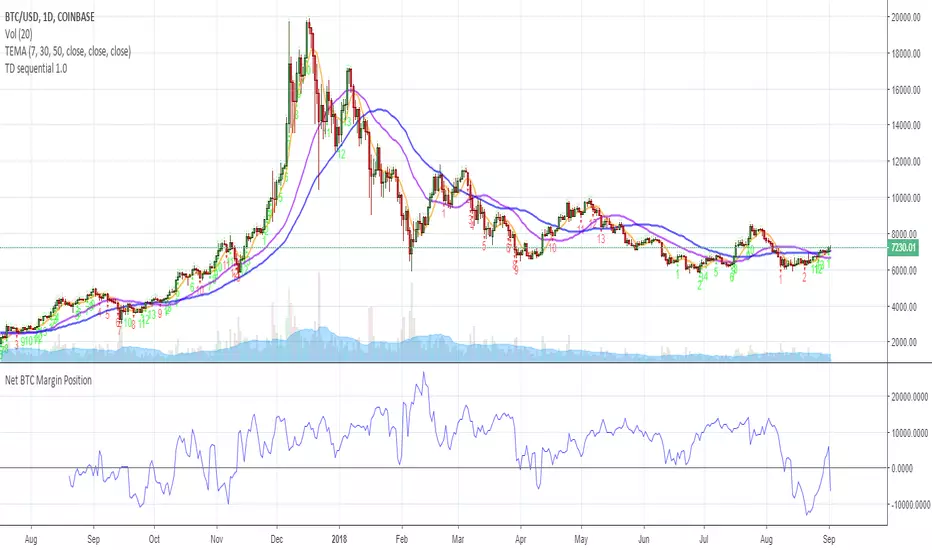
• Crypto pairs (set week_length=7, session_duration=24h)
Enjoy trading the big-picture momentum!
Pine Script®指標