KRX RS OverlayKRX RS Overlay (Manual, Pine v6) (한국어 설명 아래에)
What it does
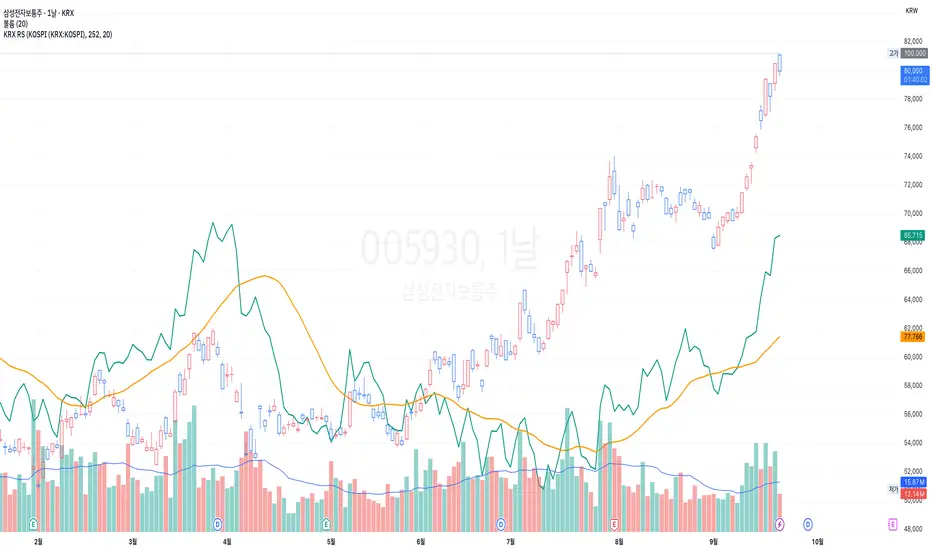
Plots a Relative Strength (RS) line of the current symbol versus a selected Korean market index on the price chart (overlay). RS is computed as Close(symbol) / Close(benchmark) and rebased to 100 N bars ago for easy comparison. An SMA of RS is included for signal smoothing.
Benchmarks (manual selection only)
• KOSPI (KRX:KOSPI) — default
• KOSDAQ (KRX:KOSDAQ)
• KOSPI200 (KRX:KOSPI200)
• KOSDAQ150 (KRX:KOSDAQ150)
Inputs
• Benchmark: choose one of the four indices above (default: KOSPI)
• Rebase N bars ago to 100: sets the normalization point (e.g., 252 ≈ 1 trading year on daily)
• RS SMA length: smoothing period for the RS line
• Show 100 base line: toggle the reference line at 100
How to read
• RS rising → the symbol is outperforming the selected index.
• RS above RS-SMA and sloping up → strengthening leadership vs. the benchmark.
• RS crossing above RS-SMA → momentum-style confirmation (an alert is provided).
Tips
• Works on any timeframe; the benchmark is requested on the same timeframe.
• If the RS line scale conflicts with price, place the indicator on the Left scale (Chart Settings → Scales) or set the series to use the left axis.
Notes
• This script is manual only (no auto index detection).
• Educational use; not financial advice.
⸻
KRX RS 오버레이 (수동, Pine v6)
기능
현재 종목을 선택한 한국 지수와 비교한 상대강도(RS) 라인을 가격 차트 위(오버레이)에 표시합니다. RS는 종목 종가 / 지수 종가로 계산하며, 비교를 쉽게 하기 위해 N봉 전 = 100으로 리베이스합니다. 신호 완화를 위해 RS의 SMA도 함께 제공합니다.
벤치마크(수동 선택만 지원)
• KOSPI (KRX:KOSPI) — 기본값
• KOSDAQ (KRX:KOSDAQ)
• KOSPI200 (KRX:KOSPI200)
• KOSDAQ150 (KRX:KOSDAQ150)
입력값
• Benchmark: 위 4개 지수 중 선택(기본: KOSPI)
• Rebase N bars ago to 100: 리베이스 기준(일봉 252 ≈ 1년)
• RS SMA length: RS 스무딩 기간
• Show 100 base line: 100 기준선 표시 여부
해석 가이드
• RS 상승 → 선택 지수 대비 초과성과.
• RS가 RS-SMA 위 & 우상향 → 벤치마크 대비 리더십 강화.
• RS가 RS-SMA 상향 돌파 → 모멘텀 확인(알림 제공).
팁
• 모든 타임프레임에서 동작하며, 지수도 동일 타임프레임으로 요청됩니다.
• 가격 축과 스케일이 겹치면 왼쪽 스케일로 표시하도록 설정하세요(차트 설정 → Scales).
유의사항
• 자동 지수 판별 기능은 포함하지 않았습니다(수동 전용).
Koreantrader
TOMMAR#TOMMAR #MultiMovingAverages #MMAR
Dear fellow traders, this is Tommy, and today I'd like to introduce you to the Multi-Moving Averages Ribbon (MMAR) indicator, which I believe to be one of the best MMAR indicators available on TradingView. Moving Averages is a popular technical analysis tool used to smooth out price data by creating an average of past price data points over a specified time period. They can be used to identify trends and provide a clearer view of price action, as well as generate buy and sell signals by observing crossovers between different moving average lines.
In the MMAR indicator, we have incorporated 12 different types of Moving Averages, including Simple Moving Averages (SMA), Exponential Moving Averages (EMA), Weighted Moving Averages (WMA), Hull Moving Averages (HMA), and Smoothed Moving Averages (SMMA), among others. This allows traders to choose the optimal type for their preferred trading commodities.
One common technique in technical analysis is using multiple Moving Averages with varying lengths, which provides a more comprehensive view of price action. By analyzing multiple Moving Averages with different timeframes, traders can better understand both short- and long-term trends and make more informed trading decisions. Some of the well-known combinations of multiple moving averages used by traders are (5, 9, 14, 21, 45), (6, 11, 16, 22, 51), [8, 13, 21, 55), (50, 100, 200), and (60, 120, 240).
Another way to gauge the strength of the market trend is to look for the arrangement of the Moving Averages. If they are in a sequential order, with the shortest on top and the longest on the bottom, it is most likely a bullish trend. On the other hand, if they are arranged in reverse order, with the shortest on the bottom and the longest on top, it is most likely a bearish trend. The 'Trend Light' in the indicator settings will automatically signal when the Moving Averages are in either an orderly or reverse arrangement.
Lastly, I have added a useful feature to the indicator: the 'MA Projection'. This feature projects and forecasts the Moving Averages in the future, allowing traders to easily identify confluence zones in future candlesticks. Please note that the projection levels may change in the case of extreme price action that significantly affects the Moving Averages.
This is free so any Tradingview users can use this indicator. Just search TOMMAR in the indicator section located on top of the chart.
#TOMMAR #MultiMovingAverages #MMAR
안녕하세요 트레이더 여러분, 토미입니다. 오늘 여러분들에게 소개드릴 지표는 다양한 길이의 이동평균선 조합을 사용할 수 있는 MMAR (Multiple Moving Averages Ribbon)입니다. 아마 제가 만든 MMAR 지표가 트레이딩뷰에서 가장 쓸만할 겁니다. 이동평균선, 줄여서 이평선은 말 그대로 특정 기간 범위 내의 주가들을 평균한 값들로 이루어진 선입니다. 제가 이평선 관련된 강의 자료는 예전에 올려드린 바 있으니 더 자세한 내용이 궁금하신 분들은 아래 링크/이미지 클릭하시길 바랍니다.
본 지표는 Simple Moving Averages (SMA), Exponential Moving Averages (EMA), Weighted Moving Averages (WMA), Hull Moving Averages (HMA), 그리고 Smoothed Moving Averages (SMMA) 등을 포함해 총 12개 종류의 이평선 지표를 사용할 수 있습니다. 또한 각 이평선의 길이들도 하나하나 일일이 설정하실 수 있습니다. 예를 들어 요즘에 자주 보이는 이평선들의 조합이 , , , , 그리고 등등이 존재하는데 여러분의 취향에 맞게 설정하여 사용하시면 됩니다.
몇 가지 주요 기능에 대해서 설명 드리겠습니다. 설정에서 ‘Trend Light’를 키면 이평선들의 정배열 혹은 역배열 여부를 쉽게 볼 수 있습니다. 이평선이 정배열일때는 맨 아래의 이평선에 초록불이, 역배열일때는 맨 위의 이평선에 빨간불이 켜지며 둘 다 아닐 땐 아무 불도 켜지지 않습니다. 또한 ‘MA Projection’을 키면 이평선들의 미래 예측 값들을 확장해줍니다. 당연히 가격 변동이 갑자기 크게 나오면 이평선 예측 확장 레벨들이 확 바뀌겠죠.
지표창에 TOMMAR 검색하시거나 아래 즐겨찾기 인디케이터에 넣기 클릭하시면 누구나 사용하실 수 있습니다~ 여러분의 구독, 좋아요, 댓글은 저에게 큰 힘이 됩니다.