AB=CD Pattern Educational (Source Code)This indicator was intended as educational purpose only for AB=CD Patterns.
AB=CD Patterns were explained and modernized starting from The Harmonic Trader and Harmonic Trading: Volume One until Volume Three written by Scott M Carney.
Indikator ini bertujuan sebagai pendidikan sahaja untuk AB=CD Pattern.
AB=CD Patterns telah diterangkan dan dimodenkan bermula dari The Harmonic Trader dan Harmonic Trading: Volume One hingga Volume Three ditulis oleh Scott M Carney.
Indicator features :
1. List AB=CD patterns including ratio and reference page.
2. For desktop display only, not for mobile.
Kemampuan indikator :
1. Senarai AB=CD pattern termasuk ratio and rujukan muka surat.
2. Untuk paparan desktop sahaja, bukan untuk mobile.
FAQ
1. Credits / Kredit
Scott M Carney
Scott M Carney, Harmonic Trading: Volume One until Volume Three
2. Pattern and Chapter involved / Pattern dan Bab terlibat
Ideal AB=CD - The Harmonic Trader - Page 118 & 129
Standard AB=CD - The Harmonic Trader - Page 116, 117, 127 & 128, Harmonic Trading: Volume One - Page 42, 51, Harmonic Trading: Volume Three - Page 76 & 78
Alternate AB=CD - The Harmonic Trader - Page 142 & 145, Harmonic Trading: Volume One - Page 62, 63
Perfect AB=CD - Harmonic Trading: Volume One - Page 64 & 66
Reciprocal AB=CD - Harmonic Trading: Volume Two - Page 74 & 76
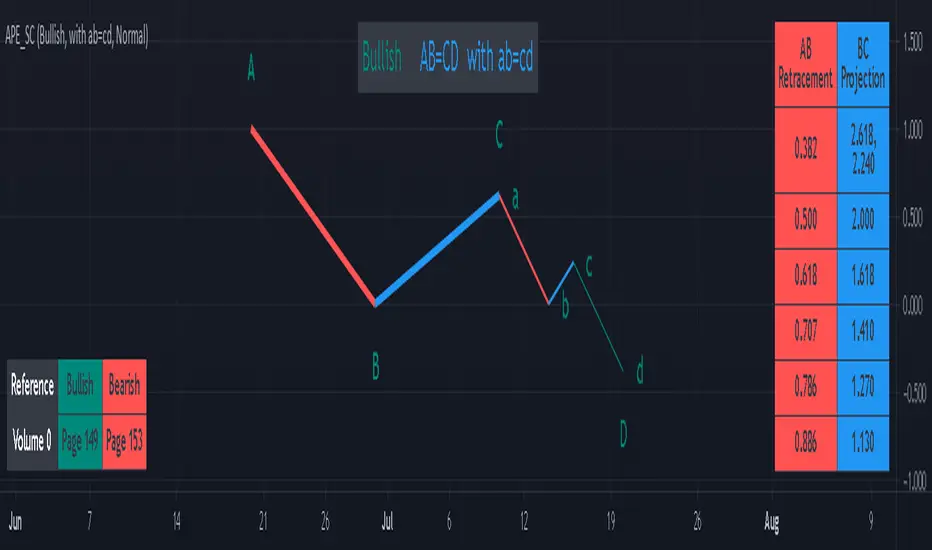
AB=CD with ab=cd - The Harmonic Trader - Page 149 & 153
AB=CD with BC Layering Technique - Harmonic Trading: Volume Three - Page 81 & 84
3. Code Usage / Penggunaan Kod
Free to use for personal usage but credits are most welcomed especially for credits to Scott M Carney.
Bebas untuk kegunaan peribadi tetapi kredit adalah amat dialu-alukan terutamanya kredit kepada Scott M Carney.
Bullish / Bearish Ideal AB=CD
Bullish / Bearish Standard AB=CD
Bullish / Bearish Alternate AB=CD
Bullish / Bearish Perfect AB=CD
Bullish / Bearish Reciprocal AB=CD (Additional value for reciprocal retracement 3.140 and 3.618)
Bullish / Bearish AB=CD with ab=cd
Bullish / Bearish AB=CD with BC Layering Technique