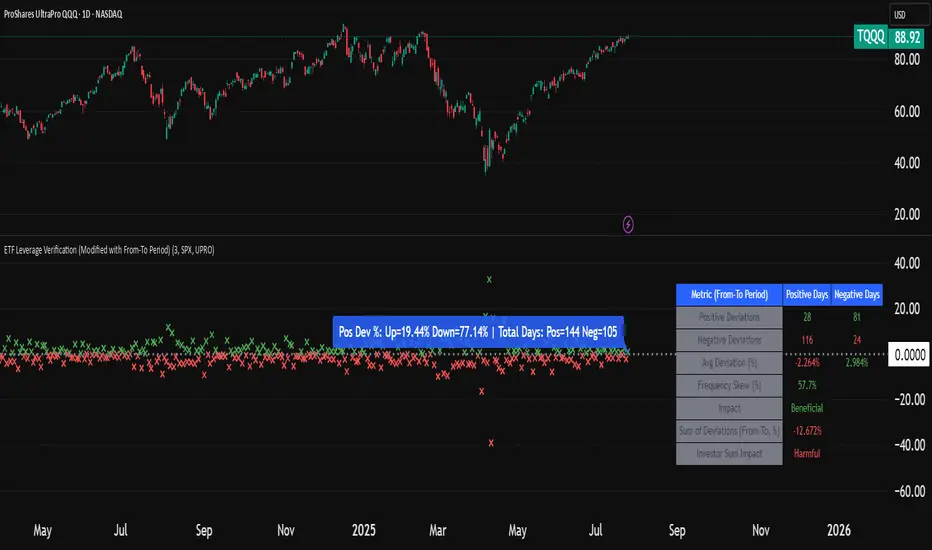
ETF Leverage VerificationDo leveraged ETFs really return what they promise?
Do they return the exact 2x or 3x? Or a slightly different multiple?
How much do they deviate from the promised leverage multiples?
Do these deviations impact investors in a positive or negative manner?
These are the questions that I want to answer with this indicator.
The ETF Leverage Verification indicator challenges the conventional understanding of leveraged ETFs by measuring how they actually perform versus their theoretical targets.
Instead of assuming leveraged ETFs perfectly track their target multiple, this indicator quantifies the real-world behavior by comparing the expected returns versus the actual results on every trading day.
Key Features
Measures actual versus expected performance of leveraged ETFs
Tracks deviation patterns across thousands of trading days
Identifies asymmetric behavior in up versus down markets
Quantifies beneficial "cushioning effect" during market declines
Provides statistical summary of performance patterns
Works with any leverage factor (2x, 3x, -1x, etc.)
Compatible with all leveraged ETFs (equity, bond, commodity, volatility)
How to Use the Indicator
Enter the Expected Leverage Factor (default: 2.0)
Select the Base Asset (underlying index, e.g., SPX)
Select the Leveraged Asset (leveraged ETF, e.g., SSO)
Understanding the Results
Green markers: Days when the ETF outperformed its expected multiple
Red markers: Days when the ETF underperformed its expected multiple
Data Table:
Positive Deviations: Count of days with better-than-expected performance
Negative Deviations: Count of days with worse-than-expected performance
Avg Deviation: Average magnitude of deviation from expected returns
Frequency Skew: Difference between beneficial deviations in down vs. up markets
Impact: Overall assessment of pattern benefit to investors
Summary Label:
Percentage of positive deviations in up and down markets
Total sample size for statistical significance
Key Patterns to Look For
Positive Deviation in Negative Days:
This occurs when a leveraged ETF falls less than expected during market declines. For example, if SPX falls 1% and a 2x ETF falls only 1.8% (instead of the expected 2%), this creates a +0.2% deviation. This pattern is beneficial as it provides downside protection.
Negative Deviation in Positive Days:
This happens when a leveraged ETF rises less than expected during market advances. For example, if SPX rises 1% and a 2x ETF rises only 1.9% (instead of the expected 2%), this creates a -0.1% deviation. This pattern reduces upside performance.
Frequency Skew:
The most critical metric that measures how much more frequently beneficial deviations occur in down markets compared to up markets. A higher positive skew indicates a stronger asymmetric pattern that helps long-term performance.
Mathematical Background
The indicator computes the deviation between expected and actual performance:
Deviation = Actual Return - Expected Return
Where:
Expected Return = Base Asset Return × Leverage Factor
The deviation is then categorized into four possible outcomes:
Positive deviation on positive market days
Negative deviation on positive market days
Positive deviation on negative market days
Negative deviation on negative market days
In short, more positive deviations are good for investors.
Please feel free to criticize. I'm happy to improve the indicator.
Leveragedetfs
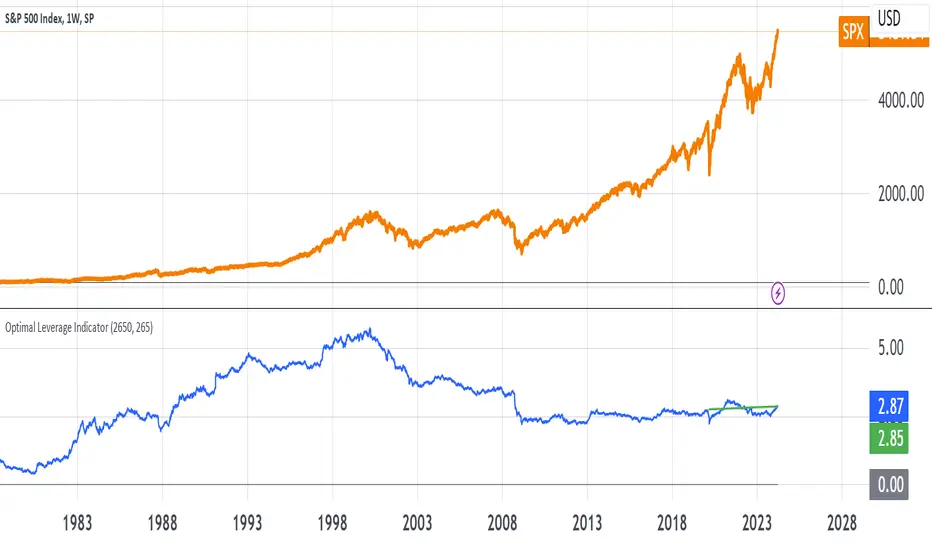
Optimal Leverage IndicatorThe goal of this indicator is to calculate and visualize the optimal leverage and average leverage for a given security based on its historical price data. The optimal leverage is determined by analyzing the relationship between the annualized return and annualized volatility of the security over a specified lookback period.
The methodology can be broken down into the following steps:
Data Input:
The script takes two user inputs: the lookback period and the number of annual trading days.
The lookback period determines the number of historical data points used in the calculations.
The number of annual trading days is used to annualize the return and volatility metrics.
Daily Returns Calculation:
The script retrieves the closing prices of the security on a daily timeframe.
It calculates the daily returns by comparing the current close price with the previous close price.
Mean Return and Volatility Calculation:
The script calculates the mean daily return by taking the simple moving average (SMA) of the daily returns over the specified lookback period.
It also calculates the volatility by taking the standard deviation of the daily returns over the same lookback period.
Annualized Return and Volatility Calculation:
The mean daily return is annualized by compounding it over the number of annual trading days.
The daily volatility is annualized by multiplying it by the square root of the number of annual trading days.
Optimal Leverage Calculation:
The optimal leverage is calculated using the formula: Optimal Leverage = Annualized Return / (Annualized Volatility)^2
This formula assumes that the optimal leverage is proportional to the ratio of the annualized return to the square of the annualized volatility. This is based in this paper: papers.ssrn.com
Average Leverage Calculation:
The script calculates the average leverage by taking the simple moving average (SMA) of the optimal leverage over the specified lookback period.
This provides a smoothed representation of the optimal leverage over time.
The script plots two lines on the chart:
The optimal leverage line (blue) represents the calculated optimal leverage values over time.
The average leverage line (green) represents the average of the optimal leverage values over the specified lookback period.
The main idea behind this methodology is to determine the optimal leverage based on the historical risk-return characteristics of the security. By analyzing the relationship between the annualized return and volatility, the script aims to identify the leverage level that maximizes the return relative to the risk.
The average leverage line provides a smoothed representation of the optimal leverage over time.