線性回歸(LR)

Sniper & Strategy SniperTrading permite detectar los momentos exactos de compra y venta obteniendo un buen rendimiento.
Como aplicarlo:
* Realice una compra cuando el indicador de COMPRA aparezca en la pantalla.
* Realice una venta cuando el indicador de VENTA aparezca en la pantalla.

B3 MTF OHLCMy idea by using Linear regression and some other filters. Great results without repaint :)

Linear regressionThis is my idea by using Linear regression and some other filters. Great result without repaint :)

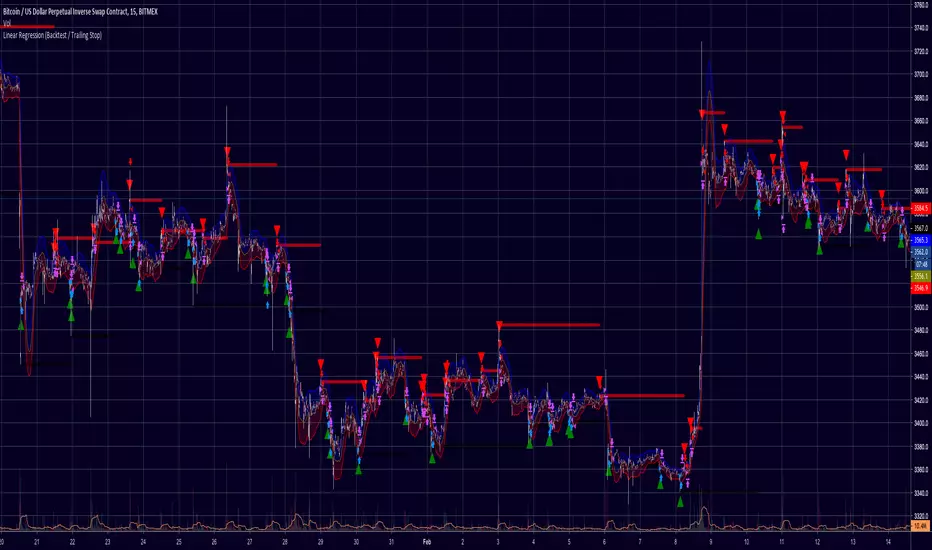
Linear Regression (Backtest / Trailing Stop)A Strategy with Backtest and Trailing Stop for Long/Short
Credits: Study by RafaelZioni - Thanks buddy!
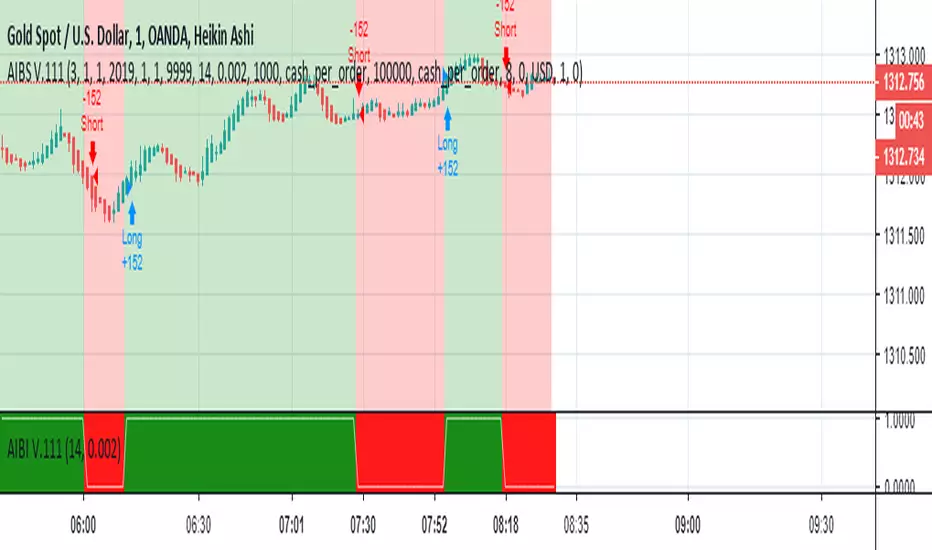
DSS Strategy V.1This is a strategy which can be used as a Decision Support System (DSS). In this version I use Heikin Ashi chart. This strategy works for Long positions.
How to use:
1- Select the Heikin Ashi chart.
2- The default values of Length and Threshold for BTCUSDT in "1H chart" is 2 and 20 respectively. It can be changed to achieve the best performance for BTCUSDT or other symbols in arbitrary time frames.
3. When the background is green buy, and when the background is red sell.

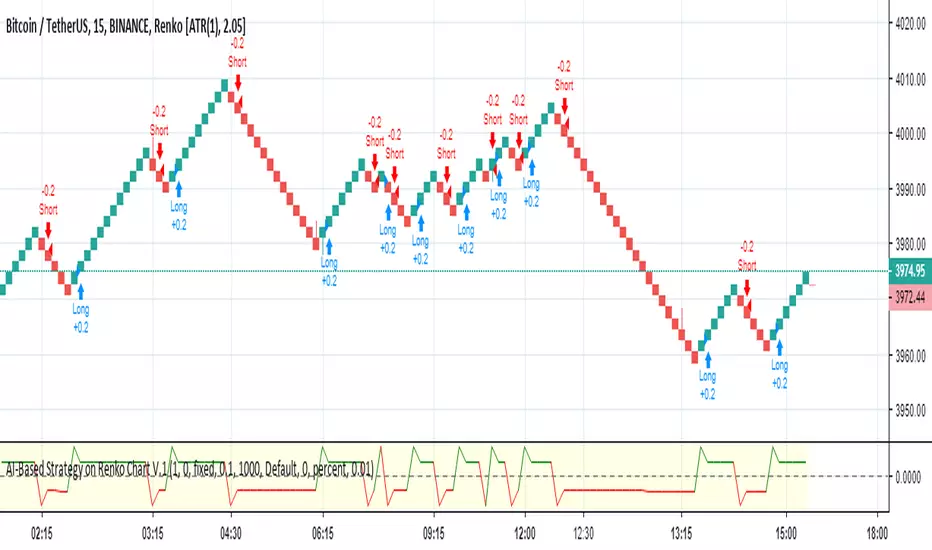
AI-Based Strategy on Renko Chart V.1This is a Strategy based on Artificial Intelligence (AI) algorithms which can be used as a decision support system.
How to use:
1- Select the Renko chart.
2- Set "ATR Length" on settings window to "1". Settings can be seen after right click on the chart.
3- Use arbitrary time frame.
TB!G-Scalp Strategy [Backtest]Scalping Crypto Assets Made Easy
TB!G-Scalp is a TradingView based alert and accompanying strategy PineV3 Script.
Backtest vs Realtime
When designing the algorithms for this strategy our focus was primarily on ease of use.This results in a beautiful yet easy to use scalping strategy. As input it takes a chart period and only one extra parameter for fine tuning. The backtest results are an accurate representation of it’s real-time behaviour.
What makes it tick?
Over the last 2 years we collected a lot of market data regarding Bull and Bear behaviours. This previous market behaviour echo’s into the current market trend.
By recognising these echo’s we are able to anticipate an upcoming micro reversal which eventually end up being a scalping strategy.
Interested
Access is provided to a limited amount of people and for the duration that is determined by it’s Alpha Decay Rate.
This ADR is expected to become problematic after 2.3 year of usage on a lot of 150 users.

AI-Based Strategy V.1
This is a Strategy based on Artificial Intelligence (AI) algorithms which can be used (alone or along with other strategies) as a decision support system.
How to use:
1- The default values of Input 1, Input 2, R, and T for ETHUSDT are “Close”, “ohlc4”, 180, and 0.1325 respectively. They can be changed to achieve the best performance for ETHUSDT or other symbols.
2- Use one of the time frames 15 to 3m.
3. When the background is green buy, and when the background is red sell.
TH_Delta Strategy (Multi-Options TH Strategy Tester)
Strategy Tester is based on TH_RSI Delta, TH_RSIMACD, and a combo of Hull Moving Averages. You will also able to activate include Ichimoku Cloud or a Simple Moving Average.
It also applies colored bars and signals based on overbought/oversold states and RSI crossings.
The tester/signals is disabled by default. You need to activate it in options and then tune the initial capital, % equity options and fees for testing different approaches.
To switch between different tests you just change the number of strategy type and results on screen will be updated accordingly.
You can also define the period of time you need the test to perform on. Default start is Jan 2017 to Jan 2021. Change this as fit.
Remember that the market change pace and volatility. Some timeframes will show you better results with different strat approaches. The same for different kinds of markets/securities.

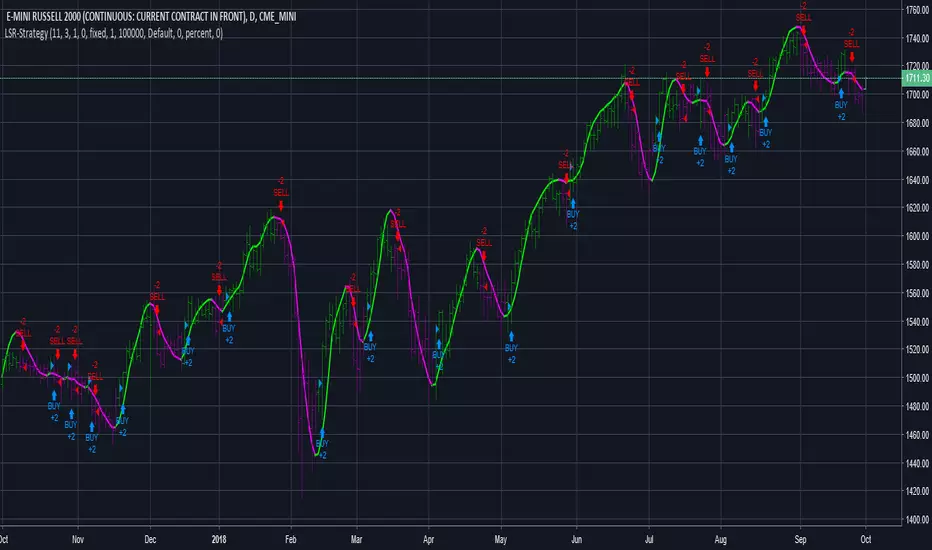
B3 LSR Strategy- "Price Leading MovAvg"B3 Least Squares Regression or "LSR" is very similar to the mid-line at the end of a linear regression channel, except that in a linear regression you cannot see the history of the regression well. There is also the linear regression and least squares curves in some platforms, and this would also be a similar indicator. The smoothness of my indicator and the back-to-basics approach to the mathematics sets it apart from the others. The look of this MA on a chart speaks for itself.
Some people like the flow of this indicator, as it will actually shoot out ahead of price. Most moving averages trail the price action; this one doesn't do that for long before it catches the price or begins to lead price. It isn't necessarily a future price predictor; think of it as a slope stylist. The slope of this indicator determines all painting and signals for the strategy. There are two available versions: with or without order placement.

Jeddingen Divergence Strategy v4Momentum vs. price divergence. Sell signals on bearish divergence, buy signals on bullish divergence .
Strategy includes an RSI filter, limit the time-range for back-testing and lots of other configuration options.
The below example uses stop-losses.
There is also a matching TradingView study with alert-conditions available!
