Line Break Chart StrategyHello All!
We should not pass this year without a gift!
My last publication in 2024 is Complete Line Break Chart Strategy with many features!
What is Line Break Chart?
" Line Break is a Japanese chart style that disregards time intervals and only focuses on price movements, similar to the Kagi and Renko chart styles. Line Break charts form a series of up and down bars (referred to as lines). Up lines represent rising prices, and down lines represent falling prices. New confirmed lines only form on the chart when closing prices break the range covered by previous lines. Users can control the number of past lines used in the calculation via the "Number of Lines" input in the chart settings. The typical "Number of Lines" setting is 3, meaning the chart forms a new up line when the closing price is above the high prices of the last three lines, and it forms a new down line when the closing price is below the past three lines' low prices. If the current price is higher, it is an up line and if it is lower, it is a down line. If the current closing price is the same or the move in the opposite direction is not large enough to warrant a reversal, l then no new line is draw n" by Tradingview. You can find it here
Now let's start examining the features of the indicator:
By using Line break reversals it shows trend on the main chart. You can create alert .
Moreover, you can decide which trade should be taken by using Risk Management in the indicator. You can set the " Maximum Risk " and then if the risk is more than you set then the trade is not taken. When trend changed it checks the distance between reversal level and open price and compare it with the Maximum Risk
Breakout:
It can find breakouts and shows on the chart. You can create alert for breakouts
It can show breakouts on the main chart:
Flip-Flops:
Upon looking at set of price break charts, the trader will notice that there are instances when uptrend blocks is followed by one reversal block, and then by a reversal to a series of uptrend blocks. The opposite is also possible: a series of downtrend blocks is followed by one reversal box and then by an immediate reversal to downtrend. This price action is called a " Flip-Flop ". This structure usually produces trend continuation signal. when we see this then we better use Buy/Sell stop order. lets see this on the chart:
Temporal Sequence Table:
Sequence frequency shows the frequency distribution of the number of sequential highs and the number of sequential lows that have been generated. This is quite important to the trader who is seeking to join a trend or put on a trade when the price break reverses into a new trend direction. For example, if the pattern over the past year has been that there never were more than nine consecutive high closes, it would make sense not to enter a position late into the sequence of new high closes.
also you can see market structure. I have tried to formalize it and show it under the table. so you can understand if it's choppy market.
"Number of Lines" has very important role. While using low time frames such seconds/minutes time frame you may want to choose higher number of lines such 5,6. ( this may minimize the risk of a whipsaw )
Gaps feature:
You can set Gaps on/off. if Gaps on then you can see how long it takes for each box
Reversal and Continuation Probability:
The script calculated Reversal level and Continuation probability of the trend by using Sequence frequency.
It also shows unconfirmed box and current closing price level:
Last but not least it has Overlay option for all items, and can show all items in the main chart!
P.S. I added alerts :)
Wish you all a happy new year!
Enjoy!
Linebreak

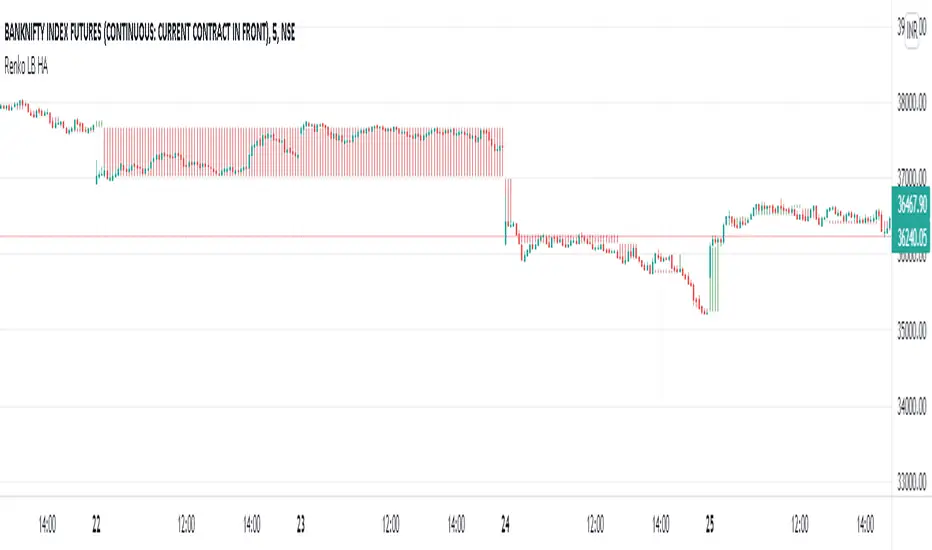
Renko LineBreak HeikinAshi background & MTFWe can have all the 3 types of candle plots (bar styles) over normal candles in the same chart.
We will have better picture on whats happening in specific chart candle type / bar style.
Option provided to turn off/on specific bar type.
Multi time frame is enabled.
Specific time frame can be chosen for individual bar style.
MA Line BreakWhen the security closes above the specified moving average a chart line will be plotted. When it closes below the moving average, no chart line is plotted. A very simplistic way to see the trends a security has when respecting a specific moving average.

HA,Renko, Linebreak,Kagi and Average all Charts Layouts in One This is an educational study, using the security functions provided by @PineCoders(big thanks to them for creating this ) in order to see the difference between multiple candle close plots using:
Heikin Ashi
Renko
Linebreak
Kagi
Average of them all.
Both the different securities and the average can be used as a source for different indicators like moving averages or oscillators getting with them some new and unique opportunities.
If you have any questions, let me know !

Nunchucks✖ Nunchucks
A new way to display market data
Does not flip color during current candle
Displays Higher and Lower than the previous nunchuck's range
Use it with current price line

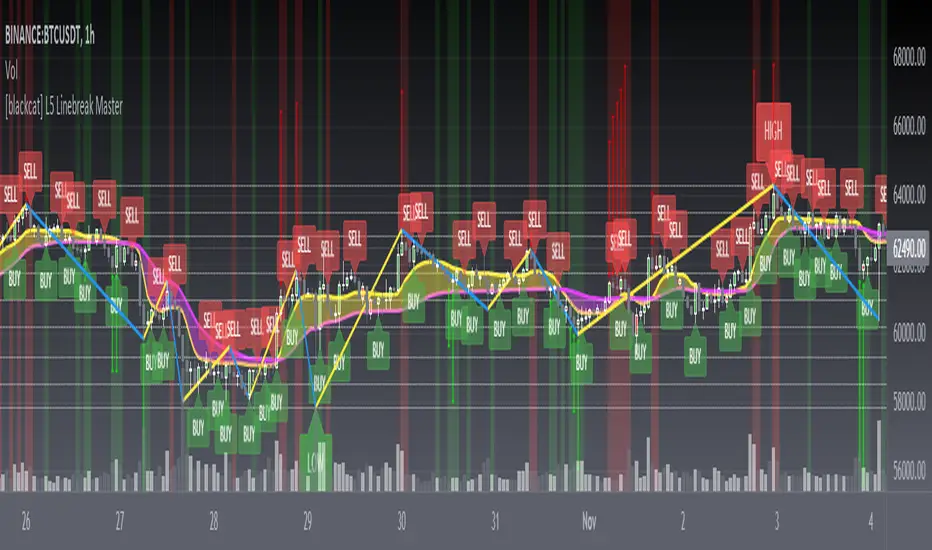
[blackcat] L5 Linebreak MasterLevel: 5
Background
Like many people in the Tradingview community, I have been studying how to apply Line Break Chart to backtesting and live trading for long. However, as we all know, the official Tradingview Line Break Chart is not recommended for backtesting because it will lead to unrealistic backtesting results. So, I thought about developing a Line Break Chart that can be used for backtesting and trading. This "L5 Linebreak Master" is one of them that I am introducing today.
This indicator is based on OHLC data, because this kind of chart can be used for reliable backtesting and live trading in Tradingview. Therefore, the Linebreak Master in this script can actually coexist with the standard Japanese candlestick chart, but the trend reversal information it prompts is based on a principle similar to Line Break Chart. When the two can coexist and produce trading signals at the same time, this is really a very interesting invention.
Function
Linebreak charts were developed in Japan and popularized here by Steve Nisson in his book Beyond Candlesticks. The purpose of linebreak charts is to filter out market noise and give a clear indication of the current trend and trend reversals. As you may know, sometimes determining the current trend can be difficult due to market price movement that consolidates, and a trend reversal can be just as difficult. The green and red bars are called lines. Notice that whenever we have consecutive green lines, each line has a higher close than the previous one; when we have consecutive red lines each line has a lower close than the previous line.
First of all, this Linebreak chart can coexist in the main chart with the Japanese candlestick chart. However, many parts may be overlapped with Japanese candle stick to see it clearly. My recommendation is that users can click "Settings" of main chart and turn off default candle chart.
Secondly, this Linebreak chart can be used for backtesting strategies, because it is essentially OHLC data. And the absolute values of the price is based on the original OHLC data. The certainty of the trend reversal is relatively high. It can be compared with Japanese candlesticks on the timeline.
Finally, this Linebreak chart is embedded with a Linebreak intrinsic trading strategy, which can be used to locate entry points through red and green labels. This strategy supports Tradingview alerts. You can get "LONG" or "SHORT" trading reminders by creating alerts. In order to obtain a clear market structure, Zen Stroke (Autolength ZigZag ), Zen Kiss (Special Moving Averages), Fibnacci Retracement Golden Levels, Unique Fibnacci Time windows and Dynamic Fibonicci support and resistance arrows can be checked to be superimposed and displayed on the main chart to facilitate understanding of the temporal and spatial position of prices in the market.
A trading system based on linebreak charts must must have all entries and exits based on the close or open of a line. The two key values of a linebreak chart are the linebreak number and the underlying time interval. We can construct linebreak charts based on daily, weekly, 5 minute, hourly, any time frame. This allows us to adapt it for day trading or swing trading systems. I developped an inheret linebreak strategy with labels facilitate you to locate trend reversals.
Indicator Set
Linebreak Master Chart (新价图)
Zen Stroke (Auto ZigZag , 自动画缠论笔)
Zen Kiss Moving Averages (缠论均线)
Fibnacci Retracement Golden Levels (半对数-黄金分割线)
Unique Fibnacci Time windows (独创的斐波那契时间窗口)
Dynamic Fibonicci support and resistance arrows (动态斐波那契支撑和阻力箭头)
Inputs
Source Type: Open, High, Low, Close, Hl2, Hlc3, Lx, Vwapc, Vwaplx, Vwaphl2 (Case Sensitive)
Returns source input selection variant, default to "Close" if blank or typo.
Open --> open
High --> High
Low --> Low
Close --> Close
Hl2 --> hl2
Hlc3 --> hlc3
Lx --> Lao Xu 1949 Median Price
Vwapc --> vwap based on close
Vwaplx --> vwap based on Lao Xu 1949 Median Price
Vwaphl2 --> vwap based on hl2
Show Zen Stroke --> True as default
Show Fib Space based on Semi-LOG --> True as default
Zen Fractals Lookback Period --> 377 as default
Key Signal
Bars
Green bars for up trend
Red bars for down trend
Labels
Green labels for buy/long.
Red labels for sell/short.
Zen Stroke ( ZigZag )
Green line section for up stroke
Red line section for down stroke
Moving Averages
Yellow for fast line
Fuchsia for slow line
Pros and Cons
Suitable for discretionary trading and bots via alerts. However, only well selected trading pair and time frame can guarantee bot works.
Intuitive and effective, the output signal is more reliable after multi-indicator resonance
Remarks
My fourth L5 indicator published
Closed-source
Invite-only
How to get it?
500 Tradingview Coins Per Monthly Subscription
5000 Tradingview Coins Per Yearly Subscription
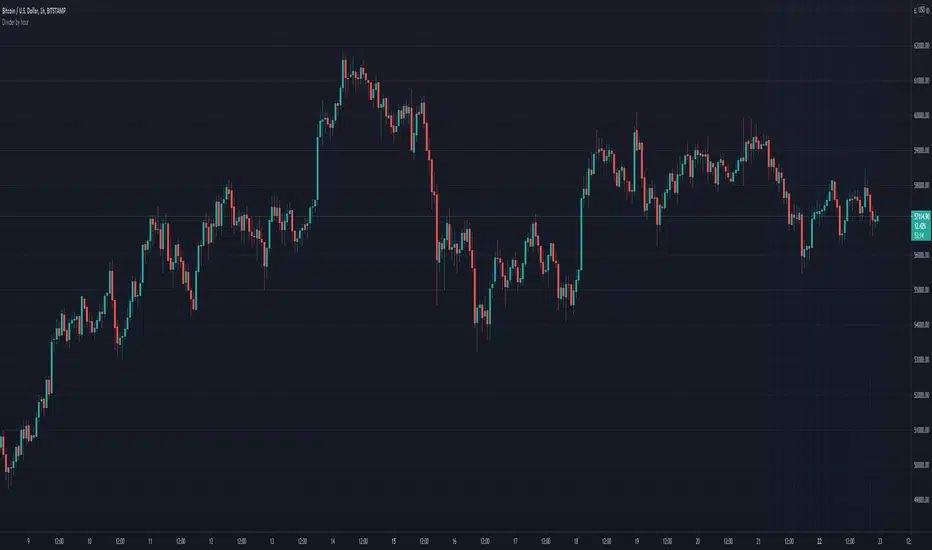
Divider by hourHi,
This script will draw divider lines by the hours of current day so that you can have a better view as your desire.
Shindo Line BreakShindo Line Break
Original indicator by Masao Shindo.
Indicator of trend following.
The line break chart of non-time series is corrected to time series.
It is displayed together with Donchian Channels.
The trend can be visually discerned by the background color based on the line break chart.
The turning price of the trend is displayed.
The timing of entry and exit is clear.
If you would like to use the indicator, please contact the private chat on this account.
神藤ラインブレイク
神藤将男によるオリジナルのインジケーター
トレンドフォローのインジケーター
非時系列の新値三段足を時系列に修正
ドンチャンチャネルを一緒に表示
新値三段足をもとにした背景色で視覚的にトレンドを判別することができる
トレンドの転換価格を表示
エントリーやイグジットのタイミングが明確
インジケーターの使用を希望する方は、このアカウントのプライベートチャットにご連絡ください。

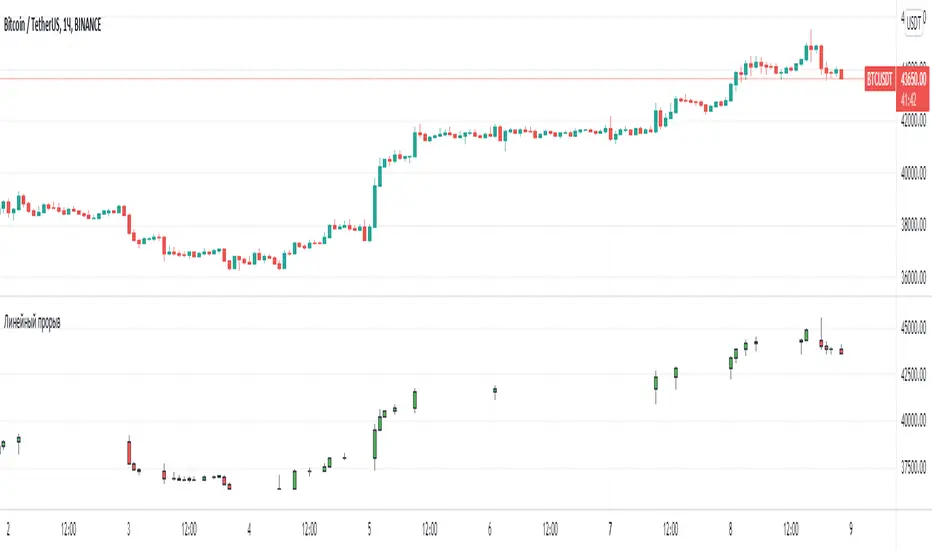
Line breakI decided to help TradingView programmers and wrote code that converts a standard candles / bars to a line break chart. The built-in linebreak() and security() functions for constructing a Linear Break chart are bad, the chart is not built correctly, and does not correspond to the Line Breakout chart built into TradingView. I’m talking about simulating the Linear Break lines using the plotcandle() annotation, because these are the same candles without shadows. When you try to use the market simulator, when the gaps are turned on in the security() function, nothing is added to the chart, and when turned off, a completely different line break chart is drawn. Do not try to write strategies based on the built-in linebreak() function! The developers write in the manual: "Please note that you cannot plot Line Break boxes from Pine script exactly as they look. You can only get a series of numbers similar to OHLC values for Line Break charts and use them in your algorithms." However, it is possible to build a “Linear Breakthrough” chart exactly like the “Linear Breakthrough" chart built into TradingView. Personally, I had enough Pine Script functionality.
For a complete understanding of how such a graph is built, you can refer to Steve Nison's book “BEYOND JAPANESE CANDLES” and see the instructions for creating a “Three-Line Breakthrough” chart (the number of lines for a breakthrough is three):
Rule 1: if today's price is above the base price (closing the first candle), draw a white line from the base price to the new maximum price (before closing).
or Rule 2: if today's price is below the base price, draw a black line from the base price to the new low of prices (before closing).
Rule 3: if today's price is no different from the base, do not draw any line.
Rule 4: if today's price rises above the maximum of the first line, shift to the column to the right and draw a new white line from the previous maximum to the new maximum of prices.
Rule 5: if the price is below the low of the first line, move one column to the right and draw a new black line down from the previous low to the new low of prices.
Rule 6: if the price is kept in the range of the first line, nothing is applied to the chart.
Rule 7: if the market reaches a new maximum, surpassing the maximum of previous lines, move to the column to the right and draw a new white line up to a new maximum.
Rule 8: if today's price is below the low of previous lines (i.e. there is a new low), move to the right column and draw a new black line down to a new low.
Rule 9: if the price is in the range of the first two lines, nothing is applied to the chart.
Rule 10: if there is a series of three white lines, a new white line is drawn when a new maximum is reached (even if it is only one tick higher than the old one). Under the same conditions, for drawing a black reversal line, the price should fall below the minimum of the series of the last three white lines. Such a black line is called a black reversal line. It runs from the base of the highest white line to a new low of price.
Rule 11: if there is a series of three black lines, a new black line is drawn when a new minimum is reached. Under the same conditions, for drawing a white line, called a white reversal line, the price must exceed the maximum of the previous three black lines. This line is drawn from the top of the lowest black line to a new high of the price.
So, the script was not small, but the idea is extremely simple: if you need to break n lines to build a line, then among these n lines (or less, if this is the beginning of the chart), the maximum or minimum of closures and openings will be searched. If the current candles closed above or below these highs or lows, then a new line is added to the chart on the current candles (trend or breakout). According to my observations, this script draws a chart that is completely identical to the Line Breakout chart built into TradingView, but of course with gaps, as there is time in the candles / bar chart. I stuffed all the logic into a wrapper in the form of the get_linebreak() function, which returns a tuple of OHLC values. And these series with the help of the plotcandle() annotation can be converted to the "Linear Breakthrough" chart. I also want to note that with a large number of candles on the chart, outrages about the buffer size uncertainty are heard from the TradingView black box. Because of this, in the annotation study() set the value to the max_bars_back parameter.
In general, use it (for example, to write strategies)!
[RESEARCH] Chart Type IdentifierA viable and workable concept of chart type identification using Pine Script.
Was wollen wir trinken , sieben Tage lang
Was wollen wir trinken, so ein Durst!
Was wollen wir trinken, sieben Tage lang
Was wollen wir trinken, so ein Durst!

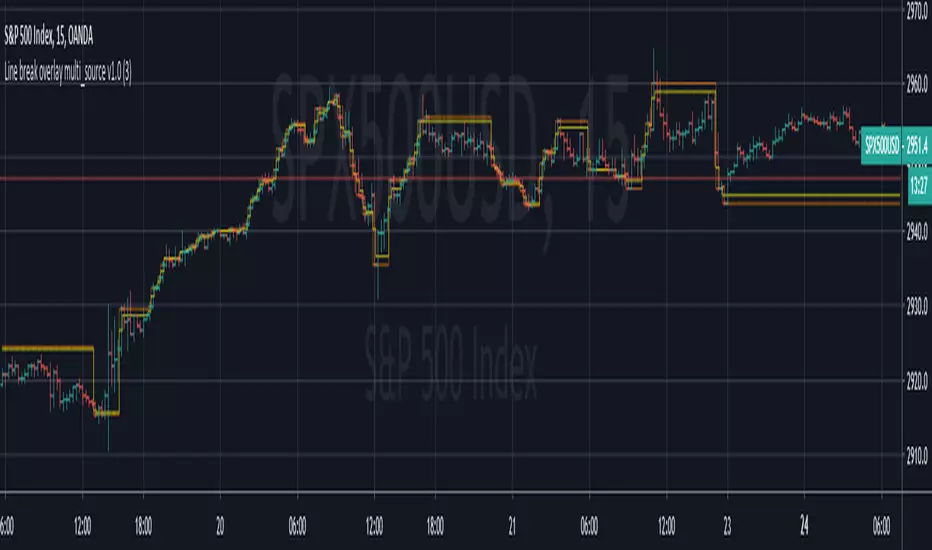
LB overlay multi SRC/TF v1.0Linebreak with adjustable time frame so you can see linebreaks from a resolution other than the current chart's TF.
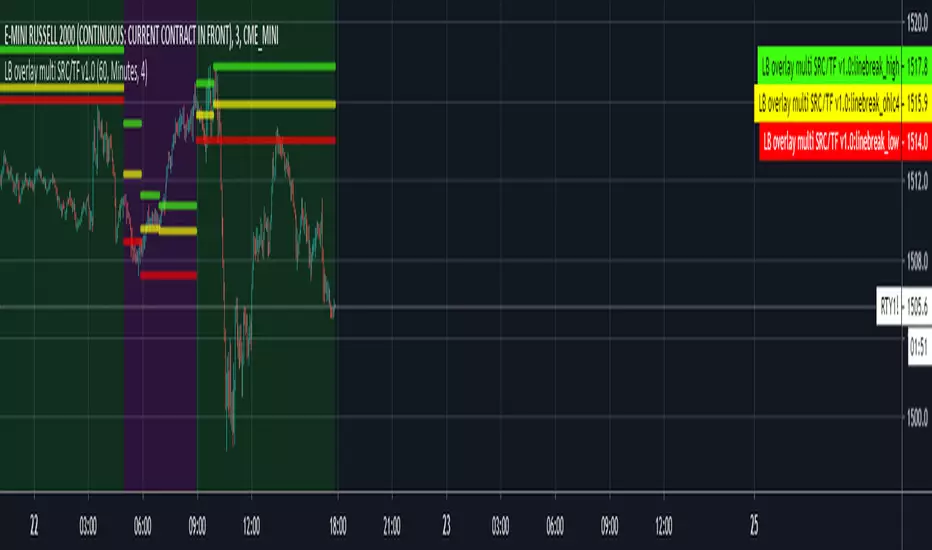
Line break overlay multi_source v1.0This script emulate's the built in linbreak function's functionality. However, I added multiple sources to my script. With the built in function no matter what you pass as the argument for the source it will take close data. List of sources available are below:
close
open
high
low
ohlc4
(high+low)/2
(open+close)/2
(high+low+close)/3
Number of Lines parameter is configurable from 2 to 6.
Please let me know if you have any questions.