Multi-Session Volume Profile Suite [MarkitTick]💡 This indicator provides a sophisticated, institutional-grade Volume Profile analysis suite that renders multiple temporal profiles simultaneously. It is designed for traders utilizing Auction Market Theory who require a holistic view of where value is being established across Daily, Weekly, and Monthly timeframes, alongside custom intraday sessions. By bypassing standard built-in functions in favor of a custom array-based calculation engine, this tool offers granular control over Value Area logic, Point of Control (POC) migration, and multi-timeframe confluence detection.
✨ Originality and Utility
Standard Volume Profile tools often limit traders to a single timeframe or the visible range of the chart. This creates a fragmented view of the market, where a trader might see the daily value but miss the context of the weekly or monthly auction.
This script solves that problem by layering three distinct higher-timeframe profiles (Daily, Weekly, Monthly) plus three customizable intraday session profiles onto a single chart.
● Key Differentiators
Confluence Detection Engine: The script mathematically calculates when the Points of Control (POC) of different timeframes overlap (e.g., Daily POC inside Weekly POC). It explicitly highlights these high-probability zones with specific labels (e.g., "TRIPLE CONFLUENCE"), automating the search for key support/resistance levels.
POC Migration Tracking: Unlike static profiles, this tool tracks the "Shift" of the POC. It visualizes whether value is migrating higher (▲), lower (▼), or remaining neutral (=) compared to the previous period, providing immediate insight into the trend's acceptance.
Synthetic Chart Protection: The script includes logic to detect and prevent usage on non-standard chart types like Heikin Ashi or Renko, ensuring that the volume data processed is accurate and not subject to the repainting often found in synthetic OHLC variations.
🔬 Methodology and Concepts
The core engine relies on a custom implementation of the Volume Profile formula using dynamic arrays. It does not simply pull pre-calculated data but processes the tick volume of the underlying asset relative to price action.
• Volumetric Binning
The script divides the price range of a specific period (e.g., a Day) into a user-defined number of "rows" (bins). As price trades within a specific bin, the corresponding volume is accumulated.
Point of Control (POC): The bin with the highest accumulated volume is identified as the POC. This represents the "Fair Value" or the mode of the distribution for that period.
Value Area (VA): The script calculates the total volume of the profile and then identifies the range surrounding the POC that contains a specific percentage (default 70%) of that volume. It uses a dual-scanning algorithm that expands upwards or downwards from the POC based on which adjacent row has higher volume, mimicking the auction process of testing prices.
• Exact-Anchor Pivots
Simultaneously, the script tracks "Exact-Anchor" pivots. Unlike standard pivots that settle at the close, these track the absolute High and Low of the period (Daily/Weekly/Monthly) in real-time and extend them until a new period begins.
🎨 Visual Guide
The indicator uses a color-coded hierarchy to distinguish between timeframes. Understanding this visual language is critical for interpreting the data.
● Profile Hierarchy (Default Theme)
Daily Profile (Yellow/Gold): Represents the immediate, short-term auction.
Solid Line: Daily POC.
Dotted Line: Daily Value Area High (VAH) and Low (VAL).
Weekly Profile (Blue): Represents the intermediate auction. A solid Blue line indicates the Weekly POC.
Monthly Profile (Purple): Represents the macro auction. A solid Purple line indicates the Monthly POC.
● Labels and Symbols
Right-Side Labels: At the end of profile lines, text labels display the exact price of the POC.
Shift Arrows (▲ / ▼): Located inside the POC label, these arrows indicate the direction the POC has moved relative to the previous period's POC. An Up arrow (▲) suggests buyers are accepting higher prices.
Confluence Labels: If enabled, a text box appears near price action stating "POC CONFLUENCE" or "TRIPLE CONFLUENCE" when the POCs of different timeframes align within a tight margin.
Block Symbol (⬛): A small block icon may appear above bars to denote the center of a specific session's time window.
● Pivot Lines
Orange Lines: Previous Daily High (PDH) and Low (PDL).
Green Dashed Lines: Previous Weekly High (PWH) and Low (PWL).
Red Dotted Lines: Previous Monthly High (PMH) and Low (PML).
White Dashed Line: New York Midnight Open price (if enabled).
📖 How to Use
This suite is designed for "Contextual Trading." It answers the question: Where are we relative to value?
• Trend Acceptance
Observe the Shift Arrows on the POC labels. In a healthy uptrend, you should see a sequence of Daily and Weekly profiles with (▲) arrows, indicating that the market is validating higher prices as fair value. If price rises but the POC remains lower or shifts down, it may indicate a "weak high" or a potential reversal (divergence between price and value).
• Support and Resistance
The POC lines act as high-probability support and resistance. Price returning to a Weekly (Blue) or Monthly (Purple) POC often results in a reaction, as these are areas of significant historical agreement between buyers and sellers.
• The Confluence Play
Pay special attention when the "Confluence" label appears. When a Daily POC aligns with a Weekly or Monthly POC, that specific price level possesses reinforced structural importance. A rejection from such a level is a strong signal; a breakout through such a level often leads to an explosive move as value transitions rapidly.
⚙️ Inputs and Settings
The script is highly customizable via the settings menu.
● General Settings
Row Resolution: Determines the granularity of the profile. Higher numbers (e.g., 100) create smoother, more detailed profiles but use more calculation resources.
Value Area %: Default is 70.0, representing the standard deviation of value.
Show POC Shift: Toggles the (▲/▼) comparison logic.
● Profile Scope
Show Daily/Weekly/Monthly: Checkboxes to individually enable or disable specific timeframe profiles.
Session Lookback: Controls how many historical days/weeks the profiles are kept on the chart.
● Pivots (PDH/PMH/NYM)
Show Pivots: Enables the High/Low lines for previous periods.
Show NY Midnight: Specifically toggles the opening price of the New York session (00:00 EST).
● Alerts
Approach Distance: Sets the sensitivity (in ticks) for alerts when price nears a key POC level.
🔍 Deconstruction of the Underlying Scientific and Academic Framework
This indicator is grounded in Auction Market Theory (AMT) and statistical distribution analysis.
• The Market as a Mechanism
AMT postulates that the primary purpose of the market is to facilitate trade. Price advertises opportunity, while Time regulates the opportunity. Volume is the validation of that price. When the market spends significant time and transacts significant volume at a specific level, it establishes "Value."
• Gaussian Distribution and Central Limit Theorem
A Volume Profile is essentially a histogram of volume over price, often resembling a Gaussian (Normal) Distribution or "Bell Curve" when the market is balanced.
POC (Mode): The peak of the curve. Mathematically, this is the mode of the dataset—the price occurring with the highest frequency (volume).
Value Area (Standard Deviation): In a normal distribution, approximately 68.2% of data points fall within one standard deviation of the mean. This script defaults to a 70% Value Area to approximate this statistical boundary. Prices outside this area are considered statistically significant anomalies or "imbalanced."
• Confluence and Probability
The "Confluence" feature leverages the intersection of independent datasets. If the mode (POC) of a short-term distribution (Daily) aligns with the mode of a long-term distribution (Weekly), the probability of that price representing "True Value" increases exponentially. This aligns with statistical principles where overlapping data clusters suggest a stronger underlying signal amidst market noise.
⚠️ Disclaimer
All provided scripts and indicators are strictly for educational exploration and must not be interpreted as financial advice or a recommendation to execute trades. I expressly disclaim all liability for any financial losses or damages that may result, directly or indirectly, from the reliance on or application of these tools. Market participation carries inherent risk where past performance never guarantees future returns, leaving all investment decisions and due diligence solely at your own discretion.
Liquiditylevels

Visible Range Support and Resistance [AlgoAlpha]🌟 Introducing the Visible Range Support and Resistance 🌟
Discover key support and resistance levels with the innovative "Visible Range Support and Resistance" indicator by AlgoAlpha! 🚀📈 This advanced tool dynamically identifies significant price zones based on the visible range of your chart, providing traders with crucial insights for making informed decisions.
Key Features:
Dynamic support and resistance levels based on visible chart range 📏
User-defined resolution for tailored analysis 🎯
Clear visual representation of significant key zones 🖼️
Easy integration with any trading strategy 💼
How to Use:
🛠 Add the Indicator : Add the indicator to favourites. Adjust settings like resolution and horizontal extension to suit your trading style.
📊 Market Analysis : Identify key support and resistance zones based on the highlighted areas. These zones indicate significant price levels where the market may react.
How it Works:
The indicator segments the price range into user-defined resolutions, analyzing the highest and lowest points to establish boundaries. It calculates the frequency of price action within these segments, highlighting key levels where price movements are least concentrated (areas where price tends to pivot). Customizable settings like resolution and horizontal extension allow for tailored analysis, while the intuitive visual representation makes it easy to spot potential support and resistance zones directly on your chart.
By leveraging this indicator, you can gain deeper insights into market dynamics and improve your trading strategy with data driven support and resistance analysis. Happy trading! 💹✨

Liquidity PoolsThis indicator displays liquidity based on swing highs and swing lows.
Since large liquidity rests above swing highs and below swing lows, the indicator can show swing highs and lows as well so that you can easily find where liquidity stays.
To determine swing high/low, left bars and right bars can be specified on inputs.
How to use this indicator?
You can use this indicator to;
observe how liquidity is used as the market moves.
watch which liquidity will be taken before the market moves and which liquidity will be targeted as the market progresses.
--------------------------------------
リクイディティ(Liquidity)を表示するインジケーターです。
リクイディティとはマネー、注文を指します。
わかりやすくするために、敢えて損切り注文と書いてみましょう。
大きなリクイディティ(損切り注文)はスイングハイの直上(買いのストップオーダー)、スイングローの直下(売りのストップオーダー)に控えています。インジケーターはスイングハイ・ローも同時に表示することができるため、リクイディティ(損切り注文)を容易に特定することが可能です。
使い方
・リクイディティ(損切り注文)が相場が動く中でどのように使われているのかを観察
・マーケットが動く前にどのリクイディ(損切り注文)を取り、トレンドが進展するにつれどのリクイディティ(損切り注文)をターゲットとするかを観察

Buyside & Sellside Liquidity [LuxAlgo]The Buyside & Sellside Liquidity indicator aims to detect & highlight the first and arguably most important concept within the ICT trading methodology, Liquidity levels.
🔶 SETTINGS
🔹 Liquidity Levels
Detection Length: Lookback period
Margin: Sets margin/sensitivity for a liquidity level detection
🔹 Liquidity Zones
Buyside Liquidity Zones: Enables display of the buyside liquidity zones.
Margin: Sets margin/sensitivity for the liquidity zone boundaries.
Color: Color option for buyside liquidity levels & zones.
Sellside Liquidity Zones: Enables display of the sellside liquidity zones.
Margin: Sets margin/sensitivity for the liquidity zone boundaries.
Color: Color option for sellside liquidity levels & zones.
🔹 Liquidity Voids
Liquidity Voids: Enables display of both bullish and bearish liquidity voids.
Label: Enables display of a label indicating liquidity voids.
🔹 Display Options
Mode: Controls the lookback length of detection and visualization, where Present assumes last 500 bars and Historical assumes all data available to the user
# Visible Levels: Controls the amount of the liquidity levels/zones to be visualized.
🔶 USAGE
Definitions of Liquidity refer to the availability of orders at specific price levels in the market, allowing transactions to occur smoothly.
In the context of Inner Circle Trader's teachings, liquidity mainly relates to stop losses or pending orders and liquidity level/pool, highlighting a concentration of buy or sell orders at specific price levels. Smart money traders, such as banks and other large institutions, often target these liquidity levels/pools to accumulate or distribute their positions.
There are two types of liquidity; Buyside liquidity and Sellside liquidity .
Buyside liquidity represents a level on the chart where short sellers will have their stops positioned, and Sellside liquidity represents a level on the chart where long-biased traders will place their stops.
These areas often act as support or resistance levels and can provide trading opportunities.
When the liquidity levels are breached at which many stop/limit orders are placed have been traded through, the script will create a zone aiming to provide additional insight to figure out the odds of the next price action.
Reversal: It’s common that the price may reverse course and head in the opposite direction, seeking liquidity at the opposite extreme.
Continuation: When the zone is also broken it is a sign for continuation price action.
It's worth noting that ICT concepts are specific to the methodology developed by Michael J. Huddleston and may not align with other trading approaches or strategies.
🔶 DETAILS
Liquidity voids are sudden changes in price when the price jumps from one level to another. Liquidity voids will appear as a single or a group of candles that are all positioned in the same direction. These candles typically have large real bodies and very short wicks, suggesting very little disagreement between buyers and sellers. The peculiar thing about liquidity voids is that they almost always fill up.
🔶 ALERTS
When an alert is configured, the user will have the ability to be notified in case;
Liquidity level is detected/updated.
Liquidity level is breached.
🔶 RELATED SCRIPTS
ICT-Concepts
ICT-Macros
Imbalance-Detector

ICT HTF Liquidity Levels /w Alert [MsF]Japanese below / 日本語説明は英文の後にあります。
-------------------------
*This indicator is based on sbtnc's "HTF Liquidity Levels". It's a very cool indicator. thank you.
It has 3 functions: visualization of HTF liquidity (with alert), candle color change when displacement occurs, and MSB (market structure break) line display.
=== Function description ===
1. HTF liquidity (with alert)
Lines visualize the liquidity pools on the HTF bars. Alerts can be set for each TF's line.
Once the price reaches the line, the line is repaint.
To put it plainly, the old line disappears and a new line appears. The line that disappeared remains as a purged line. (It is also possible to hide the purged line with a parameter)
The alert will be triggered at the moment the line disappears. An alert will be issued when you touch the HTF's liquid pools where the loss is accumulated, so you can notice the stop hunting with the alert.
This alert is an original feature of this indicator.
The timeframe of the HTF can't modify. You can get Monthly, weekly, daily and H1 and H4.
Each timeframe displays the 3 most recent lines. By narrowing it down to 3, it is devised to make it easier to see visually. (This indicator original)
2. Displacement
Change the color display of the candlesticks when a bullish candle stick or bearish candle stick is attached. Furthermore, by enabling the "Require FVG" option, you can easily discover the FVG (Fair Value Gap). It is a very useful function for ICT trading.
3. MSB (market structure break)
Displays High/Low lines for the period specified by the parameter. It is useful for discovering BoS & CHoCH/MSS, which are important in ICT trading.
=== Parameter description ===
- HTF LIQUIDITY
- Daily … Daily line display settings (color, line width)
- Weekly … Weekly line display settings (color, line width)
- Monthly … Monthly line display settings (color, line width)
- INTRADAY LIQUIDITY
- 1H … 1H line display settings (color, line width)
- 4H … 4H line display settings (color, line width)
- PURGED LIQUIDITY … Display setting of the line once the candle reaches
- Show Purge Daily … Daily purged line display/non-display setting
- Show Purge Weekly … Weekly purged line display/non-display setting
- Show Purge Monthly … Monthly purged line display/non-display setting
- Show Purge 1H … 1H purged line display/non-display setting
- Show Purge 4H … 4H purged line display/non-display setting
- MARKET STRUCTURE BREAK - MBS
- Loopback … Period for searching High/Low
- DISPLACEMENT FOR FVG
- Require FVG … Draw only when FVG occurs
- Displacement Type … Displacement from open to close? or from high to low?
- Displacement Length … Period over which to calculate the standard deviation
- Displacement Strength … The larger the number, the stronger the displacement detected
-------------------------
このインジケータはsbtncさんの"HTF Liquidity Levels"をベースに作成しています。
上位足流動性の可視化(アラート付き)、変位発生時のローソク色変更、MSB(market structure break)ライン表示の3つの機能を有します。
<機能説明>
■上位足流動性の可視化
上位足の流動性の吹き溜まり(ストップが溜まっているところ)をラインで可視化します。ラインにはアラートを設定することが可能です。
一度価格がラインに到達するとそのラインは再描画されます。
平たく言うと、今までのラインが消えて新しいラインが出現する。という事です。
消えたラインはpurgeラインとして残ります。(パラメータでpurgeラインを非表示にすることも可能です)
アラートはラインが消える瞬間に発報します。上位足の損切り溜まってるところにタッチするとアラートを発報するので、アラートにてストップ狩りに気づくことができます。
このアラート発報については本インジケータオリジナルの機能となります。
表示可能な上位足のタイムフレームは固定です。月足、週足、日足およびH1とH4を表示することができます。
各タイムフレーム、直近から3つのラインを表示します。3つに絞ることで視覚的に見やすく工夫しています。(本インジケータオリジナル)
■変位発生時のローソク色変更
大きな陽線、陰線を付けた場合に、そのローソク足をカラー表示を変更します。
さらに"Require FVG"オプションを有効にすることで、FVG(Fair Value Gap)を容易に発見することができます。ICTトレードにを行うにあたり大変有用な機能となっています。
■MSB(market structure break)ライン表示
パラメータで指定した期間のHigh/Lowをライン表示します。ICTトレードで重要視しているBoS & CHoCH/MSSの発見に役立ちます。
<パラメータ説明>
- HTF LIQUIDITY
- Daily … 日足ライン表示設定(色、線幅)
- Weekly … 週足ライン表示設定(色、線幅)
- Monthly … 月足ライン表示設定(色、線幅)
- INTRADAY LIQUIDITY
- 1H … 1時間足ライン表示設定(色、線幅)
- 4H … 4時間足ライン表示設定(色、線幅)
- PURGED LIQUIDITY … 一度到達したラインの表示設定
- Show Purge Daily … 日足ライン表示/非表示設定
- Show Purge Weekly … 週足ライン表示/非表示設定
- Show Purge Monthly … 月足ライン表示/非表示設定
- Show Purge 1H … 1時間足ライン表示/非表示設定
- Show Purge 4H … 4時間足ライン表示/非表示設定
- MARKET STRUCTURE BREAK - MBS
- Loopback … High/Lowを探索する期間
- DISPLACEMENT FOR FVG
- Require FVG … FVG発生時のみ描画する
- Displacement Type … openからcloseまでの変位か?highからlowまでの変位か?
- Displacement Length … 標準偏差を計算する期間
- Displacement Strength … 変位の強さ(数字が大きいほど強い変位を検出)

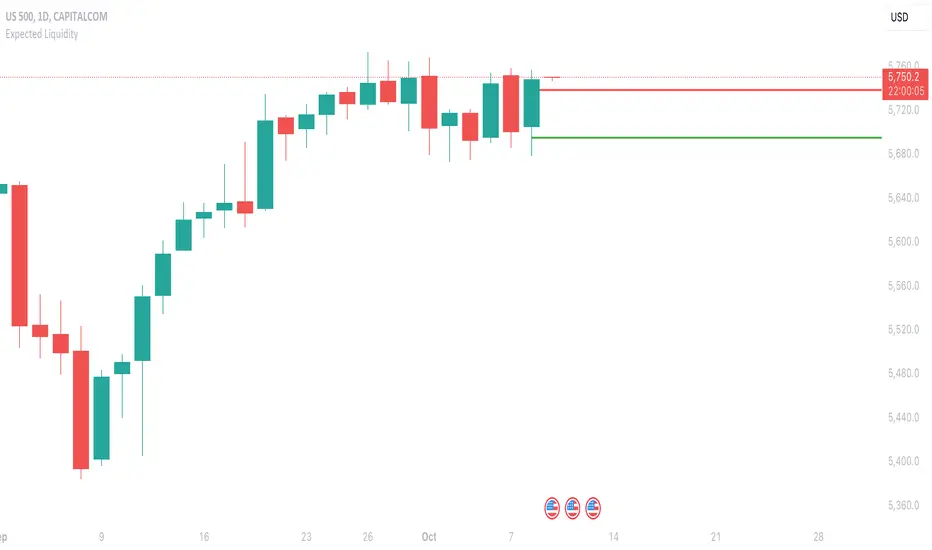
Expected LiquiditySimple but effective script that displays Liquidity Premium/Discount areas in an adaptive way based on key Fibonacci levels.
You can increase or decrease the 'Period' value in the Settings to adjust the gap between the lines as you see fit.
By default the value is '46' which should suit most markets.
- The script contains Alerts which are triggered when a liquidity line is crossed by the price.
Good trading to all and don't forget, risk management remains the most important!
Liquidity Levels MTF - SonarlabThis indicator uses Pivot Points to identify Liquidity Levels in the market. Liquidity Levels are levels in the market where you would expect price to be pulled towards.
Liquidity Levels by Sonarlab also has an option to show Higher Timeframe Liquidity Levels.
Below are the indicators settings:
Liquidity Mitigation Options
The Indicator has options for you to choose what happens to the Liquidity line/boxes once it has been mitigated. Either Keep them on the chart, or remove them.
Display Styles
Choose how the levels are displayed, either with Lines or Boxes.
Set the your Extension options, by keeping the lines/boxes "short" or extend to current price, or maximum to the right
Colors and Styles
Set colors and styles for all lines and boxes

HTF Liquidity Levels█ OVERVIEW
The indicator introduces a new representation of the previous days, weeks, and months highs & lows ( DWM HL ) with a focus on untapped levels.
█ CONCEPTS
Untapped Levels
It is popularly known that the liquidity is located behind swing points or beyond higher time frames highs/lows (in a sense, an intraday swing point is a day high/low). These key areas are said "liquid" because of the accumulation of resting orders, mainly in the form of stop-loss orders. And this more significantly on higher time frames which have more time for stacking orders. As the result, the indicator aims to keep track of untapped levels that have their liquidity states intact.
Liquidity Pools
Once a liquidity level identified, or better, a cluster of liquidity levels work as magnets for the market. The price is more likely to make its way towards heavier pockets of liquidity, by proximity (the closest liquidity pool), and by difficulty (path with less obstacles). This phenomenon is referred as liquidity run, raid, purge, grab, hunt, sweep, you name it. Consequently, the indicator can help you frame a directional bias during your trading session.
█ NOTES
Drawings
Once a level is tapped, it is highlighted. At the end of each day, all tapped levels are cleared.
