PHEN ATLAS - Market Map & Playbook [PhenLabs]📊 PHEN ATLAS 🎂 #50 🎂
Version: PineScript™ v6
📌 Description
The PHEN ATLAS marks a historic milestone as the 50th official release from PhenLabs . This is a critical release you do not want to miss, serving as a comprehensive Market Map and Playbook designed to provide traders with a complete structural overview of price action. By synthesizing Market Structure, Liquidity concepts, and Regime detection, this script solves the problem of "analysis paralysis" by grading price action in real-time. It moves beyond simple indicators by offering a quantified "Playbook" that scores trade setups from 0 to 100, helping traders focus exclusively on high-probability opportunities while automating the complex math of position sizing and risk management.
🚀 Points of Innovation
Proprietary Scoring Engine: Unlike standard indicators, this script assigns a quantitative score (0-100) to every potential trade based on confluence factors like HTF alignment and displacement.
Dynamic Regime Detection: Features an integrated dashboard that classifies the market into specific phases (Expansion, Trend, Range) using ADX and EMA alignment logic.
Smart Liquidity Pools: Automatically identifies and visualizes resting liquidity, tracking when these pools are "swept" to generate high-probability reversal signals.
Integrated Trade Manager: Automates the calculation of Stop Loss, Take Profit (1:2 and 1:3), and Position Size based on account balance and risk percentage directly on the chart.
Multi-Mode Interface: Offers three distinct visual modes—Clean, Pro, and Sniper—allowing users to toggle between deep analysis and clutter-free execution instantly.
🔧 Core Components
Structure Module: Identifies Pivots, Break of Structure (BOS), and Change of Character (CHoCH) to define the current market bias.
Liquidity Engine: Plots liquidity pools at key swing points and detects "Sweeps" where price grabs liquidity before reversing.
Regime Filter: Uses a combination of EMAs (21/50) and ADX to determine if the market is trending or ranging, filtering out low-quality signals.
Setup Validator: Monitors for three specific setup types (Sweep, Snapback, FVG Retest) and triggers alerts only when specific scoring thresholds are met.
🔥 Key Features
Automated detection of High Timeframe (HTF) structure without repainting issues.
Real-time grading of price displacement to validate institutional intent.
Visual Risk/Reward boxes that automatically adjust to the volatility (ATR) of the asset.
Fair Value Gap (FVG) detection with auto-mitigation tracking to clean up the chart.
Customizable alerts for A+ setups, regime changes, and trade invalidations.
Detailed dashboard displaying current Trend, Phase, Bias, and the score of the last setup.
🎨 Visualization
Structure Points: Triangles for BOS and Diamonds for CHoCH events clearly mark trend shifts.
Liquidity Lines: Dotted lines extending from pivots indicate un-swept liquidity pools; these dim automatically when swept.
Setup Signals: Prominent "A+" labels appear on the chart when a setup meets the minimum score threshold defined by the user.
Risk Boxes: Color-coded boxes (Green for Long, Red for Short) show Entry, Stop Loss, and Take Profit levels visually.
Dashboard: A compact table in the bottom right corner provides a "Heads Up Display" of the market state.
📖 Usage Guidelines
Display Mode: Select between 'Clean' for signals only, 'Pro' for full analysis including FVGs and Structure, or 'Sniper' for only high-score setups.
HTF Timeframe: Sets the higher timeframe for structural analysis (Default: 240/4-Hour) to ensure you trade with the dominant trend.
Min Score for A+ Setup: Threshold (0-100) required to trigger a signal (Default: 83); increase this to filter for only the absolute best trades.
Risk %: Defines the percentage of your account you are willing to risk per trade (Default: 1.0%), used for the position size calculation.
Account Balance: Input your current capital (Default: 10,000) to receive accurate unit sizing for every trade setup.
ADX Threshold: Adjusts the sensitivity of the Regime detection filter (Default: 20) to determine when the market is trending versus ranging.
✅ Best Use Cases
Confluence Trading: Use the scoring system to filter discretionary entries, taking trades only when the system scores them above 80.
Prop Firm Trading: Utilize the built-in position size calculator to strictly adhere to risk management rules during evaluations.
Trend Following: Wait for the Regime Dashboard to show "Bullish Expansion" before taking Long "Snapback" entries.
Reversal Trading: Focus on "Sweep Reclaim" setups where price sweeps a liquidity pool and immediately closes back within range.
⚠️ Limitations
This tool is a trend-following and reversal system; it may produce lower scores during undefined, low-volatility chop.
The position size calculator is an estimation based on the entry candle; actual execution slippage is not accounted for.
HTF data relies on closed candles to prevent repainting, which may result in a slight lag during rapid volatility spikes.
💡 What Makes This Unique
Playbook Scoring: Most indicators just give a signal; PHEN ATLAS gives you a "Grade" (e.g., 85/100), allowing you to make informed decisions based on quality, not just frequency.
Context Awareness: The script understands "Market Regime" and creates a context-aware bias, rather than blindly firing signals in a range.
🔬 How It Works
Step 1 - Regime Definition: The script analyzes the 21/50 EMA relationship and ADX to define if the market is in a Trend or Range.
Step 2 - Structure & Liquidity: It maps key pivots and liquidity pools, waiting for a "Sweep" event or a structural break.
Step 3 - Setup Trigger: When a specific pattern occurs (like a Sweep Reclaim), the engine calculates a score based on displacement, volume, and key level alignment.
Step 4 - Execution Logic: If the score > Threshold, the Trade Manager calculates the invalidation point (SL) and projects 2R/3R targets automatically.
🎉 Message From The Team 🎉
2025 was an amazing year. 12 months of building, shipping, and improving together with you. Hitting our 50th indicator release marks one full year of weekly drops , and we couldn't have done it without this community, and of course, BIG thank you to TradingView and it's team.
Thank you for all the feedback, charts, and support. Let's make 2026 even bigger. We can't wait to show you what we've been working on. 🚀
💡 Note
For best results, we recommend using the "Pro" mode during analysis to understand the narrative, and switching to "Sniper" or "Clean" during execution to maintain focus. Always ensure your "Account Balance" input matches your broker balance for accurate risk calculations.
Liquiditypools

Dynamic Liquidity Depth [BigBeluga]
Dynamic Liquidity Depth
A liquidity mapping engine that reveals hidden zones of market vulnerability. This tool simulates where potential large concentrations of stop-losses may exist — above recent highs (sell-side) and below recent lows (buy-side) — by analyzing real price behavior and directional volume. The result is a dynamic two-sided volume profile that highlights where price is most likely to gravitate during liquidation events, reversals, or engineered stop hunts.
🔵 KEY FEATURES
Two-Sided Liquidity Profiles:
Plots two separate profiles on the chart — one above price for potential sell-side liquidity , and one below price for potential buy-side liquidity . Each profile reflects the volume distribution across binned zones derived from historical highs and lows.
Real Stop Zone Simulation:
Each profile is offset from the current high or low using an ATR-based buffer. This simulates where traders might cluster their stop-losses above swing highs (short stops) or below swing lows (long stops).
Directional Volume Analysis:
Buy-side volume is accumulated only from bullish candles (close > open), while sell-side volume is accumulated only from bearish candles (close < open). This directional filtering enhances accuracy by capturing genuine pressure zones.
Dynamic Volume Heatmap:
Each liquidity bin is rendered as a horizontal box with a color gradient based on volume intensity:
- Low activity bins are shaded lightly.
- High-volume zones appear more vividly in red (sell) or lime (buy).
- The maximum volume bin in each profile is emphasized with a brighter fill and a volume label.
Extended POC Zones:
The Point of Control (PoC) — the bin with the most volume — is extended backwards across the entire lookback period to mark critical resistance (sell-side) or support (buy-side) levels.
Total Volume Summary Labels:
At the center of each profile, a summary label displays Total Buy Liquidity and Total Sell Liquidity volume.
This metric helps assess directional imbalance — when buy liquidity is dominant, the market may favor upward continuation, and vice versa.
Customizable Profile Granularity:
You can fine-tune both Resolution (Bins) and Offset Distance to adjust how far profiles are displaced from price and how many levels are calculated within the ATR range.
🔵 HOW IT WORKS
The indicator calculates an ATR-based buffer above highs and below lows to define the top and bottom of the liquidity zones.
Using a user-defined lookback period, it scans historical candles and divides the buffered zones into bins.
Each bin checks if bullish (or bearish) candles pass through it based on price wicks and body.
Volume from valid candles is summed into the corresponding bin.
When volume exists in a bin, a horizontal box is drawn with a width scaled by relative volume strength.
The bin with the highest volume is highlighted and optionally extended backward as a zone of importance.
Total buy/sell liquidity is displayed with a summary label at the side of the profile.
🔵 USAGE/b]
Identify Stop Hunt Zones: High-volume clusters near swing highs/lows are likely liquidation zones targeted during fakeouts.
Fade or Follow Reactions: Price hitting a high-volume bin may reverse (fade opportunity) or break with strength (confirmation breakout).
Layer with Other Tools: Combine with market structure, order blocks, or trend filters to validate entries near liquidity.
Adjust Offset for Sensitivity: Use higher offset to simulate wider stop placement; use lower for tighter scalping zones.
🔵 CONCLUSION
Dynamic Liquidity Depth transforms raw price and volume into a spatial map of liquidity. By revealing areas where stop orders are likely hidden, it gives traders insight into price manipulation zones, potential reversal levels, and breakout traps. Whether you're hunting for traps or trading with the flow, this tool equips you to navigate liquidity with precision.

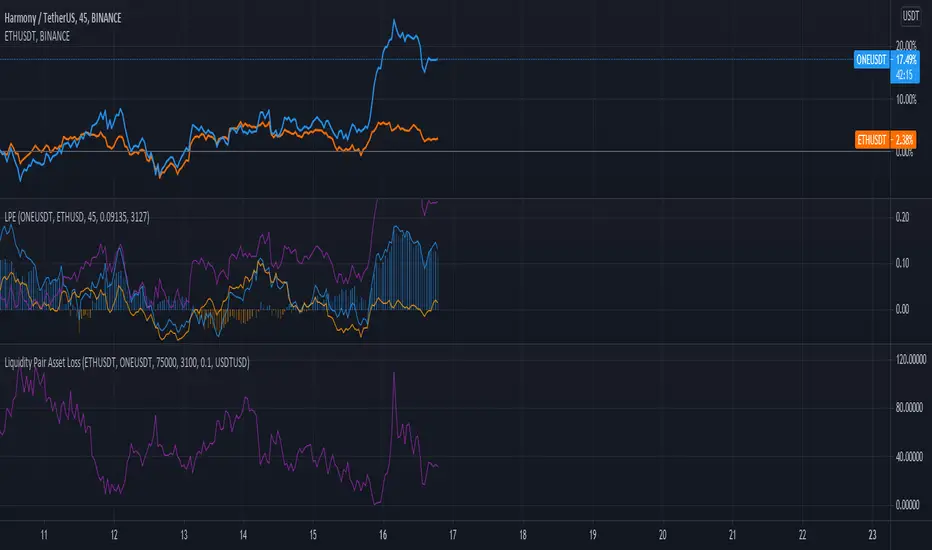
Liquidity Pair Impermanent Asset LossWith limited tracking of impermanent loss for liquidity pairs across all chains, I wanted a very simple display of live dollar value loss in an asset pair. This should allow you to set alerts based on how much you are down and take action if needed. The output column is by default set to show your losses in USD. For those that need it, I also setup an option to track the output in something other than USDT, e.g., GBP or ETH, etc..
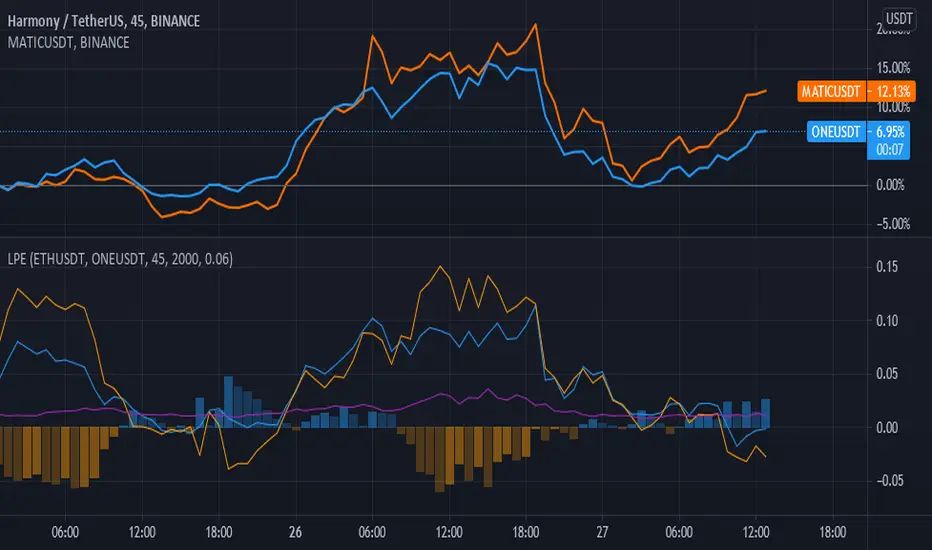
Liquidity Pair EvalWhile there are many tools for generating your impermanent loss in liquidity pools, depending on your choice of chain, I was mostly concerned about monitoring the creep between the pairs. This V0.1 attempt should give us a general comparison of the selected asset returns given your time period and also display the percent loss assuming the initial purchase price values are input correctly.
This is a work in progress and I am open to suggestions to make this even better.