Liquidity Pools [LuxAlgo]The Liquidity Pools indicator identifies and displays estimated liquidity pools on the chart by analyzing high and low wicked price areas, along with the amount, and frequency of visits to each zone.
🔶 USAGE
Liquidity Pools are areas where smaller participants are likely to place stop-limit orders to manage risks at reasonable swing points. These zones attract institutional traders who use the pending orders as liquidity to enter larger positions, aiming to influence price movements. By monitoring these zones, traders can anticipate market movements and potentially benefit from these dynamics.
Beyond general liquidity theory, identifying zones consistently visited by price aids in using them as support and resistance zones. By analyzing these areas, we can assess how effectively participants enter or exit these zones, helping to gauge their importance.
In the screenshots below, we will explore both sides of the same chart in more detail to display how each zone could be viewed from a bullish and bearish perspective.
Bullish Zones Example:
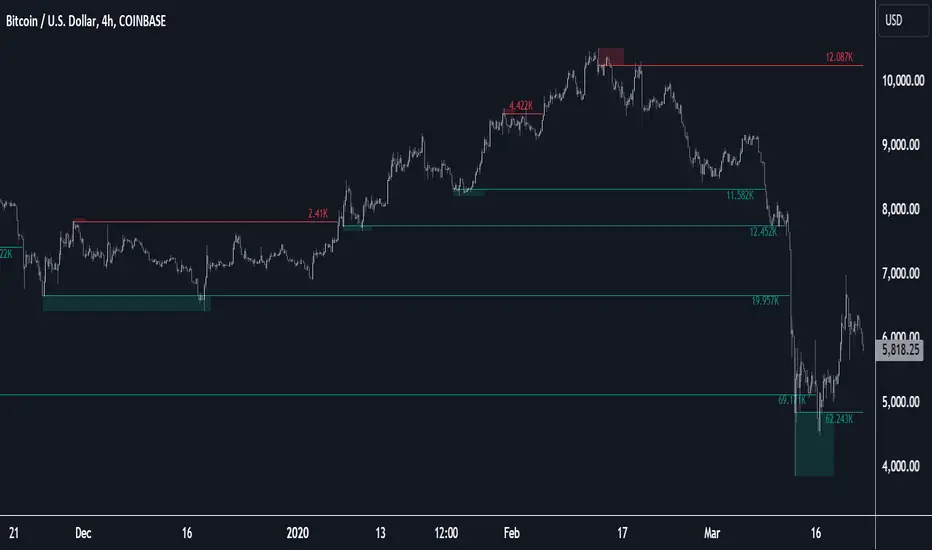
Bearish Zones Example:
🔶 DETAILS
The method behind this indicator focuses on identifying a swing point and tracking future interactions with it. It adaptively identifies high and low "potential zones". These zones are monitored over time; if a zone meets the user-defined criteria, the script marks and displays these zones on the chart.
🔹 Identification
The method to identify Liquidity Pools in this indicator revolves around 3 main parameters. By utilizing these settings, the indicator can be tailored to produce zones that fit the specific strategic needs of each trader.
Zone Identification Parameters
Zone Contact Amount: This setting determines the number of times each zone must be in contact with the price (and bought or sold out of) before being identified by the indicator as a Liquidity Pool.
For example: When a zone is first displayed, it is considered as having been reached 1 time. When the zone is re-tested for the first time, this is considered the 2nd contact, since the price has seen the zone a total of 2 times.
Bars Required Between Each Contact: This is used to rule out (or in) consecutive candles reaching each zone from the calculation, adding a separation length between zone contact points to refine the zones produced.
For example: When set to "2", the first contact point (first re-test) will be ignored by the script if it is not at least 2 bars away from the initial zone proposal point.
Confirmation Bars: After a zone has reached the desired Contact Amount, this setting will cause the script to wait a specified number of bars before identifying a zone. While this might initially seem counterintuitive, by waiting, we are able to watch the market's reaction to the proposed zone and respond accordingly. If the price were to continue through the potential liquidity zone Immediately, it would not be logical to consider this area as a valid Liquidity Pool.
Displayed in this screenshot, you will see the specific points we are looking for in order to identify these zones.
🔹 Display
After a Liquidity Pool is identified, its boundary line is extended to the current price to keep it in view for reference. This extension will continue until the zone is mitigated (price has closed above or below the zone), after which it will stop extending.
Candles can optionally be colored when returning to the most recent Liquidity Pool if it is still unmitigated, and will only color after the zone is displayed on the chart. Because of this, if a candle is colored within a zone, then its color comes from being inside a previously unmitigated zone.
🔹 Volume
Each time a candle overlaps an Unmitigated Zone, a percentage of its volume will be accumulated to the total for each specific zone. The volume total is displayed on the right end of the extended boundary lines.
This volume data could help to determine the importance of specific zones based on the amount of volume traded within.
Note: This volume is fractional to the percentage of candles that are contained within the zone. If a candle is 50% within a zone, The zone will receive 50% of the candle's volume added to its current total.
🔶 SETTINGS
See above for a more detailed explanation of the "Zone Identification" parameters.
Zone Contact Amount: The number of times the price must bounce from this zone before considering it as a liquidity pool.
Bars Required Between Each Contact: The number of bars to wait before checking for another zone contact.
Confirmation Bars: The number of bars to wait before identifying a zone to confirm validity.
Display Volume Labels: Toggles the display for the volume readout for each Liquidity Pool.
Fill Candles Inside Zones: Toggles the display of colored candles within Liquidity Pools.
Pine Script®指標