Candlestick Reversal SystemHello Traders,
In the book "Secrets of a Pivot Boss: Revealing Proven Methods for Profiting in the Market" by Franklin Ochoa, Four different types of reversal systems were introduced and candlestick patterns are used to find reversals. I will not write a lot about the book, you should get/read it for yourself. There are many great ideas in the book, Candlesetick Reversal System, Following Trend, Time Price Opportunity, Advanced Camarilla Concepts and much more.
Reversal systems mentioned in the book are :
- Wick Reversal System
- Exteme Reversal System
- Outside Reversal System
- Doji Reversal System
I tried to add these four reversal systems to the script. If you need detailed info you better read the book ;)
Enjoy!
Lonesometheblue

Donchian Trend RibbonHello Traders,
I think you all know Donchian Channels. so I am not going to write about it.
With this indicator I tried to create Donchian Trend Ribbon by using Donchian Channels.
How it works ?
- it calculates main trend direction by using the length that is user-defined. so you can change it as you wish
- then it calculates trend direction for each 9 lower lengths. if you set the length = 20 then the lengths are 19, 18,...11
- and it checks if the trend directions that came from lower lengths is same or not with main trend direction.
- it changes the trend color of the ribbon.
-
Warning: Entry points may also represents trend reversal. So you should use stoploss line if you decide to take buy/sell positions.
P.S. I didn't backtest it, it's non-repainting, it should be used educational purposes only.
Published by user request. You may want to see following one:
Enjoy!

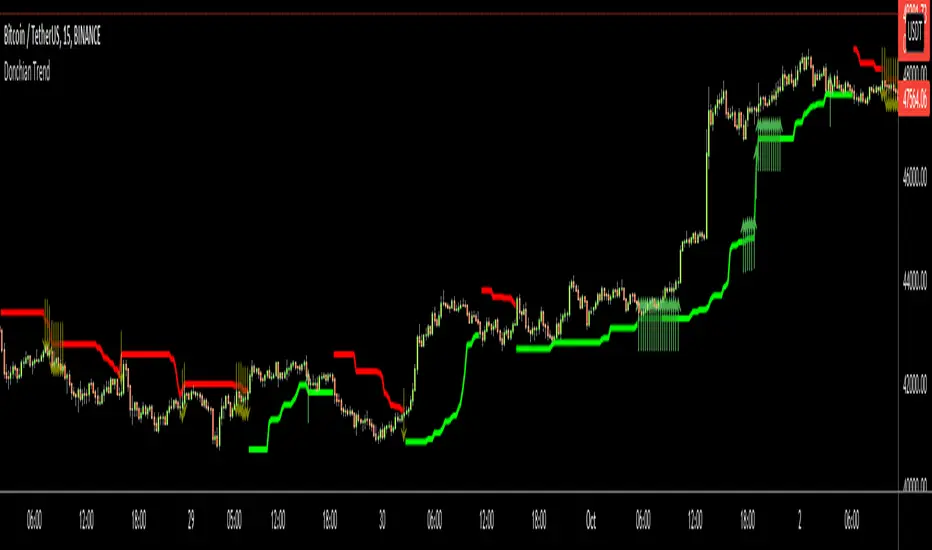
Donchian TrendHello All,
I think all of you knows Donchian Channels . so I am not going to write about it.
With this indicator I tried to create Trend Lines by using Donchian Channel upper/lower bands. I tried add possible entry levels as well.
How it works ?
- it calculates main trend direction by using the length that is user-defined. so you can change it as you wish
- then it calculates trend direction for 9 lower lengths. if you set the length = 20 then the lengths are 19, 18,...11
- and it checks if the trend directions that came from lower lengths is same or not with main trend direction.
- it changes the trendline color. lighter trend line means stonger trend, darker trend lines means entry points or possible trend reversal.
- it puts entry points by using trend directions that were created by using lower lengths. it gets entry points if high/low touches main trend line as well.
Warning: Arrows are entry points but it may also represents trend reversal. So you should use stoploss line if you decide to take buy/sell positions.
P.S. I didn't backtest it, it's non-repainting, it should be used educational purposes only . I believe it can be improved, so I am open for new ideas to improve it ;)
Enjoy!
Divergence Histogram for Many IndicatorHello Traders,
This script analyses divergences for 11 predefined indicators and then draws column on the graph. Red columns for negatif divergence (means prices may go down or trend reversal), Lime columns for positive divergences (means prices may go up or trend reversal)
The script uses Pivot Points and on each bar it checks divergence between last Pivot Point and current High/Low and if it finds any divergence then immediately draws column. There is no Latency/Lag.
There are predefined 11 indicators in the script, which are RSI , MACD , MACD Histogram, Stochastic , CCI , Momentum, OBV, Diosc, VWMACD, CMF and MFI.
Smaller Pivot Point Period check smaller areas and if you use smaller numbers it would be more sensitive and may give alerts very often. So you should set it accordingly.
There is "Check Cut-Through in indicators" option, I recomment you to enable it. it checks that there is cut-through in indicators or not, if no cut-through then it's shown as valid divergence.
You should see following one as well if you haven't yet:
Enjoy!

Pivot Point SupertrendHello All,
There are many types of SuperTrend around. Recently I thought about a Supertrend based on Pivot Points then I wrote "Pivot Point SuperTrend" script. It looks it has better performance on keeping you in the trend more.
The idea is behind this script is finding pivot point, calculating average of them and like in supertrend creating higher/lower bands by ATR. As you can see in the algorithm the script gives weigth to past pivot points, this is done for smoothing it a bit.
As I wrote above it may keep you in the trend more, lets see an example:
As an option the script can show main center line and I realized that when you are in a position, this line can be used as early exit points. (maybe half of the position size)
While using Pivot Points, I added support resistance lines by using Pivot Point, as an option the script can show S/R lines:
And also it can show Pivot Points:
When you changed Pivot Point Period you can see its reaction, in following example PP period is 4 (default value is 2). Smaller PP periods more sensitive trendlines.
Alerts added for Buy/Sell entries and Trend Reversals. (when you set alerts use the option " Once Per Bar Close ")
ENJOY!

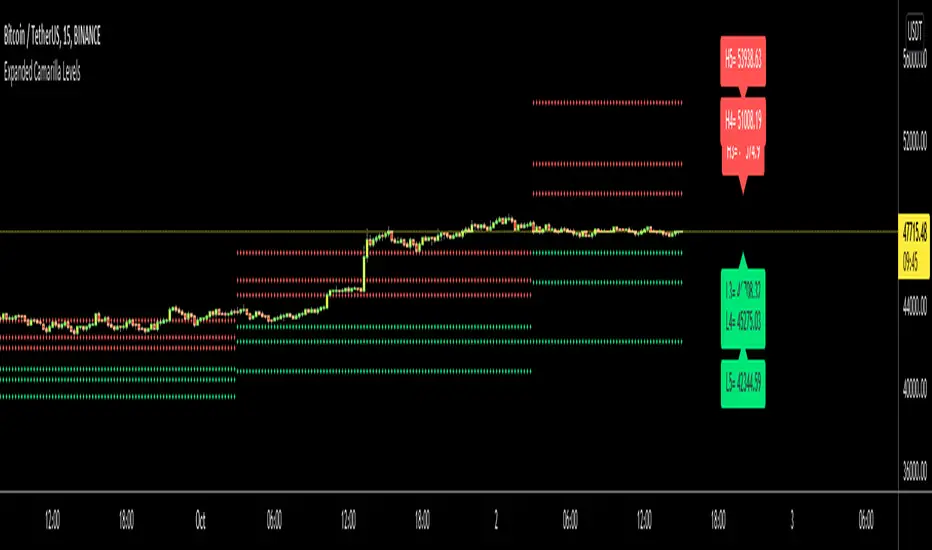
Expanded Camarilla LevelsHello Everyone,
The Expanded Camarilla Level s is introduced in the book " Secrets of a Pivot Boss: Revealing Proven Methods for Profiting in the Market " by Franklin Ocho a. I will not write a lot about the book, you should read it for yourself. There are many great ideas in the book, such using these levels, following trend, time price opportunity, Advanced Camarilla Concepts and much more.
The definition/formula of the levels defined in the book. ( actualy L1, L2, H1 and H2 levels are not used in the strategy, so not shown on the chart )
RANGE = highhtf - lowhtf
H5 = (HIGH/ LOW) * CLOSE
H4 = CLOSE + RANGE * 1.1/2
H3 = CLOSE+ RANGE * 1.1/4
H2 = CLOSE+ RANGE * 1.1/6
H1 = CLOSE+ RANGE * 1.1/12
L1 = CLOSE- RANGE * 1.1/12
L2 = CLOSE- RANGE * 1.1/6
L3 = CLOSE- RANGE * 1.1/4
L4 = CLOSE- RANGE * 1.1/2
L5 = CLOSE- (H5 - CLOSE)
Levels:
Strategy: you need to take care of the candles, as you can see there is bearish candle on first part, and Bullish Candle on second part!
Another Strategy:
An Example:
ENJOY!
Parabolic SAR [with Algorithm and Alerts]Hello All,
In one of my projects I needed Parabolic SAR algorithm. I decided to write it in Pine and publish it. Then I added Alerts and Labels. here it is ;)
ENJOY!

Trend Following MAs 3DHello All,
This is Moving Averages Trend Following 3D indicator. The idea is based on direction of MAs and relation between 20 moving averages (5 to 100 period).
Option to show different type of MAs: EMA, SMA, RMA, WMA, VWMA.
As I haved tested it looks succesful at calculating trend direction and trend strength.
For a better look I tried to make it 3D, it looks good I think, waiting comments ;)
Some screenshots:
By using RMA type:
When it gets tiny it means there is no trend:
An example for down trend:
ENJOY!

Expanded Floor PivotsHello Everyone,
The Expanded Floor Pivots is introduced in the book "Secrets of a Pivot Boss: Revealing Proven Methods for Profiting in the Market " by Franklin Ochoa. He added four new levels: S4, R4, BC and TC. There are many great ideas in the book, such using these levels, following trend, time price opportunity and much more. (Thanks to @tonyjab for pushing me to read this book)
The definition/formula of the levels defined in the book:
r1 = 2 * pivot - Low
r2 = pivot + (High - Low)
r3 = r1 + (High - Low)
r4 = r3 + (r2 - r1)
tc = (pivot - bc) + pivot
pivot = (High + Low + Close) / 3
bc = (High + Low) / 2
s1 = 2 * pivot - High
s2 = pivot - (High - Low)
s3 = s1 - (High - Low)
s4 = s3 - (s1 - s2)
The area between TC and BC is used as Pivot Channel, (blue area in the chart). you can see how it helps on identifying the trend.
Options:
By default the script decides Higher Time Frame but if you want you can set HTF as you wish.
You can choose line style as: Solid, Circles or Cross
and also you have option to show only last period or all historical levels.
Enjoy!

Trend Lines for RSI, CCI, Momentum, OBVHello Traders!
After publishing Trend Lines for RSI yesterday, I realized that Trend Lines for more indicators needed by the traders. so I decided to make it for four different indicators: RSI, CCI, OBV, Momentum
In the indicator options you can choose the indicator from pull-down menu.
How it works?
- On each bar it finds last 10 higher and lower Pivot Points (PP) for the indicator.
- from first bar to 10. Pivot Point it searchs if a trend line is possible
- for each PP it starts searching from the last PP .
- it checks if drawing a trend line possible or not and also it's broken or not
- if it's broken then optionally it shows broken trend lines as dotted (or you can option not to see broken lines)
- if it finds a continues trend line then it stops searhing more and draw trend line, this is done by checking angles (I did this to make the script faster, otherwise you may get error because of it needs time more than .2sec)
- the script makes this process for each PP
- then shows the trend lines
P.S. it may need 3-10 seconds when you added the script to the chart at first (because of calculations)
Trend lines for CCI:
Trend Lines for OBV
Trend Lines for Momentum:
You may want to watch how Trend Lines script works (that was made for RSI)
s3.tradingview.com
If you still didn't see Trend Lines v2 then visit:
All Comments are welcome..
Enjoy!

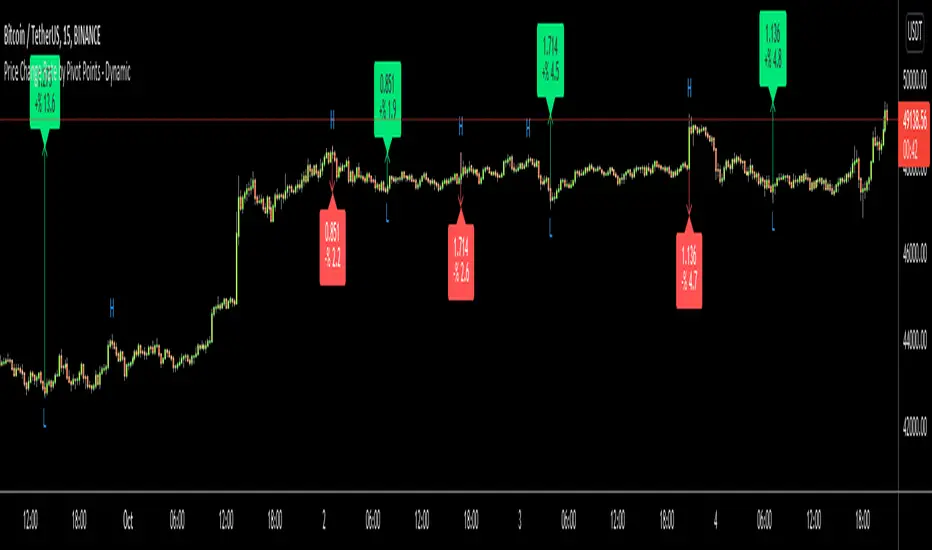
Price Change Rate by Pivot Points - DynamicHi Everyone
Usually I need Price Change info and I believe most of you need this info too. I want to see how it increased/decreased. I automate this by using Pivot Points.
it works dynamically and it uses Pivot Highs and Pivot Lows accordingly. That means it calculates which one to use.
Please watch following video:
Enjoy!
Trend FollowerHello Traders!
While analysing the charts, one of the biggest problem is to see if there is trend or not, or is it in a congestion zone/area? While thinking about it, I found the idea to analyse moving averages in channel and their momentum according to channel width.
How it calculates and works?
On each bar it creates a channel by highest/lowest point of a MA. highest point is upper point and lowest point is lower point of the MA channel,
It gets highest and lowest point of last 300 bars, (say Price Channel )
If the width of MA channel is greater than certain rate of price channel then it decides there is trend
After it decided there is trend, it calculates the rate between channel and MA. Bigger result means stronger trend.
According to rate of MA channel and the price channel , bar color becomes lighter/darker. so when you look at the bar color you can see the trend strength.
Short explanation on the chart:
Also by changing channel or size other options (such MA length etc) you can see congestion zones/areas:
Another one, about trend direction and its strength:
Options:
You can choose following MA types as source: EMA, SMA , RMA, WMA , VWMA
"Period to Check Trend" is the period to create MA channel. Bigger period cause more sensitivity.
MA Period is the Length of the MA that will be checked
"Trend Channel Rate %" is rate of price channel . Price channel created by using highest/lowest of last 300 bars. I did this to make the script works on all time frames correctly.
"Use Linear Regression" is used to get rid of noise. it may cause 1-2 bars latency. (I use it)
The idea was created by LonesomeTheBlue.
Enjoy!

Trend Following Moving AveragesWhile analysing a chart, one of the biggest problem is to see if there is trend or not. While thinking about it, I found the idea to analyse moving averages in channel and their momentum according to channel width. I already published it as Trend Following Bar as you see at bottom of the chart.
How it Works?
On each bar it creates a channel by highest/lowest point of a MA. highest point is upper line and lowest point is lower line of the MA channel,
It gets highest and lowest point of last 300 bars, (say Price Channel )
If the width of MA channel is greater than certain rate of price channel then it decides there is trend
After it decided there is trend, it calculates the rate between channel and MA. Bigger result means stronger trend.
According to rate of MA channel and the price channel , MA Line becomes lighter/darker. so when you look at the MA Line's color you can see the trend strength.
Some details about my idea:
Options:
You can choose following MA types as source: EMA, SMA , RMA, WMA , VWMA
"Period to Check Trend" is the period to create MA channel. Bigger period cause more sensitivity.
"Trend Channel Rate %" is rate of price channel . Price channel created by using highest/lowest of last 300 bars. I did this to make the script works on all time frames correctly.
"Use Linear Regression" is used to get rid of noise. it may cause 1-2 bars latency.
Trend Following Bar script:
All comments are welcome!.
Enjoy!

Trend Lines v2Hello Everyone. After working on new and better trend lines script for couple of weeks, finally I am proud to publish Trend Lines v2.
How it works?
- On each bar it finds last 10 higher and lower Pivot Points (PP).
- from first bar to 10. PP it search if a trend line is possible
- for each it starts searching from the last PP.
- it check if drawing a trend line possible or not and also it's broken or not
- if it's broken then optionally it shows broken trend lines as dotted
- if it finds a continues trend line and stop searhing more and draw trend line (I did this to make the script faster, otherwise you may get error because of it needs time more than .2sec)
- the script makes this process for each PP
optionally trend lines may be Solid or Dashed
optionally you may get rid of broken trend lines if you think it's crowded
and sometimes you may not see any trend line on the chart. this means you need to adjust the period for Pivot Points accordingly
also I made a video. if you watch this video you can see how the script works.
Important! after you add this tool to the chart you may need zoom-in and zoom-out to see all lines!
I thought a lot to make it free or not then I decided make it free and open source. you should know there is a lot of effort for this script, so if you think this is usefull please consider a donation ;)
Enjoy!

Trend Following BarWhile analysing a chart, one of the biggest problem is to see if there is trend or not. While thinking about it, I found the idea to analyse moving averages in channel and their momentum according to channel width.
How it Works?
On each bar it creates a channel by highest/lowest point of a MA. highest point is upper line and lowest point is lower line of the MA channel,
It gets highest and lowest point of last 300 bars, (say Price Channel)
If the width of MA channel is greater than certain rate of price channel then it decides there is trend
After it decided there is trend, it calculates the rate between channel and MA. Bigger result means stronger trend.
According to rate of MA channel and the price channel, bar color becomes lighter/darker. so when you look at the bar color you can see the trend strength.
Some details about my idea:
Options:
You can choose following MA types as source: EMA, SMA, RMA, WMA, VWMA
"Period to Check Trend" is the period to create MA channel. Bigger period cause more sensitivity.
"Trend Channel Rate %" is rate of price channel. Price channel created by using highest/lowest of last 300 bars. I did this to make the script works on all time frames correctly.
"Use Linear Regression" is used to get rid of noise. it may cause 1-2 bars latency.
All comments are welcome!.
Enjoy!

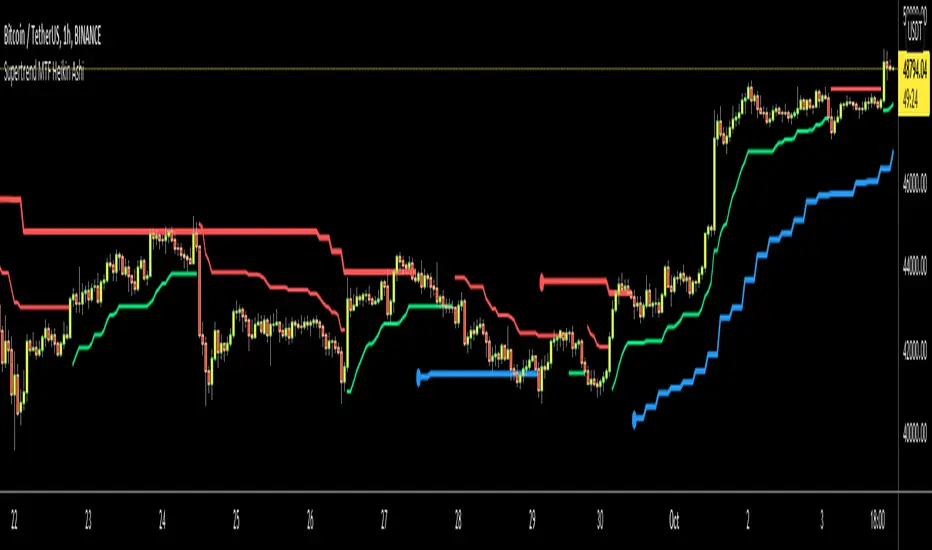
Supertrend MTF Heikin AshiThis is non-repaiting Supertrend Multi Time Frame script, uses Heikin Ashi Candles as source on normal chart
There is an option for Higher Time Frame. if you choose "Auto" then Higher Time Frame calculation is made by the script. If you choose "User Defined" option and then you can select Time Frame.
You better use this script with other indicators such as RSI, Momentum etc.
Enjoy!
Support Resistance - DynamicThis is Dynamic Support / Resistance script.
How it Works?
It finds Pivot Points and creates channels for each Pivot Point. Channel size is calculated by (Highest - Lowest) * %Channel_size in Loopback Period. After creating channels it calculates that how many Pivot Points in the channels. more Pivot Points in channel means stronger Support/Resistance. in the option menu there is S/R Strength, this is the minimum number of Pivot Points that each channel must contain to be S/R. calculation starts from last pivot point and go back for "loopback period" which is 300 by default. so last Pivot Points have more priority. Finally after calculating Support/Resistance it draws lines.
Number of Support/Resistance line is Dynamic and up to 20 lines, that means number of lines changes dynamically. you can see how the script puts Suppport/Resistance lines dynamically by "Replay" button. (if I have time I will try to put a video)
Currently the scripts checks up to 40 pivot points in loopback period. it shows up to 20 S/Rs only for visible area in the chart.
There is option to Show S/R lines as Solid, Dotted or Dashed.
Enjoy!

RSI ChannelHello All. For a while this idea (showing RSI levels on the chart as a channel) was in my mind and finally today I developed the script. I hope it will be usefull for all.
Enjoy!

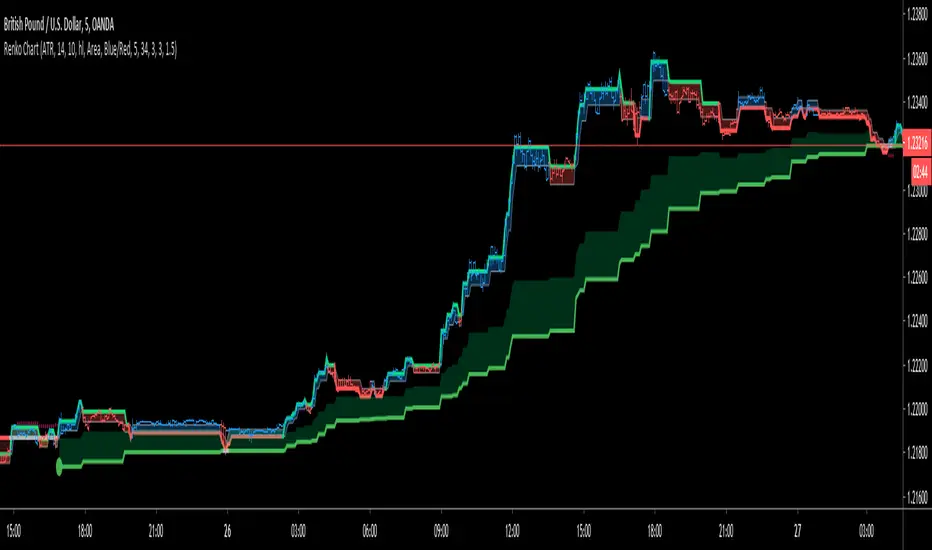
Renko ChartHello All. This is live and non-repainting Renko Charting tool. The tool has it’s own engine and not using integrated function of Trading View.
Renko charts ignore time and focus solely on price changes that meet a minimum requirement. Time is not a factor on Renko chart but as you can see with this script Renko chart created on time chart.
Renko chart provide several advantages, some of them are filtering insignificant price movements and noise, focusing on important price movements and making support/resistance levels much easier to identify.
in the script Renko Trend Line with threshold area is included. and also there is protection from whipsaws, so you can catch big waves with very good entry points. Trend line is calculated by EMA of Renko closing price.
As source Closing price or High/Low can be used. Traditional or ATR can be used for scaling. If ATR is chosen then there is rounding algorithm according to mintick value of the security. For example if mintick value is 0.001 and brick size (ATR/Percentage) is 0.00124 then box size becomes 0.001. And also while using dynamic brick size (ATR), box size changes only when Renko closing price changed.
Renko bar can be seen as area or candle and also optionally bar color changes when Renko trend changed.
Soon other Renko scripts (Renko RSI, Renko Weis Wave, Renko MACD etc) are coming ;)
ENJOY!
Point and Figure (PnF) Weis Wave VolumeThis is live and non-repainting Point and Figure Chart Weis Wave Volume tool. The script has it’s own P&F engine and not using integrated function of Trading View.
Point and Figure method is over 150 years old. It consist of columns that represent filtered price movements. Time is not a factor on P&F chart but as you can see with this script P&F chart created on time chart.
P&F chart provide several advantages, some of them are filtering insignificant price movements and noise, focusing on important price movements and making support/resistance levels much easier to identify.
This tool is based on the Weis Wave described by David H. Weis (a Wyckoff specialist). The Weis Waves Indicator sums up volumes in each wave. This is how we receive a bar chart of cumulative volumes of alternating waves and The cumulative volume makes the Weis wave charts unique.
If there is no volume information for the security then this tool has an option to use “True Range” instead of volume .
If you are new to Point & Figure Chart then you better get some information about it before using this tool. There are very good web sites and books. Please PM me if you need help about resources.
Options in the Script
Box size is one of the most important part of Point and Figure Charting. Chart price movement sensitivity is determined by the Point and Figure scale. Large box sizes see little movement across a specific price region, small box sizes see greater price movement on P&F chart. There are four different box scaling with this tool: Traditional, Percentage, Dynamic (ATR), or User-Defined
4 different methods for Box size can be used in this tool.
User Defined: The box size is set by user. A larger box size will result in more filtered price movements and fewer reversals. A smaller box size will result in less filtered price movements and more reversals.
ATR: Box size is dynamically calculated by using ATR, default period is 20.
Percentage: uses box sizes that are a fixed percentage of the stock's price. If percentage is 1 and stock’s price is $100 then box size will be $1
Traditional: uses a predefined table of price ranges to determine what the box size should be.
Price Range Box Size
Under 0.25 0.0625
0.25 to 1.00 0.125
1.00 to 5.00 0.25
5.00 to 20.00 0.50
20.00 to 100 1.0
100 to 200 2.0
200 to 500 4.0
500 to 1000 5.0
1000 to 25000 50.0
25000 and up 500.0
Default value is “ATR”, you may use one of these scaling method that suits your trading strategy.
If ATR or Percentage is chosen then there is rounding algorithm according to mintick value of the security. For example if mintick value is 0.001 and box size (ATR/Percentage) is 0.00124 then box size becomes 0.001.
And also while using dynamic box size (ATR or Percentage), box size changes only when closing price changed.
Reversal : It is the number of boxes required to change from a column of Xs to a column of Os or from a column of Os to a column of Xs. Default value is 3 (most used). For example if you choose reversal = 2 then you get the chart similar to Renko chart.
Source: Closing price or High-Low prices can be chosen as data source for P&F charting.
There is only one option for Weis Wave Volume, “Use True Range (if no Volume info)” if you select this option and volume info is not avaliable then it uses “true range”, but if volume info is available, it never use true range. Default value is set to use true range.

Point and Figure (PnF) Moving Averages HistogramThis is live and non-repainting Point and Figure Chart Moving Average Histogram tool. The script has it’s own P&F engine and not using integrated function of Trading View.
Point and Figure method is over 150 years old. It consist of columns that represent filtered price movements. Time is not a factor on P&F chart but as you can see with this script P&F chart created on time chart.
P&F chart provide several advantages, some of them are filtering insignificant price movements and noise, focusing on important price movements and making support/resistance levels much easier to identify.
Moving averages on Point & Figure charts are based on the average price of each column while bar chart moving averages are based closing price. Average Price means (ClosePrice + OpenPrice) / 2.
Because of there is double smoothing, you should use shorter lengths for moving averages. Double smoothing means: using average price smooths once, using length greater than 2 smooths price second time.
If you are new to Point & Figure Chart then you better get some information about it before using this tool. There are very good web sites and books. Please PM me if you need help about resources.
Options in the Script
Box size is one of the most important part of Point and Figure Charting. Chart price movement sensitivity is determined by the Point and Figure scale. Large box sizes see little movement across a specific price region, small box sizes see greater price movement on P&F chart. There are four different box scaling with this tool: Traditional, Percentage, Dynamic (ATR), or User-Defined
4 different methods for Box size can be used in this tool.
User Defined: The box size is set by user. A larger box size will result in more filtered price movements and fewer reversals. A smaller box size will result in less filtered price movements and more reversals.
ATR: Box size is dynamically calculated by using ATR, default period is 20.
Percentage: uses box sizes that are a fixed percentage of the stock's price. If percentage is 1 and stock’s price is $100 then box size will be $1
Traditional: uses a predefined table of price ranges to determine what the box size should be.
Price Range Box Size
Under 0.25 0.0625
0.25 to 1.00 0.125
1.00 to 5.00 0.25
5.00 to 20.00 0.50
20.00 to 100 1.0
100 to 200 2.0
200 to 500 4.0
500 to 1000 5.0
1000 to 25000 50.0
25000 and up 500.0
Default value is “ATR”, you may use one of these scaling method that suits your trading strategy.
If ATR or Percentage is chosen then there is rounding algorithm according to mintick value of the security. For example if mintick value is 0.001 and box size (ATR/Percentage) is 0.00124 then box size becomes 0.001.
And also while using dynamic box size (ATR or Percentage), box size changes only when closing price changed.
Reversal : It is the number of boxes required to change from a column of Xs to a column of Os or from a column of Os to a column of Xs. Default value is 3 (most used). For example if you choose reversal = 2 then you get the chart similar to Renko chart.
Source: Closing price or High-Low prices can be chosen as data source for P&F charting.
Options for P&F Bollinger Bands:
MA Type: MA type can be EMA or SMA
MA Source: Moving averages on P&F charts are based on the average price of each column. Bar chart moving averages are based on each close price. Average price means “(ClosePrice + OpenPrice) / 2”. You can choose Close Price or Average Price as source. Default is Average Price.
Fast MA Length : Length of Fast Moving average, shorter length than Slow MA
Slow MA Length : Length of Slow Moving average, greater length than Slow MA
There are alerts when Fast MA Crossed over/under Slow MA conditions. While adding alert “Once Per Bar Close” option should be chosen.

Point and Figure (PnF) Bollinger BandsThis is live and non-repainting Point and Figure Chart Bollinger Bands tool. The script has it’s own P&F engine and not using integrated function of Trading View.
Point and Figure method is over 150 years old. It consist of columns that represent filtered price movements. Time is not a factor on P&F chart but as you can see with this script P&F chart created on time chart.
P&F chart provide several advantages, some of them are filtering insignificant price movements and noise, focusing on important price movements and making support/resistance levels much easier to identify.
P&F Bollinger Bands is calculated and shown by using its own P&F engine. Because of Point and Figure Chart Moving averages are already smoothed, better to use smaller moving average periods, 5 or 10 etc. This period can be chosen by prives movements and characteristics. You can see the consolidation areas and with P&F Breakout signals it’s possible to see the direction. Narrowing bands indicate a consolidation and narrowing does not provide a direction clue. You must look for the next P&F signal to establish direction. But beware of the ‘head fake’. This occurs when prices break a band, then suddenly reverse and move the other way (Trap).
An example for Head Fake:
If you are new to Point & Figure Chart then you better get some information about it before using this tool. There are very good web sites and books. Please PM me if you need help about resources.
Options in the Script
Box size is one of the most important part of Point and Figure Charting. Chart price movement sensitivity is determined by the Point and Figure scale. Large box sizes see little movement across a specific price region, small box sizes see greater price movement on P&F chart. There are four different box scaling with this tool: Traditional, Percentage, Dynamic (ATR), or User-Defined
4 different methods for Box size can be used in this tool.
User Defined: The box size is set by user. A larger box size will result in more filtered price movements and fewer reversals. A smaller box size will result in less filtered price movements and more reversals.
ATR: Box size is dynamically calculated by using ATR, default period is 20.
Percentage: uses box sizes that are a fixed percentage of the stock's price. If percentage is 1 and stock’s price is $100 then box size will be $1
Traditional: uses a predefined table of price ranges to determine what the box size should be.
Price Range Box Size
Under 0.25 0.0625
0.25 to 1.00 0.125
1.00 to 5.00 0.25
5.00 to 20.00 0.50
20.00 to 100 1.0
100 to 200 2.0
200 to 500 4.0
500 to 1000 5.0
1000 to 25000 50.0
25000 and up 500.0
Default value is “ATR”, you may use one of these scaling method that suits your trading strategy.
If ATR or Percentage is chosen then there is rounding algorithm according to mintick value of the security. For example if mintick value is 0.001 and box size (ATR/Percentage) is 0.00124 then box size becomes 0.001.
And also while using dynamic box size (ATR or Percentage), box size changes only when closing price changed.
Reversal : It is the number of boxes required to change from a column of Xs to a column of Os or from a column of Os to a column of Xs. Default value is 3 (most used). For example if you choose reversal = 2 then you get the chart similar to Renko chart.
Source: Closing price or High-Low prices can be chosen as data source for P&F charting.
Options P&F Bollimger Bands:
Length: Base Moving Average Length, default value is 5
StdDev: Standart Deviation, default value ise 2. (Standart deviation is calculated by the engine)
MA Source: Moving averages on P&F charts are based on the average price of each column. Bar chart moving averages are based on each close price. Average price means “(ClosePrice + OpenPrice) / 2”. You can choose Close Price or Average Price as source. Default is Average Price.

Point and Figure (PnF) RSIThis is live and non-repainting Point and Figure Chart RSI tool. The script has it’s own P&F engine and not using integrated function of Trading View.
Point and Figure method is over 150 years old. It consist of columns that represent filtered price movements. Time is not a factor on P&F chart but as you can see with this script P&F chart created on time chart.
P&F chart provide several advantages, some of them are filtering insignificant price movements and noise, focusing on important price movements and making support/resistance levels much easier to identify.
P&F RSI is calculated and shown by using its own P&F engine.
If you are new to Point & Figure Chart then you better get some information about it before using this tool. There are very good web sites and books. Please PM me if you need help about resources.
Options in the Script
Box size is one of the most important part of Point and Figure Charting. Chart price movement sensitivity is determined by the Point and Figure scale. Large box sizes see little movement across a specific price region, small box sizes see greater price movement on P&F chart. There are four different box scaling with this tool: Traditional, Percentage, Dynamic (ATR), or User-Defined
4 different methods for Box size can be used in this tool.
User Defined: The box size is set by user. A larger box size will result in more filtered price movements and fewer reversals. A smaller box size will result in less filtered price movements and more reversals.
ATR: Box size is dynamically calculated by using ATR, default period is 20.
Percentage: uses box sizes that are a fixed percentage of the stock's price. If percentage is 1 and stock’s price is $100 then box size will be $1
Traditional: uses a predefined table of price ranges to determine what the box size should be.
Price Range Box Size
Under 0.25 0.0625
0.25 to 1.00 0.125
1.00 to 5.00 0.25
5.00 to 20.00 0.50
20.00 to 100 1.0
100 to 200 2.0
200 to 500 4.0
500 to 1000 5.0
1000 to 25000 50.0
25000 and up 500.0
Default value is “ATR”, you may use one of these scaling method that suits your trading strategy.
If ATR or Percentage is chosen then there is rounding algorithm according to mintick value of the security. For example if mintick value is 0.001 and box size (ATR/Percentage) is 0.00124 then box size becomes 0.001.
And also while using dynamic box size (ATR or Percentage), box size changes only when closing price changed.
Reversal : It is the number of boxes required to change from a column of Xs to a column of Os or from a column of Os to a column of Xs. Default value is 3 (most used). For example if you choose reversal = 2 then you get the chart similar to Renko chart.
Source: Closing price or High-Low prices can be chosen as data source for P&F charting.
you can use PNF type RSI or RENKO type RSI.
What is the difference between them?
While calculating PNF type RSI, the script checks last X/O column's closing price but when using RENKO type RSI the scipt calculates RSI on every price changes according to number of boxes. and also with RENKO type RSI, calculation is made for each boxes on price changes.
Important note if you use this PNF script with reversal = 2 then you get RENKO chart. So, with this RENKO chart better to use RENKO type RSI ;)
