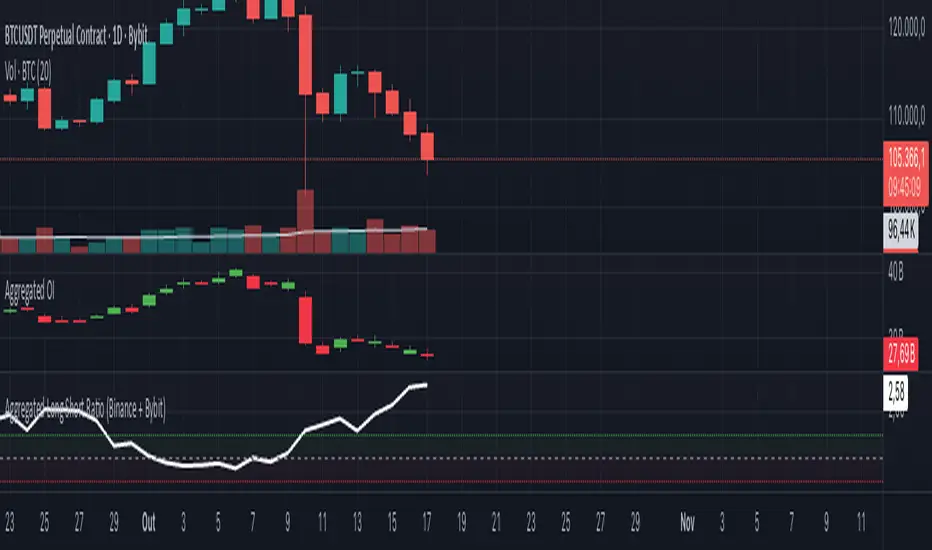
Aggregated Long Short Ratio (Binance + Bybit)This indicator displays the Long/Short Ratio (LSR) from Binance and Bybit exchanges, plus an aggregated average. LSR shows the ratio between traders holding long positions vs short positions.
Settings AvailableExchanges Group:
☑️Show Binance - Display Binance LSR line
☑️ Show Bybit - Display Bybit LSR line
☑️ Show Aggregated LSR - Display combined average
Timeframe - Choose data timeframe (leave empty for chart timeframe)
Visualization Group:
🎨 Binance Color - Default: Yellow
🎨 Bybit Color - Default: Orange
🎨 Aggregated Color - Default: White
📖 How to Read the Indicator
⚠️ CRITICAL: Always analyze LSR together with Open Interest (OI)
Key Levels:
LSR = 1.0 (gray dashed line) = Balance - Equal longs and shorts
LSR > 1.0 = More longs than shorts (bullish sentiment)
LSR < 1.0 = More shorts than longs (bearish sentiment)
Extreme Zones:
LSR > 1.5 (green zone) = Very bullish - Possible market top
LSR < 0.5 (red zone) = Very bearish - Possible market bottom
Why Open Interest Matters:
LSR alone doesn't tell the full story. You MUST check Open Interest:
Rising OI + High LSR (>1.5) = New longs opening → Strong momentum OR potential trap
Rising OI + Low LSR (<0.5) = New shorts opening → Strong momentum OR potential trap
Falling OI + Extreme LSR = Positions closing → Weak signal, avoid trading
Stable OI + Extreme LSR = No new positions → Less reliable signal
💡 Trading Interpretation
⚠️ ALWAYS combine LSR with Open Interest analysis!
Contrarian Strategy (High Leverage Zones):
High LSR (>1.5) + Rising OI → Many new longs → Potential short squeeze OR reversal down
Low LSR (<0.5) + Rising OI → Many new shorts → Potential long squeeze OR reversal up
Trend Confirmation:
Rising LSR + Rising price + Rising OI = Strong bullish trend with new positions
Falling LSR + Falling price + Rising OI = Strong bearish trend with new positions
Weak Signals (Avoid):
Extreme LSR + Falling OI = Positions closing → Low conviction
Extreme LSR + Stable OI = No new money → Wait for confirmation
Divergences:
Price higher highs but LSR falling + Rising OI = Bearish divergence (shorts accumulating)
Price lower lows but LSR rising + Rising OI = Bullish divergence (longs accumulating)
Best Setups:
Reversal: Extreme LSR (>1.5 or <0.5) + Rising OI + Price rejection
Trend: LSR trending with price + Steadily rising OI
Caution: Extreme LSR + Falling OI = Ignore signal
Built-in Alerts
The indicator includes 4 preset alerts:
LSR Crossed Above 1.0 - Market turned bullish
LSR Crossed Below 1.0 - Market turned bearish
LSR Very High - Above 1.5 (possible top)
LSR Very Low - Below 0.5 (possible bottom)
To Set Up Alerts:
Click the "..." on the indicator
Select "Add Alert"
Choose the condition you want
Configure notification method
Best Practices
MANDATORY: Always add Open Interest indicator to your chart alongside LSR
To add OI: Click Indicators → Search "Open Interest" → Add official TradingView OI
Use on perpetual futures charts (symbols ending in .P)
Works best on USDT pairs (BTCUSDT, ETHUSDT, etc.)
Combine LSR + OI + price action + support/resistance levels
Higher timeframes (4h, 1D) give more reliable signals
Don't trade LSR extremes without confirming OI direction
Golden Rule: Rising OI = Strong signal | Falling OI = Weak signal
⚠️ Important Notes
Indicator requires TradingView Premium or above (uses Request library)
Only works on crypto perpetual futures
Data availability depends on exchange API
NA values mean data is not available for that exchange/symbol
Never use LSR without Open Interest context
LONGSHORTRATIO
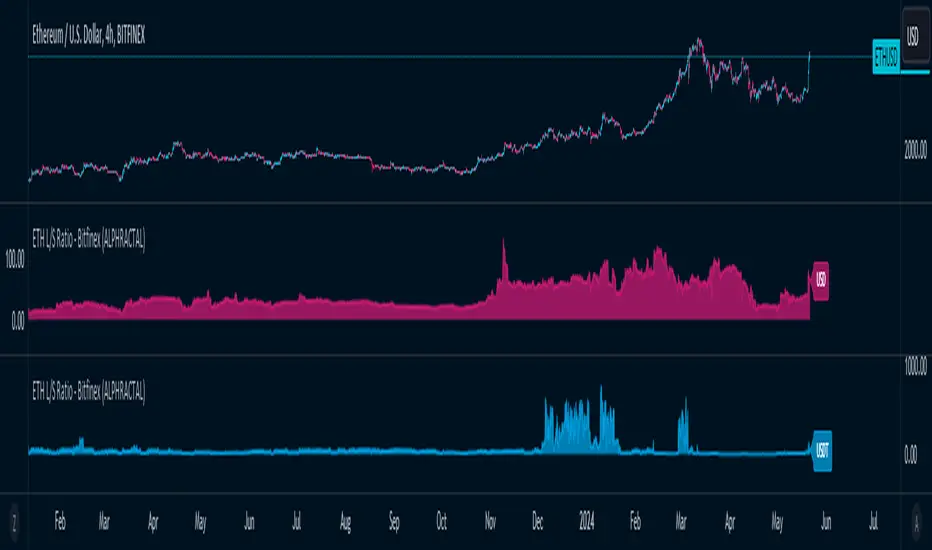
ETH Long/Short Ratio BITFINEX - (ALPHRACTAL)Indicator Description: ETH Long/Short Ratio BITFINEX - (ALPHRACTAL)
The ETH Long/Short Ratio BITFINEX - (ALPHRACTAL) indicator provides a detailed analysis of Ethereum (ETH) long and short positions in USD and USDT on the Bitfinex exchange. This indicator is ideal for traders who want to monitor market behavior and better understand the relationship between long and short positions.
Features:
USD and USDT Long/Short Ratio:
Calculates and displays the ratio between long and short ETH positions in USD and USDT.
Helps identify market trends and the relative strength between buyers and sellers.
Color Configuration:
Allows customization of chart colors for clear and distinct visualization of USD and USDT ratios.
Uses colors with adjustable transparency to enhance chart visibility.
Label Display:
Option to show or hide labels indicating the type of ratio (USD or USDT) at the latest chart value.
Labels are useful for quickly identifying the visualized ratio.
Display Control:
Option to enable or disable the display of individual USD and USDT ratio charts.
Flexibility to view only the relevant data for your analysis.
How to Use:
Add the indicator to your chart to visualize the long/short ratios of ETH in USD and USDT.
Adjust colors and transparency as per your preference for better visual distinction.
Use the option to show or hide labels for quick identification of the data.
Analyze the relationship between long and short positions to make informed trading decisions, observing market buying and selling trends.
Example Use Cases:
Market Sentiment Analysis: An increase in the Long/Short ratio may indicate bullish sentiment among traders, while a decrease may indicate bearish sentiment.
Identifying Opportunities: Significant discrepancies between USD and USDT ratios may signal arbitrage opportunities or alert to significant market movements.
This indicator is a powerful tool for Ethereum traders who want a deeper understanding of market behavior and the dynamics of long and short positions on Bitfinex. Add the ETH Long/Short Ratio BITFINEX - (ALPHRACTAL) to your technical analysis toolkit and gain an edge in your trading strategy.
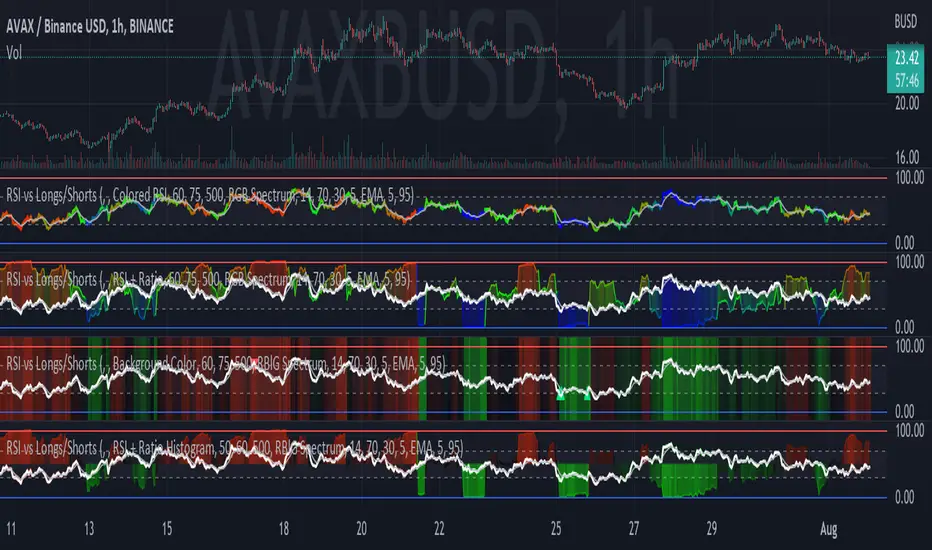
RSI vs Longs/Shorts Margin Ratio Percentage RankThis indicator plots the RSI of the current token and the percentage rank, of the RSI, of the ratio of a long margined token to a short margined token.
By default it plots the RSI of the current token with a color based on percentage rank the RSI of BITFINEX:BTCUSDLONGS divided by BITFINEX:BTCUSDSHORTS, so the assumption is that you are using it on a BTC chart. While you can select any Tradingview symbol for your Long and Short tokens I don't think you will get meaningful results unless you select a long and short margined token that matches your chart symbol, such as BITFINEX:ETHUSDLONGS and BITFINEX:ETHUSDSHORTS if you're trading ETHUSD. Even using margined tokens the results may not be meaningful, if there is not enough trade volume in the token, or if they are being manipulated, so you must backtest everything.
The three plot options are:
• Colored RSI - RSI plotted with colors based on the Longs/Shorts ratio
• Background Color - White RSI plot with Longs/Shorts ratio as background color
• RSI + Ratio - White RSI with Longs/Shorts ratio plotted in color
The chart shows all three options on an hourly BITFINEX:SOLUSD chart with BITFINEX:SOLUSDSHORTS and BITFINEX:SOLUSDLONGS.
By default it also plots a short term moving average and it can also plot the raw ratio rather than the percentage rank if selected.
This script started out as "RSI vs BITFINEX BTC Longs/Shorts Margin Ratio Percentage Rank" by me. I was interested in the ratio of BITFINEX:BTCUSDLONGS to BITFINEX:BTCUSDSHORTS as a measure of market sentiment and how that sentiment would magnify RSI changes. The volatility of the BTCUSDLONGS : BTCUSDSHORTS ratio was too low to get a good read, using a percent rank of the RSI of the ratio made the results more visible. After a discussion with @jason5480 I saw how opening it up to all margined Long / Short pairs was the best way forward. Unfortunately the name no longer matched the script, so I had to publish a new script.
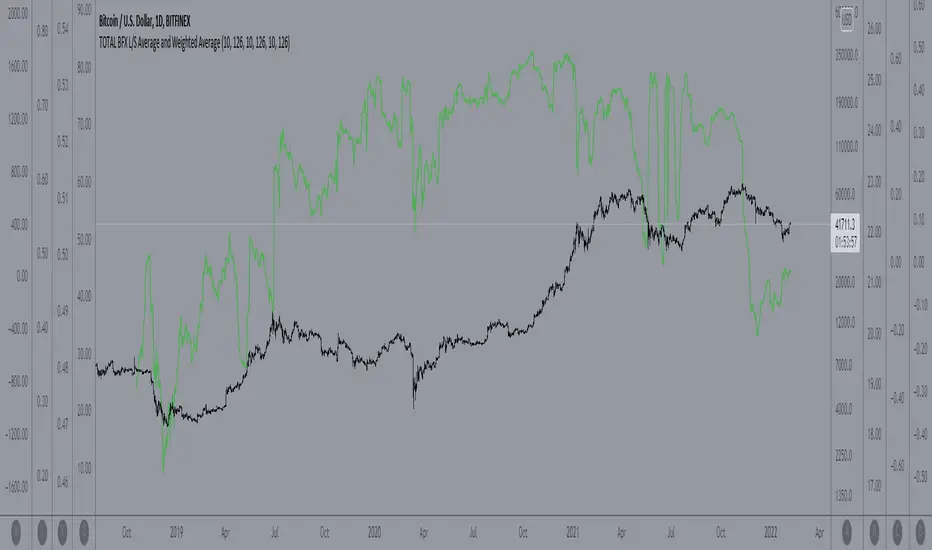
Bitfinex Total Longs/Shorts All Coins Aggregate [bigurb]I took all the coins and all the coin pairings on Bitfinex to make two separate Total L/S ratios. One just takes the L/S for all coins and averages them evenly.
The second, and I think superior method is where I take the total longs for each coin and mulitiply by the coin price, doing the same for the shorts. This gives a L/S ratio that is properly weighted for the value of longs/shorts.
speed_long_short[WOZDUX]Indicator of the position growth rate in long and short. Schedule of positions long and short is taken from the stock exchange Bitfinex. The total number of long and short positions shows the total activity of traders and indirectly the total volume of transactions. On the chart of the indicator it is a blue line.
Since we do not study the absolute values of volumes, but the growth rate of volumes, the blue line shows the overall growth rate of all transactions. The red line shows the rate of growth of transactions in the short. The green line shows the rate of growth of transactions in the long.
The rate of growth of the absolute value of long positions is the green line. The rate of increase in the percentage of positions in the long light green.Thus, the relative growth of long positions (light green line) actually shows the Delta of the volume, since this is the ratio of the number of long positions to the total number of transactions .
By default, the pair btc usd is used. However, you can change this pair in the indicator settings.
============================
Индикатор скорости прироста позиций в лонг и шорт. График позиций лонг и шорт берется с биржи Bitfinex. Суммарное количество позиций лонг и шорт показывает общую активность трейдеров и косвенно общий объем сделок. На графике индикатора это синяя линия.
Поскольку мы исследуем не абсолютные значения объемов, а скорость прироста объемов, то синяя линия показывает общую скорость прироста всех сделок. Красная линия показывает скорость прироста сделок в шорт. Зеленая линия показывает скорость прироста сделок в лонг.
Скорость прироста абсолютного значения лонг позиций - зеленая линия. Скорость прироста процентной доли позиций в лонг светлозеленая.Таким образом, относительный прирост позиций лонг ( светлозеленая линия) фактически показывает дельту объема, поскольку это отношение количества позиций лонг к общему количеству сделок .
По умолчанию, используется пара btcusd. Однако в настройках индикатора можно изменить эту пару.

Bitfinex Longs/Shorts Multi-Coin [acatwithcharts]This script plots the longs/shorts ratio derived from Bitfinex for BTCUSDLONGS, BTCUSDSHORTS, and similar for 11 top cryptocurrencies chosen selected based on marketcap, trading volume on Bitfinex, and the maximum number of times that TradingView would let me call the "security" function in one script. Included coins:
BTC, ETH, LTC, BCH, XRP, EOS, IOT (IOTA), ETC, ZEC, NEO, XMR
In addition to just plotting the ratios for the individual coins, this script also calculates for a customizable selection of the 11 coins both the average ratio and a weighted average weighted by (USD price of coin * sum of long and short positions).
I wrote it both to use both for a big picture overview of leveraged positions across major coins and to use as a Swiss army knife of longs/shorts ratio indicators for individual coins, most of which do not currently have individual scripts published.
I'm an amateur and you definitely shouldn't take anything I say or use any of my scripts as financial advice. I'd appreciate any feedback.

Universal Longs Vs. Shorts - Ratio (Any Symbol)Hello again all my Trading View friends!
This script is a variation of my other script "Universal Longs Vs. Shorts - Percentage (Any Symbol)"
It allows you to choose ANY symbol and plot the ratio against ANY other symbol, as an indicator on your given pair. It is primarily used as an indicator of longs/shorts as well as shorts/longs as a ratio to each other.
For example, you could plot BITFINEX:BTCUSDLONGS against BITFINEX:BTCUSDSHORTS.
It plots the ratio of longs/shorts or shorts/longs. For example:
If there are more longs than shorts open, the long ratio will be great than 1 with no upper limit.
If there are less longs than shorts open, the ratio will be less than 1 but greater than 0.
The same is true when comparing shorts to longs. You can choose to view Longs Ratio only, Shorts Ratio only, or Both.
This is useful to see how many more longs there are than shorts, and visa versa, at any given time interval. It does not take into consideration total volume of longs + shorts to get an absolute number, but rather a relative ratio to each other.
If there are many more positions open in one direction over the other, the ratio will rise higher and higher away from 1, which lets you know generally that there is a lot greater volume of that position open compared to its reverse.
If you found this script helpful please remember to FOLLOW and press LIKE!!
More useful scripts to come :-D

Universal Longs Vs. Shorts - Percentage (Any Symbol)Hello all my Trading View friends!!
This script allows you to choose ANY symbol and plot the ratio against ANY other symbol, as an indicator on your given pair. It is primarily used as an indicator of longs/shorts as well as shorts/longs as a percentage of total longs + shorts.
For example, you could plot BITFINEX:BTCUSDLONGS against BITFINEX:BTCUSDSHORTS.
It takes the ratio from an absolute 100%, rather than relative to each other. Therefore, each plot has a minimum of 0% and a maximum of 100%. You can choose to view Longs Percentage only, Shorts Percentage only, or Both.
This is useful to see what percentage of total positions are either long or short at any given time interval.
If you found this script helpful please remember to FOLLOW and press LIKE!!
