Johnny's Adjusted BB Buy/Sell Signal"Johnny's Adjusted BB Buy/Sell Signal" leverages Bollinger Bands and moving averages to provide dynamic buy and sell signals based on market conditions. This indicator is particularly useful for traders looking to identify strategic entry and exit points based on volatility and trend analysis.
How It Works
Bollinger Bands Setup: The indicator calculates Bollinger Bands using a specified length and multiplier. These bands serve to identify potential overbought (upper band) or oversold (lower band) conditions.
Moving Averages: Two moving averages are calculated — a trend moving average (trendMA) and a long-term moving average (longTermMA) — to gauge the market's direction over different time frames.
Market Phase Determination: The script classifies the market into bullish or bearish phases based on the relationship of the closing price to the long-term moving average.
Strong Buy and Sell Signals: Enhanced signals are generated based on how significantly the price deviates from the Bollinger Bands, coupled with the average candle size over a specified lookback period. The signals are adjusted based on whether the market is bullish or bearish:
In bullish markets, a strong buy signal is triggered if the price significantly drops below the lower Bollinger Band. Conversely, a strong sell signal is activated when the price rises well above the upper band.
In bearish markets, these signals are modified to be more conservative, adjusting the thresholds for triggering strong buy and sell signals.
Features:
Flexibility: Users can adjust the length of the Bollinger Bands and moving averages, as well as the multipliers and factors that determine the strength of buy and sell signals, making it highly customizable to different trading styles and market conditions.
Visual Aids: The script vividly plots the Bollinger Bands and moving averages, and signals are visually represented on the chart, allowing traders to quickly assess trading opportunities:
Regular buy and sell signals are indicated by simple shapes below or above price bars.
Strong buy and sell signals are highlighted with distinctive colors and placed prominently to catch the trader's attention.
Background Coloring: The background color changes based on the market phase, providing an immediate visual cue of the market's overall sentiment.
Usage:
This indicator is ideal for traders who rely on technical analysis to guide their trading decisions. By integrating both Bollinger Bands and moving averages, it provides a multi-faceted view of market trends and volatility, making it suitable for identifying potential reversals and continuation patterns. Traders can use this tool to enhance their understanding of market dynamics and refine their trading strategies accordingly.
Longtermtrading

Swing Algo V1.4◆ Introduction
The latest version of the Swing Algo features a complementary system consisting of two internal swing trading logics: an enhanced Swing Algo V1.3 and a secondary control engine to stabilize the overall strategy behaviour in times of increased market chop. Both algorithms feature different averaging lines as well as oscillators, leading to a higher strategy diversification for swing trading as well as a reduced maximum drawdown in comparison to each stand-alone strategy.
While the Swing Algo V1.x series so far featured a single trend-following swing algorithm for each release, where one just switches between Long and Short trades based on one general logic, here two strategies, which act independently of each other, are applied. Due to this, we introduce a third position a trader can be in: the Hedge. The overall logic is as follows:
When both sub-logics are Long, the overall strategy is Long.
When both sub-logics are Short, the overall strategy is Short.
When one sub-logic is Long and the other is Short, the overall strategy is in a Hedge position. It doesn't matter which component is Short and which is Long.
As PineScript doesn't currently offer a real steady hedging-function for two competing swing trading sub-logics (in the sense of a continuously applied Hedge state after hedging conditions are met at least once for an entry), a workaround via position closes was created for this release. For each new internal sub-signal, the overall strategy changes its state (Long/Short/Hedge) visibly on the chart, and the trader can adjust their position accordingly.
For detailed differences to previous Swing Algo V1.x releases, see further below.
◆ Purpose of this Script
This indicator will give Long, Short and Hedge signals on the chart that can be used for e.g. swing trading. Each of the aforementioned sub-logics uses a combination of several (custom) functions and rules to find good entry points for trend trading. After many iterations and tests I came up with this particular setup, which is highly optimized for the ETH/USD trading pair on the daily (D) timeframe.
Attention was also paid to stability, as all parameters are set onto plateaus, so that smaller changes in the characteristic price action should not affect the efficiancy too much, done as an attempt to reduce overfitting as much as possible. Additionally this dual algorithm system is specifically designed to have a safety net: should for the unlikely scenario one swing trading algorithm not trigger at a certain mid-term reversal point, the probability is high that the other will trigger, resulting in an overall hedged position (so that no money is lost in the meantime) until the first algorithm can rejoin at the next mid-term trend change.
For other assets and/or timeframes it is in principle possible to change algorithmic parameters within the indicator settings to tune the swing algorithms, though it is strongly recommended to use the standard asset and timeframe mentioned above.
◆ Viability
For the here presented backtest data, we omitted the biggest portion of the cryptocurrency bullrun in 2017 (starting only at 1st July 2017) so that the results become more realistic for long-term swing traders (investing at least 2-4 years into trading) if such large runs do not happen again. As cryptocurrencies like Ethereum are still to this date capable of doing comparatively smaller runs of about 2-3x in a few weeks/months during accumulation phases (as witnessed e.g. in 2020 and more recently in 2023) and bigger runs during bullmarkets (as witnessed in 2021), the quality of the shown results is still realistic for long-term trend trading efforts over several years, Note that very conservative trading parameters as mentioned below in "Forwardtesting and Backtesting" are used here.
Generally do not expect results in a matter of days or weeks, and of course as with any trading strategy past performances are not indicative of future results.
◆ Forwardtesting and Backtesting
The individual components have been back- and partially forwardtested: The first sub-logic is an advancement of Swing Algo V1.3, with which we have extensive experience running back to October 2020 for its release, while the secondary control strategy, which was privately published for DeanTrader members as a stand-alone script on TradingView in June 2022 and was running in the background since then, is showing good & expected behaviour so far.
While this does not mean that fowardtesting was performed specifically for the combined Swing Algo V1.4 system we have now (which cannot be done realistically considering the timeframes used, i.e. months and especially years), we can at least look at some considerable experience with the individual components. Then again, as I have implemented an exact hedging-function so that both sub-algorithms run independently from each other, it is not likely to see any unexpected behaviour resulting purely from the combination into one script.
For strategy backtesting you can choose the backtest time interval to test the performance of this algorithm for different time windows and different trading pairs. Here various backtesting parameters (e.g. trading fees) can be customized. Default settings for the shown backtest are a starting balance of $1000, a slippage of 20 ticks (= $0.20) and a trading fee of 0.05 % (which is the worst taker fee on the Kraken Pro futures exchange) to have realistic settings. However as we do not conduct many trades with this strategy, fees should not impact our performance too much. As long-term swing traders, we at DeanTrader generally devote one initial portion of our portfolio to swing trading and from then on always use 100% of this portion for the next trade to get the compounding starting. This is in difference to other trading styles which use various, often very small, percentage values for their short- or mid-term trades. Please note that for the here presented backtest only 10% of compounded equity is used for each successive trade to show an estimation for a lower risk & lower reward approach . Keep this in mind when evaluating the backtest data. You can set appropriate values for each backtest parameter in the "Properties" setting menu of the strategy, including the order size percentage of equity value for your trades. Also note that due to the small number of trades the statistical significance is low. It is not possible to gather an abundance of long-term trend signals in the order of hundreds or thousands trades, as much more time would have to pass for this in the case of rather new assets like Ethereum.
Additionally to the TradingView Strategy Tester you can also plot your equity directly on the chart to get a sense for the performance. For this you can also scale the equity graph to e.g. match the starting point of your equity with some price point on the chart to get a direct comparison to 'Buy & Hold' strategies over time.
This indicator (and all other content I provide) is no financial advice. If you use this indicator you agree to my Terms and Conditions which can be found on my website linked on my TradingView profile or in my signature.
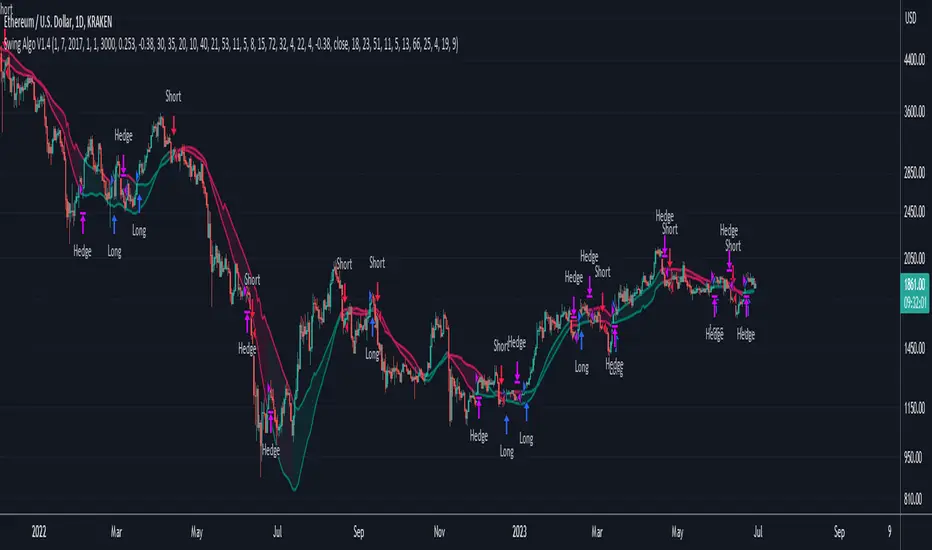
◆ Visual Representation on the Chart
Shown below is a screenshot of how the chart looks like when the strategy is applied. Here we can see two different averaging lines, where each line belongs to one of the two sub-logics respectively. Note that this is not a MA-crossover strategy, and the crossing of the lines is not accounted for in the code at all and therefore has no effect on the strategy's signal output. Also note that the price scale is set on logarithmic.
The space between the lines is filled with a faint background color as a rough visual indicator. Magenta-colored fills indicate zones where only Short or Hedge signals can appear, while green-colored fills indicate zones where only Long or Hedge signals can appear. Gray-colored fills mark zones where only Hedge signals can appear, which also means that Hedge signals can appear in any zone. So treat those background fills more as a visual aid to roughly know what can happen next, but pay most attention to the actual signals (with arrows) that appear on the chart.
◆ Differences to Other Versions
Consists now of two competing sub-algorithms instead of just one algorithm. The new system outputs Long, Short and Hedge signals instead of just Long and Short signals.
The first sub-logic is the spiritual successor of the original Swing Algo V1.3 release, with a modified oscillator part.
The second sub-logic serves as a control algorithm (while still having equal rights in terms of strategy impact), newly introduced to the Swing Algo series, but already forwardtested for roughly a year at time of release.
Lowers risk significantly by diversifying swing trading strategies, so that for the rare scenario of a missed trend on one sub-algorithm, losses are prevented as the overall strategy is hedged during that time.
Lowers risk further as the maximum drawdown of the combined strategy is reduced by roughly 1/3 in comparison to each stand-alone strategy while almost retaining the same net profit over a 6-year backtest compared to the first, leading sub-logic.
No guesswork anymore when to use which short leverage (1x corresponding to a Hedge, or 2x corresponding to a Short with an asset-value-change-to-gain-proportionality of -1) as it is clearly defined within the trading system via the displayed signals. In earlier Swing Algo versions, the short leverage for any particular Short signal had to be chosen by hand dependent on market sentiment, which required further market analysis, or was fixed at 2x, leading to less flexibility.
◆ Access
For access please contact me via DM on TradingView or via other channels (linked on my TradingView profile and in my signature).
Fetch Buy And Hold StrategyThis script was created as an experiment using ChatGPT. I actually woudn't recommend using the ai program to help you with your Pinescripts, as it makes a fair amount of mistakes. It was a fun experiment however.
The script is a simple buy and hold tool. Here's what it does:
- Everytime the rsi enters below the set treshold, a counter increases.
- The second increase of the counter happens when the price goes above the treshold, and then dips below the treshold again.
- The program would fire off a buy signal when the counter hits the number 3.
- After the buy. the counter will reset.
Lets take a look at the following example where the rsi treshold is 30:
- So the rsi dips below 30 and the initial counter is set from 0 to 1.
- The price rises which brings the rsi back to 40.
- Then another dip happens and the rsi is now 25, increasing the counter from 1 two.
- Rsi now dips to 23 and nothing happens.
- Rsi goes back up to 31, and dips back to 28 which puts the counter at 3. A buy singal is now fired and the counter is set to 0.
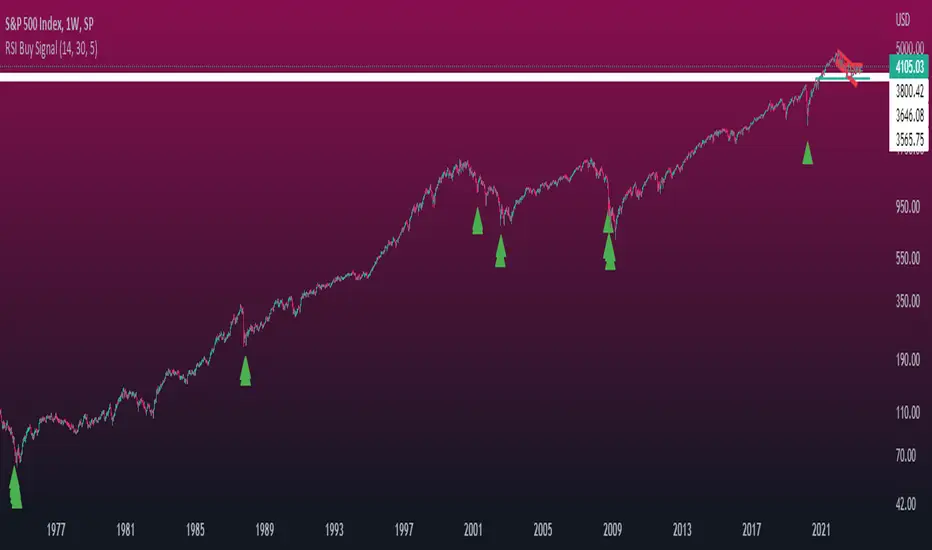
Baekdoo arrows (white : long term CCI trend changing signal)Hi forks,
I'm trader Baekdoosan who trading Equity from South Korea. This long term CCI trend changing signal will gives you good buy point for a long term trading.
As you know, CCI ( Commodity Channel Index ) is the indicator of how difference from MA(Moving Average). If CCI (period) value is 0 then it is the same value of the SMA (price, period). Indication of overselling or overbuying will be counted by -100 and 100 value of CCI . What I chose value is 240. which is almost a year of period. My signal will be plotted this long term CCI indicator cross over -100. But I don't want it to be marked in case of long term CCI value fluctuating from -101 to -99 which will be marked frequently. Thus I put candle counter of 60 days after cross under -100 then only I count for cross over -100. By this I have very good signal to mark on the chart. Please enjoy my signal and have good profit from it~! Gazua~!

Buy the Dips (by Coinrule)Taking your first steps into automated trading may be challenging. Coinrule's mission is to make it as easy as possible, also for beginners.
Here follows the best trading strategy to get started with Coinrule. This strategy doesn't involve complex indicators, yet was proved to be effective in the long term for many coins. Results seem to be improved when trading a coin vs Bitcoin.
The strategy buys the dips of a coin to sell with a profit. A stop-loss protects every trade.
Crypto markets offer high volatility and, thus, excellent opportunities for trading. Excluding times of severe downtrend, buying the dip is a simple and effective long-term trading strategy. The buy-signal is set to a 2% drop in a 30-minutes time frame.
Each trade comes with a take profit and a stop loss. Both set at 2%.
You can adjust these percentages to the market volatility as an advanced setup. You can backtest the outcomes using the backtesting tool from Tradingview
The strategy assumes each order to trade 30% of the available capital. A trading fee of 0.1% is taken into account. The fee is aligned to the base fee applied on Binance, which is the largest cryptocurrency exchange.

Detrended Price OscillatorTHIS IS THE INDICATOR VERSION
What is DPO?
A detrended price oscillator is an oscillator that strips out price trends in an effort to estimate the length of price cycles from peak to peak or trough to trough. Unlike other oscillators, such as the stochastic or moving average convergence divergence (MACD), the DPO is not a momentum indicator. It highlights peaks and troughs in price, which are used to estimate buy and sell points in line with the historical cycle.
(From Investopedia )
Indicator features:
Responds faster to trend changes than the original code.
Added alternative smoothing algorithms. Defaults to Ehler's Optimum Elliptic filter instead of the orginal SMA
IPOCS - can start printing out data at day 1 instead of waiting for 14 or 20 bars
Dynamic colors
Auto timeframe detection to adjust period/length
How to use:
Buy above zero
Sell below zero
Who is it for?
Long term investors - this is the perfect indicator for those who buy and hold
Timeframe usage:
Works best on the weekly and monthly chart. Again, this is an indicator for long term trades, not day trading

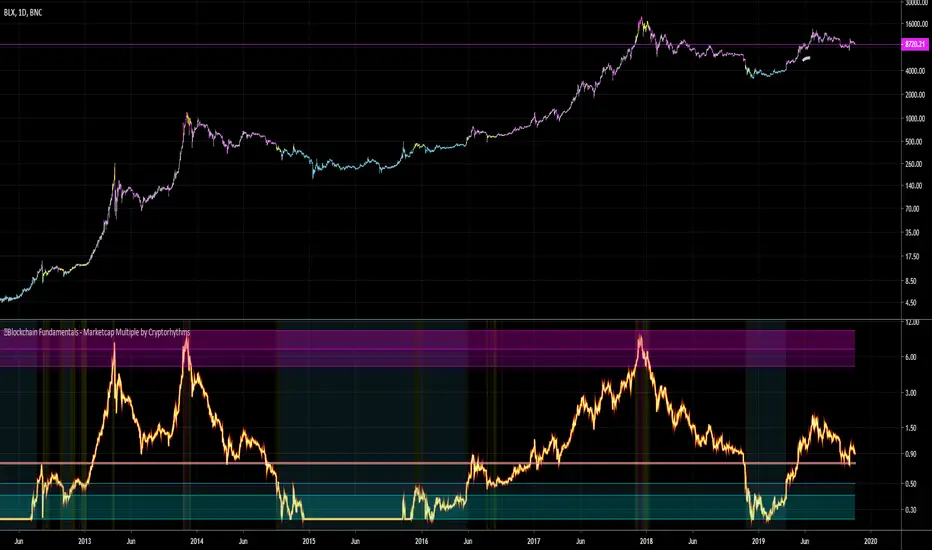
🔗Blockchain Fundamentals - Marketcap Multiple by Cryptorhythms🔗Blockchain Fundamentals - Marketcap Multiple by Cryptorhythms
Intro
A brand new original indicator to judge long term bitcoin accumulation and distribution zones. Created by myself - theheirophant.
I love the way the indicator MVRV (market value to realized value) works, but there's no way to replicate it on tradingview as it uses outside data not available in the TV ecosystem. Then while looking at various marketcap alternatives, and idea was plain in front of my face!
Looking at marketcap + top cap + average cap creates a bounded area of price as seen here
Description
So I created an oscillator that shows marketcap's relation to top cap as the upper bound, and average cap as the lower bound. It then is rescaled from 0.25 to 10.
It should be viewed on a logrithmic scale and only works on the daily timeframe. You can enable/disable bar coloration and background highlighting from options.
It can be interpreted as times to accumulate and distribute on a long term basis. It would work well for trading spot markets.
The line at 0.75 acts as a sentiment indicator (above it is bullish, below it is bearish).
👍 Enjoying this indicator or find it useful? Please give me a like and follow (dont forget twitter also)! I post crypto analysis, price action strategies and free indicators regularly.
💬 Questions? Comments? Want to get access to an entire suite of proven trading indicators? Come visit us on telegram and chat. We make timely posts about the market, news, and strategy everyday. Our community isn't open only to subscribers - everyone is welcome to join. (check my sig)
🔮 Mayer Multiple w/ MA Selection by Cryptorhythms🔮 Mayer Multiple w/ MA Selection by Cryptorhythms
Description
Introduced by Trace Mayer as a way to gauge the current price of Bitcoin against its long range historical price movements (200 day SMA by default), the Mayer Multiple highlights when Bitcoin is overbought or oversold in the context of longer time frames.
It`s worth noting as the market becomes larger and less volatile, the peaks are becoming less exaggerated. This is because a 200 day moving average baseline is a static yardstick against an ever growing, more stable, Bitcoin market. We should eventually recalibrate what constitutes the overbought/oversold extremes on this chart accordingly.
Additional Features
I added a heatmap based coloring and background highlighting of configurable overbought and oversold zones.
In my testing I observed anecdotal evidence that a value of >1 signaled bull market sentiment and a value of <1 signaled bear sentiment. So I added the dashed line at that value.
I also added secondary zones for experimentation on other timeframes or just plain tinkering.
Lastly I added the ability to substitute the SMA for a few different types of moving averages.
Default Settings
The defaults zones are > 2.4 is overvalued and < 0.5 is undervalued. Default timeframe is daily
Default MA is SMA and default length is 200
Suggested MA length for weekly chart is 28
👍Enjoying this indicator or find it useful? Please give me a like and follow! I post crypto analysis, price action strategies and free indicators regularly.
💬Questions? Comments? Want to get access to an entire suite of proven trading indicators? Come visit us on telegram and chat, or just soak up some knowledge. We make timely posts about the market, news, and strategy everyday. Our community isnt open only to subscribers - everyone is welcome to join.

Coppock Curve with its own Moving AverageIt shows Coppock with its own moving average. (Yes, in a way, 3 moving averages.)
Advised to use :
for long term, certainly not for day-trade;
on daily charts;
not as a standalone indicator, helps to read RSI, Klinger, TSI, CCI, etc.
as momentum-signaling: crossing 0, inflection points, crossover
as a quasi-centered, quasi oscillator, but not proportional always.
Weakness: mourning period certainly not the same for everyone.
