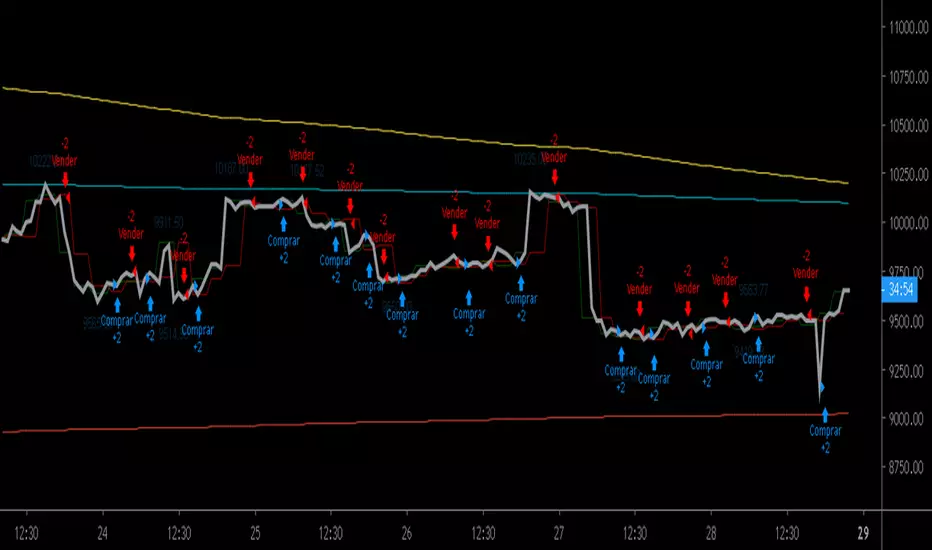
Profit Runner Strategy v2.0This is the strategy version of the recently posted Profit Runner v2.0 study. We include both together so that users can use the strategy for backtesting and figuring out the optimal settings for their specific usage and then implement those settings in the study version(which includes alerts for automated trading).
Green background highlights are buy signals and red background highlights are sell signals. Red and green filled area show the user's stop loss .
M-oscillator


Parabolic SAR StrategyReally questioning how the trailing stop works in the backtesting framework of tradingview/pinescript, I am sure I would not get the same results with the same strategy in MT4.

Stochastic Slow Strategy_MoneyManagmentEdited the example Stochastic Slow Strategy, testing pinescript v4

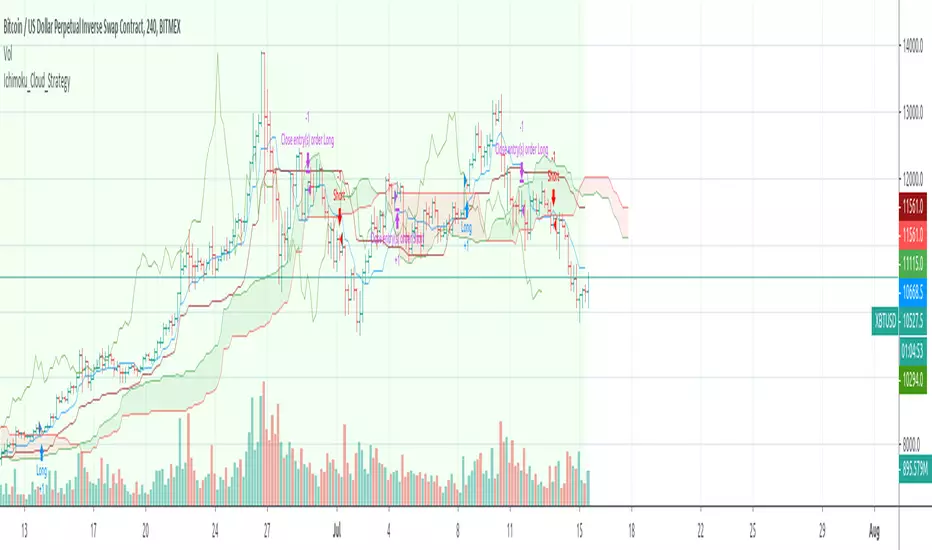
Dynasty Position Pickup by Tirano안녕하세요. 다이너스티 팀의 안드레아 입니다.
기존에 티라노라는 이름으로 활동했습니다.
Support-Resistance Cloud 소개
1. 한번이라도 지지 혹은 저항이 작용한 구간을 라인으로 표현합니다. 한번 맞고 튕긴 구간은 되돌림을 통한 리테스트가 있기 마련이고, 다시한번 튕길 가능성이 높습니다.
- 따라서 되돌림이 일어났을때 선으로 표현되는 구간에서 진입하면 수익으로 연계할 확률이 높습니다.
- 매물대를 표현한 PoC 라인이 보조적으로 사용됩니다. (피보나치 상으로 의미있는 구간에 표현됩니다)
- 박스권 상황에 유리합니다.
2. 전체적인 흐름을 구름과 채널의 형태로 표현합니다.
- 구름이 서서히 내려오며 하방 추세라면 매수신호에서 long으로 진입하기 보다는, 구름에 닿았을때 short으로 진입하는게 좋습니다.
- 전체적인 흐름(추세)를 거스르지 않고 매매할 수 있습니다.
- 한 방향으로 진행되는 one way 상황에 유리합니다.
기타 문의 사항은 댓글 남겨주시면 감사하겠습니다.
Hi. this is Andreas of the Dynasty team.
Introduction to Support-Resistance Cloud
1. The lines where the support or resistance acts once are expressed by lines. Once hit and bounced, there is a retest through bounce, and it is likely to bounce again.
- Therefore, if you enter from the section represented by the line when the recurrence occurs, the probability of linking with the profit is high.
- The PoC line representing the residential area is supplementary. (Expressed in Fibonacci sensible section)
- It is advantageous in the box case situation.
2. Express the overall flow in the form of clouds and channels.
- If the cloud is going down slowly, it is better to go into the short when touching the cloud, rather than going into long in the buy signal.
- You can trade without overtaking the whole flow (trend).
- It is advantageous for one way situation that goes in one direction.
If you have any other questions, please leave a comment.

Combo Backtest 123 Reversal & Chaikin Volatility This is combo strategies for get a cumulative signal.
First strategy
This System was created from the Book "How I Tripled My Money In The
Futures Market" by Ulf Jensen, Page 183. This is reverse type of strategies.
The strategy buys at market, if close price is higher than the previous close
during 2 days and the meaning of 9-days Stochastic Slow Oscillator is lower than 50.
The strategy sells at market, if close price is lower than the previous close price
during 2 days and the meaning of 9-days Stochastic Fast Oscillator is higher than 50.
Second strategy
Chaikin's Volatility indicator compares the spread between a security's
high and low prices. It quantifies volatility as a widening of the range
between the high and the low price.
You can use in the xPrice1 and xPrice2 any series: Open, High, Low, Close, HL2,
HLC3, OHLC4 and ect...
WARNING:
- For purpose educate only
- This script to change bars colors.

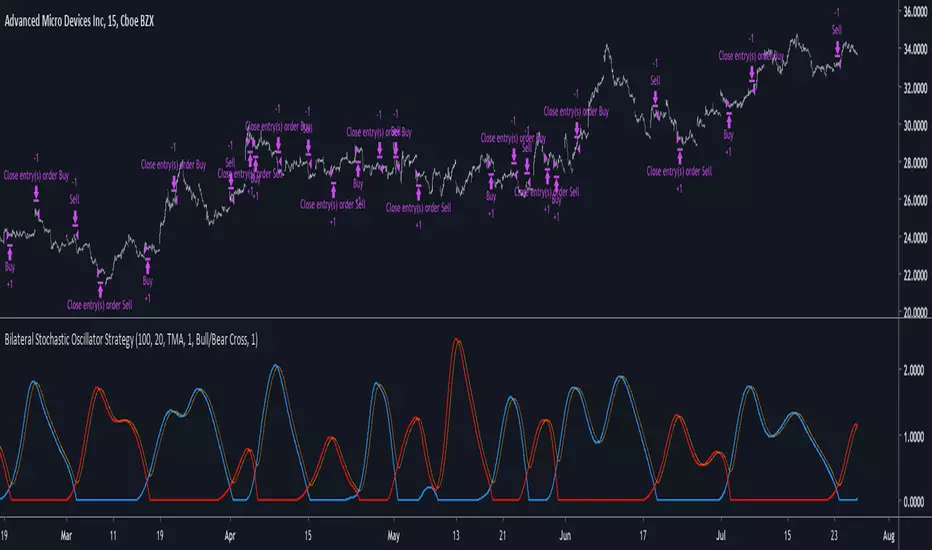
Bilateral Stochastic Oscillator StrategyIntroduction
Strategy based on the bilateral stochastic oscillator, this oscillator aim to detect trends and possible reversal points of the current trend. The oscillator is composed of 1 bull line in blue and 1 bear line in red as well as a signal line in orange, the strategy have many options such as two different strategy framework and a martingale mode. If you require more information about the indicator go check it into my uploaded indicators.
Strategy Frameworks
There are two frameworks available that can be selected from the strategy settings window. Both have the same closing conditions, the "Bull/Bear Cross" entry conditions are :
Buy : when the bull line cross over the bear line
Sell : when the bear line cross over the bull line
The "Signal Cross" entry conditions are :
Buy : when the bull line cross over the signal line
Sell : when the bear line cross over the signal line
Both have the same close conditions that is : close when bull/bear cross under the signal line.
Introduction To Martingale
The martingale money management system consist to double the order size after a loosing trade and can be described as a 2^x where x is the current number of loosing trades since the last win trade, when we win a trade the order size return to the default order size. Therefore our order size function is based on exponential growth.
This system enable the trader to win back his previous losses plus a potential profit, martingales must always be used with stops and sometimes take profits in order to get control in a strategy.
It must always be taken into account that in a series of losses the balance can exponentially decay thus ending to 0 in a matter of trades, this is why it is not recommended to use such system. The strategy allow you to select a martingale multiplier that can be inferior to 2 thus limiting risks, a multiplied of 1 disable the martingale.
Results
Those are the some statistics of the strategy applied to some forex majors by using the default settings in a time frames of 15 minutes.
//-------------------------------------------------------
EURUSD - Order Size 1000 - Spread 0.0002
Profit : $ 21.08
Trades : 19
PP : 57.89 %
Profit Factor : 3.228
Max Drawdown : -$ 3.81
Average Trade : $ 1.11
//-------------------------------------------------------
GBPUSD - Order Size 1000 - Spread 0.0002
Profit : $ 2.31
Trades : 20
PP : 55 %
Profit Factor : 0.938
Max Drawdown : -$ 20.29
Average Trade : $ 0.12
//-------------------------------------------------------
EURAUD - Order Size 1000 - Spread 0.0002
Profit : -$ 9.22
Trades : 20
PP : 40 %
Profit Factor : 0.698
Max Drawdown : -$ 23.44
Average Trade : $ 0.46
//-------------------------------------------------------
EURCHF - Order Size 1000 - Spread 0.0002
Profit : $ 1.58
Trades : 24
PP : 54.17 %
Profit Factor : 1.103
Max Drawdown : -$ 7.23
Average Trade : $ 0.07
//-------------------------------------------------------
Conclusions
Based on the results the strategy does not posses the sufficient performance in order to apply a martingale or any other growth systems as order size. Parameters might be subject to drastic changes depending on the market/time-frame in order to return long-term positive results. I let you draw your conclusions.
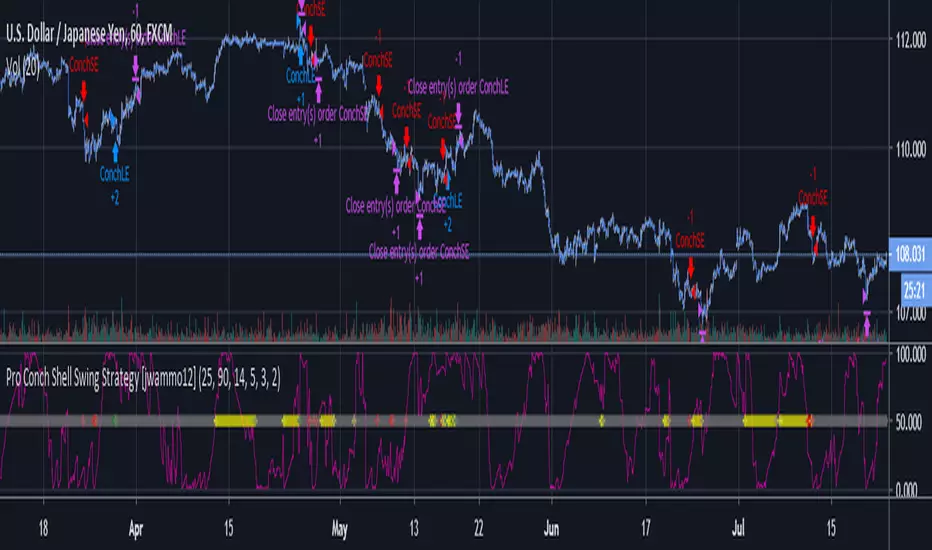
Pro Conch Shell Swing Strategy [jwammo12]This is a swing strategy that has been backtested and shown profitable over many instruments.
Message me for pricing and a free trial
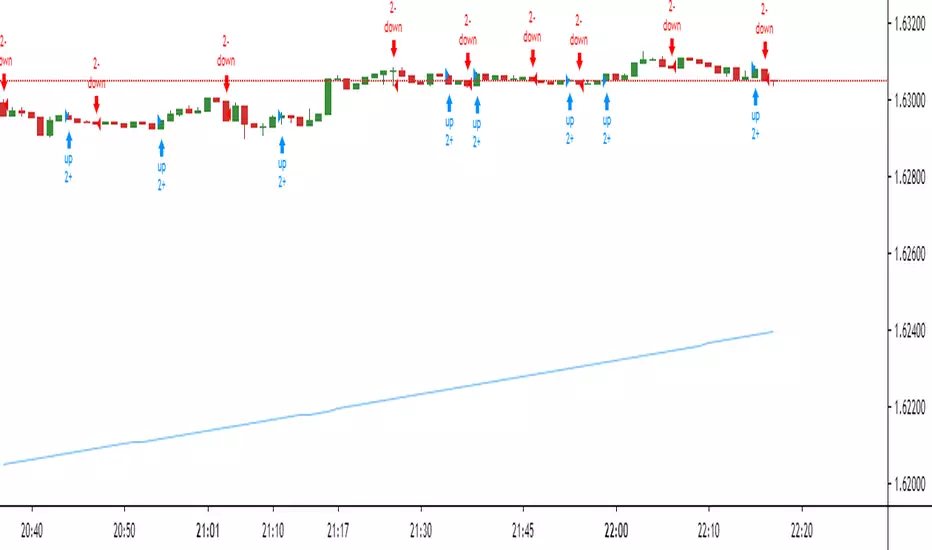
PA High Frequency TradingThis is PA High Frequency Trading Strategy
High Frequency Trading
5min Scalping Strategy

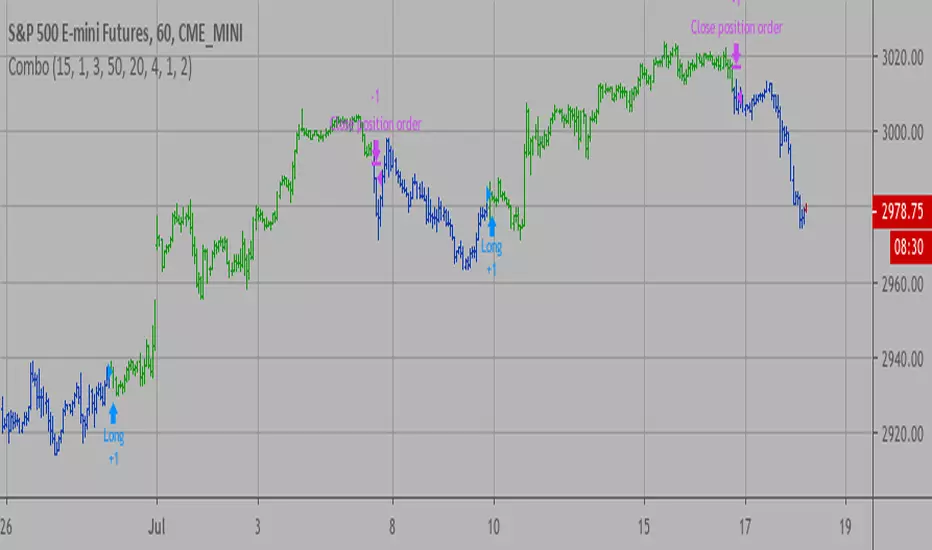
Combo Backtest 123 Reversal & Center Of Gravity This is combo strategies for get a cumulative signal.
First strategy
This System was created from the Book "How I Tripled My Money In The
Futures Market" by Ulf Jensen, Page 183. This is reverse type of strategies.
The strategy buys at market, if close price is higher than the previous close
during 2 days and the meaning of 9-days Stochastic Slow Oscillator is lower than 50.
The strategy sells at market, if close price is lower than the previous close price
during 2 days and the meaning of 9-days Stochastic Fast Oscillator is higher than 50.
Second strategy
The indicator is based on moving averages. On the basis of these, the
"center" of the price is calculated, and price channels are also constructed,
which act as corridors for the asset quotations.
WARNING:
- For purpose educate only
- This script to change bars colors.


Combo Strategy 123 Reversal & CCI This is combo strategies for get a cumulative signal.
First strategy
This System was created from the Book "How I Tripled My Money In The
Futures Market" by Ulf Jensen, Page 183. This is reverse type of strategies.
The strategy buys at market, if close price is higher than the previous close
during 2 days and the meaning of 9-days Stochastic Slow Oscillator is lower than 50.
The strategy sells at market, if close price is lower than the previous close price
during 2 days and the meaning of 9-days Stochastic Fast Oscillator is higher than 50.
Second strategy
The Commodity Channel Index (CCI) is best used with markets that display cyclical or
seasonal characteristics, and is formulated to detect the beginning and ending of these
cycles by incorporating a moving average together with a divisor that reflects both possible
and actual trading ranges. The final index measures the deviation from normal, which indicates
major changes in market trend.
To put it simply, the Commodity Channel Index (CCI) value shows how the instrument is trading
relative to its mean (average) price. When the CCI value is high, it means that the prices are
high compared to the average price; when the CCI value is down, it means that the prices are low
compared to the average price. The CCI value usually does not fall outside the -300 to 300 range
and, in fact, is usually in the -100 to 100 range.
WARNING:
- For purpose educate only
- This script to change bars colors.

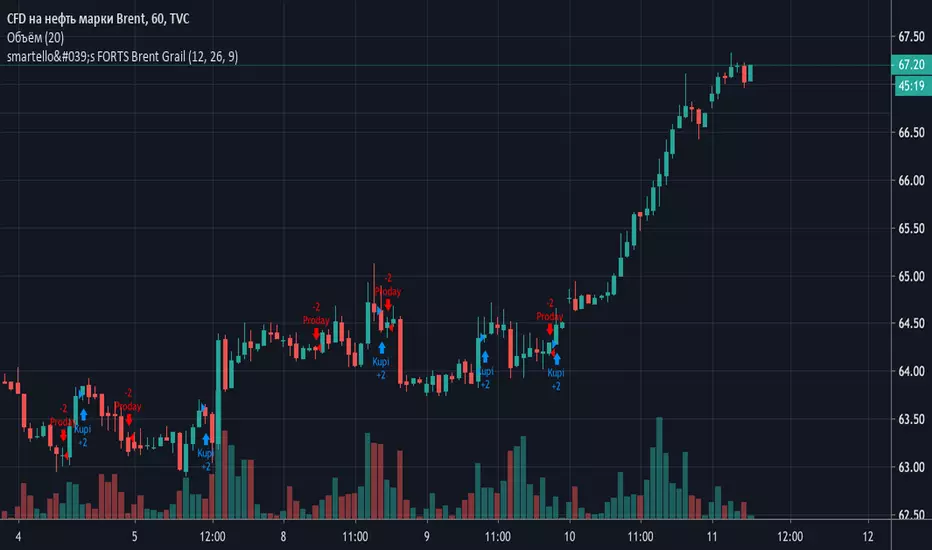
smartello's FORTS Brent GrailThis is a pre-alpha version, don't use it yet.
This is a multi-timeframe strategy. Don't trade against the trend on a higher timeframe, crude is cruel!

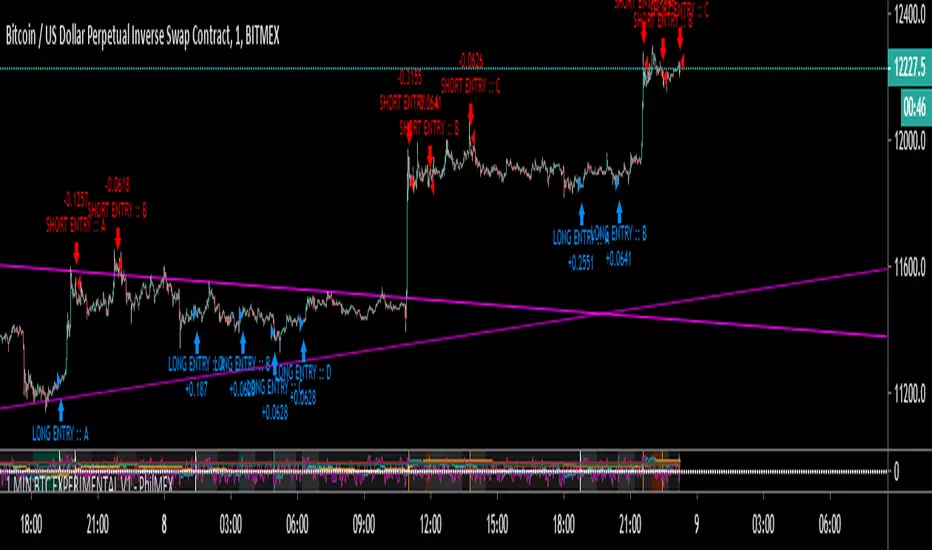
1 MIN BTC EXPERIMENTAL V1 - PhilMEXThis script is intented to work only on 1 minute chart.
It gives very clear signals for buy or sell and has no repainting.
Unfortunatelly I can only test it with the 7 last day due to limit for backtesting.
Do you know guys how can I extend this backtesting time period?
Please use it very carrefully. I'm not responsible for your loss.
If you want updates or more indicators like this one please give me a thumbs up ;)