Adaptive RSI (ARSI)# Adaptive RSI (ARSI) - Dynamic Momentum Oscillator
Adaptive RSI is an advanced momentum oscillator that dynamically adjusts its calculation period based on real-time market volatility and cycle analysis. Unlike traditional RSI that uses fixed periods, ARSI continuously adapts to market conditions, providing more accurate overbought/oversold signals and reducing false signals during varying market phases.
## How It Works
At its core, ARSI calculates an adaptive period ranging from 8 to 28 bars using two key components: volatility measurement through Average True Range (ATR) and cycle detection via price momentum analysis. The logic is straightforward:
- **High volatility periods** trigger shorter calculation periods for enhanced responsiveness to rapid price movements
- **Low volatility periods** extend the calculation window for smoother, more reliable signals
- **Market factor** combines volatility and cycle analysis to determine optimal RSI period in real-time
When RSI crosses above 70, the market enters overbought territory. When it falls below 30, oversold conditions emerge. The indicator also features extreme levels at 80/20 for stronger reversal signals and midline crossovers at 50 for trend confirmation.
The adaptive mechanism ensures the oscillator remains sensitive during critical market movements while filtering out noise during consolidation phases, making it superior to static RSI implementations across different market conditions.
## Features
- **True Adaptive Calculation**: Dynamic period adjustment from 8-28 bars based on market volatility
- **Multiple Signal Types**: Overbought/oversold, extreme reversals, and midline crossovers
- **Configurable Parameters**: RSI length, adaptive sensitivity, ATR period, min/max bounds
- **Smart Smoothing**: Adjustable EMA smoothing from 1-21 periods to reduce noise
- **Visual Clarity**: Gradient colors, area fills, and signal dots for immediate trend recognition
- **Real-time Information**: Live data table showing current RSI, adaptive period, and market factor
- **Flexible Source Input**: Apply to any price source (close, hl2, ohlc4, etc.)
- **Professional Alerts**: Six built-in alert conditions for automated trading systems
## Signal Generation
ARSI generates multiple signal types for comprehensive market analysis:
**Primary Signals**: RSI crosses above 70 (overbought) or below 30 (oversold) - most reliable entry/exit points
**Extreme Signals**: RSI reaches 80+ (extreme overbought) or 20- (extreme oversold) - potential reversal zones
**Trend Signals**: RSI crosses above/below 50 midline - confirms directional momentum
**Reversal Signals**: Price action contradicts extreme RSI levels - early turning point detection
The adaptive period changes provide additional confirmation - signals accompanied by significant period shifts often carry higher probability of success.
## Visual Implementation
The indicator employs sophisticated visual elements for instant market comprehension:
- **Gradient RSI Line**: Color intensity reflects both value and momentum direction
- **Dynamic Zones**: Overbought/oversold areas with customizable fill colors
- **Signal Markers**: Triangular indicators mark key reversal and continuation points
- **Information Panel**: Real-time display of RSI value, adaptive period, market factor, and signal status
- **Background Coloring**: Subtle fills indicate current market state without chart clutter
## Parameter Configuration
**RSI Settings**:
- RSI Length: Base calculation period (default: 14)
- Adaptive Sensitivity: Response aggressiveness to volatility changes (default: 1.0)
- ATR Length: Volatility measurement period (default: 14)
- Min/Max Period: Adaptive calculation boundaries (default: 8/28)
- Smoothing Length: Final noise reduction filter (default: 3)
**Level Settings**:
- Overbought/Oversold: Standard signal levels (default: 70/30)
- Extreme Levels: Enhanced reversal zones (default: 80/20)
- Midline Display: 50-level trend confirmation toggle
**Visual Settings**:
- Line Width: RSI line thickness (1-5)
- Area Fills: Zone highlighting toggle
- Gradient Colors: Dynamic color intensity
- Signal Dots: Entry/exit marker display
## Alerts
ARSI includes six comprehensive alert conditions:
- **ARSI Overbought** - RSI crosses above overbought level
- **ARSI Oversold** - RSI crosses below oversold level
- **ARSI Bullish Cross** - RSI crosses above 50 midline
- **ARSI Bearish Cross** - RSI crosses below 50 midline
- **ARSI Extreme Bull** - Potential bullish reversal from extreme oversold
- **ARSI Extreme Bear** - Potential bearish reversal from extreme overbought
## Use Cases
**Trend Following**: Adaptive periods naturally adjust during trend acceleration and consolidation phases
**Mean Reversion**: Enhanced overbought/oversold signals with volatility-based confirmation
**Breakout Trading**: Extreme level breaches often precede significant directional moves
**Risk Management**: Multiple signal types allow for layered entry/exit strategies
**Multi-Timeframe Analysis**: Works effectively across various timeframes and asset classes
## Trading Applications
**Swing Trading**: Excels during trend transitions with adaptive sensitivity to changing conditions
**Day Trading**: Enhanced responsiveness during volatile sessions while filtering consolidation noise
**Position Trading**: Longer smoothing periods provide stable signals for broader market analysis
**Scalping**: Minimal smoothing with high sensitivity captures short-term momentum shifts
The indicator performs well across stocks, forex, commodities, and cryptocurrencies, though parameter optimization may be required for specific market characteristics.
## Settings Summary
**Display Settings**:
- RSI Length: Moving average baseline period
- Adaptive Sensitivity: Volatility response factor
- ATR Length: Volatility measurement window
- Min/Max Period: Adaptive calculation boundaries
- Smoothing Length: Noise reduction filter
**Level Configuration**:
- Overbought/Oversold: Primary signal thresholds
- Extreme Levels: Secondary reversal zones
- Midline Display: Trend confirmation toggle
**Visual Options**:
- Line Width: RSI line appearance
- Area Fills: Zone highlighting
- Gradient Colors: Dynamic visual feedback
- Signal Dots: Entry/exit markers
## Disclaimer
This indicator is provided for educational and informational purposes only. It is not financial advice. Trading involves substantial risk of loss and is not suitable for all investors. Past performance is not indicative of future results. Always conduct thorough testing and risk assessment before live implementation. The adaptive nature of this indicator requires understanding of its behavior across different market conditions for optimal results.
M-oscillator

Ticker Pulse Meter BasicPairs nicely with the Contrarian 100 MA located here:
and the Enhanced Stock Ticker with 50MA vs 200MA located here:
Description
The Ticker Pulse Meter Basic is a dynamic Pine Script v6 indicator designed to provide traders with a visual representation of a stock’s price position relative to its short-term and long-term ranges, enabling clear entry and exit signals for long-only trading strategies. By calculating three normalized metrics—Percent Above Long & Above Short, Percent Above Long & Below Short, and Percent Below Long & Below Short—this indicator offers a unique "pulse" of market sentiment, plotted as stacked area charts in a separate pane. With customizable lookback periods, thresholds, and signal plotting options, it empowers traders to identify optimal entry points and profit-taking levels. The indicator leverages Pine Script’s force_overlay feature to plot signals on either the main price chart or the indicator pane, making it versatile for various trading styles.
Key Features
Pulse Meter Metrics:
Computes three percentages based on short-term (default: 50 bars) and long-term (default: 200 bars) lookback periods:
Percent Above Long & Above Short: Measures price strength when above both short and long ranges (green area).
Percent Above Long & Below Short: Indicates mixed momentum (orange area).
Percent Below Long & Below Short: Signals weakness when below both ranges (red area).
Flexible Signal Plotting:
Toggle between plotting entry (blue dots) and exit (white dots) signals on the main price chart (location.abovebar/belowbar) or in the indicator pane (location.top/bottom) using the Plot Signals on Main Chart option.
Entry/Exit Logic:
Long Entry: Triggered when Percent Above Long & Above Short crosses above the high threshold (default: 20%) and Percent Below Long & Below Short is below the low threshold (default: 40%).
Long Exit: Triggered when Percent Above Long & Above Short crosses above the profit-taking level (default: 95%).
Visual Enhancements:
Plots stacked area charts with semi-transparent colors (green, orange, red) for intuitive trend analysis.
Displays threshold lines for entry (high/low) and profit-taking levels.
Includes a ticker and timeframe table in the top-right corner for quick reference.
Alert Conditions: Supports alerts for long entry and exit signals, integrable with TradingView’s alert system for automated trading.
Technical Innovation: Combines normalized price metrics with Pine Script v6’s force_overlay for seamless signal integration on the price chart or indicator pane.
Technical Details
Calculation Logic:
Uses confirmed bars (barstate.isconfirmed) to calculate metrics, ensuring reliability.
Short-term percentage: (close - lowest(low, lookback_short)) / (highest(high, lookback_short) - lowest(low, lookback_short)).
Long-term percentage: (close - lowest(low, lookback_long)) / (highest(high, lookback_long) - lowest(low, lookback_long)).
Derived metrics:
pct_above_long_above_short = (pct_above_long * pct_above_short) * 100.
pct_above_long_below_short = (pct_above_long * (1 - pct_above_short)) * 100.
pct_below_long_below_short = ((1 - pct_above_long) * (1 - pct_above_short)) * 100.
Signal Plotting:
Entry signals (long_entry) use ta.crossover to detect when pct_above_long_above_short crosses above entryThresholdhigh and pct_below_long_below_short is below entryThresholdlow.
Exit signals (long_exit) use ta.crossover for pct_above_long_above_short crossing above profitTake.
Signals are plotted as tiny circles with force_overlay=true for main chart or standard plotting for the indicator pane.
Performance Considerations: Optimized for efficiency by calculating metrics only on confirmed bars and using lightweight plotting functions.
How to Use
Add to Chart:
Copy the script into TradingView’s Pine Editor and apply it to your chart.
Configure Settings:
Short Lookback Period: Adjust the short-term lookback (default: 50 bars) for sensitivity.
Long Lookback Period: Set the long-term lookback (default: 200 bars) for broader context.
Entry Thresholds: Modify high (default: 20%) and low (default: 40%) thresholds for entry conditions.
Profit Take Level: Set the exit threshold (default: 95%) for profit-taking.
Plot Signals on Main Chart: Check to display signals on the price chart; uncheck for the indicator pane.
Interpret Signals:
Long Entry: Blue dots indicate a strong bullish setup when price is high relative to both lookback ranges and weakness is low.
Long Exit: White dots signal profit-taking when strength reaches overbought levels.
Use the stacked area charts to assess trend strength and momentum.
Set Alerts:
Create alerts for Long Entry and Long Exit conditions using TradingView’s alert system.
Customize Visuals:
Adjust colors and thresholds via TradingView’s settings for better visibility.
The ticker table displays the symbol and timeframe in the top-right corner.
Example Use Cases
Swing Trading: Use entry signals to capture short-term bullish moves within a broader uptrend, exiting at profit-taking levels.
Trend Confirmation: Monitor the green area (Percent Above Long & Above Short) for sustained bullish momentum.
Market Sentiment Analysis: Use the stacked areas to gauge bullish vs. bearish sentiment across timeframes.
Notes
Testing: Backtest the indicator on your chosen market and timeframe to validate its effectiveness.
Compatibility: Built for Pine Script v6 and tested on TradingView as of June 20, 2025.
Limitations: Signals are long-only; adapt the script for short strategies if needed.
Enhancements: Consider adding a histogram for the difference between metrics or additional thresholds for nuanced trading.
Acknowledgments
Inspired by public Pine Script examples and designed to simplify complex market dynamics into a clear, actionable tool. For licensing or support, contact Chuck Schultz (@chuckaschultz) on TradingView. Share feedback in the comments, and happy trading!

VWVI - Volume Weighted Volatility Index# 📊 Complete VWVI Indicator User Guide (Current Version)
## 🔍 **I. Core Principles**
### **VWVI's Unique Value**
VWVI isn't a simple volatility indicator, but a **volume-confirmed volatility strength indicator**:
- **Problems with traditional volatility indicators**: ATR, Bollinger Bands, etc. only look at price movements while ignoring volume
- **VWVI advantage**: Only fluctuations accompanied by high volume are considered "true volatility"
- **Core logic**: Fluctuations driven by large capital are more important than retail noise
---
## 🎨 **II. Detailed Explanation of Current Version Visual Elements**
### **1. Main Line Color System (Most Important Signal)**
```
🟢 Green main line (VWVI > 60):
├─ Meaning: High volatility + high volume = true trend
├─ Market state: One-way market, breakout market, trend acceleration
├─ Trading opportunity: Trend following, momentum trading
└─ Duration: Typically lasts several cycles
🟠 Orange main line (40 ≤ VWVI ≤ 60):
├─ Meaning: Medium volatility or mismatched volume
├─ Market state: Transition phase, direction pending
├─ Trading strategy: Wait-and-see, await clear signals
└─ Note: High probability of false breakouts
🔴 Red main line (VWVI < 40):
├─ Meaning: Low volatility + low volume = consolidation
├─ Market state: Sideways, range-bound, shrinking volume
├─ Trading opportunity: Range trading, mean reversion
└─ Feature: Price oscillates between support/resistance
```
### **2. Reference Line System (Auxiliary Judgment)**
```
🟢 Trend threshold line (default 60):
├─ Function: Watershed for trend confirmation
├─ Breakout upward: Trend begins confirmation
├─ Break downward: Trend weakening or ending
└─ Adjustment suggestion: Can adjust based on market characteristics (50-70)
🔴 Range threshold line (default 40):
├─ Function: Confirmation line for range-bound markets
├─ Break downward: Range-bound market confirmed
├─ Breakout upward: Range may be ending
└─ Adjustment suggestion: Can adjust based on volatility (30-50)
⚫ Center line (50):
├─ Function: Market neutral reference
├─ Above: Trend characteristics
├─ Below: Range characteristics
└─ Meaning: Long-term equilibrium position
```
### **3. Background Coloring System (State Identification)**
```
🟢 Light green background:
├─ Trigger: VWVI > trend threshold
├─ Meaning: Trend confirmation period
├─ Trading suggestion: Trend following strategy
└─ Risk: Possible reversal at trend end
🔴 Light red background:
├─ Trigger: VWVI < range threshold
├─ Meaning: Range-bound confirmation period
├─ Trading suggestion: Range trading strategy
└─ Opportunity: Look for support/resistance levels
🟩 Green background flashing:
├─ Trigger: VWVI breaks through trend threshold
├─ Meaning: Trend signal generated
├─ Action: Consider establishing trend positions
└─ Confirmation: Needs other indicators
🟥 Red background flashing:
├─ Trigger: VWVI breaks below range threshold
├─ Meaning: Range signal generated
├─ Action: Consider range trading strategy
└─ Confirmation: Observe persistence
```
### **4. Information Panel (Upper Right Corner)**
```
📊 Real-time data display:
├─ VWVI value: Current indicator reading
├─ Current state: Trend/Range/Neutral
├─ Volume status: Above/Below 20-day average
├─ Volatility strength: High/Low volatility
├─ Trend threshold: Current setting
└─ Range threshold: Current setting
```
---
## 📈 **III. Specific Usage Methods**
### **A. Trend Following Strategy**
```
🎯 Entry timing:
✅ VWVI breaks above 60 from below (green background flashing)
✅ Main line turns green and continues rising
✅ Volume status shows "above average"
✅ Volatility strength shows "high volatility"
📍 Position management:
- Continue holding: VWVI remains above 60
- Reduce position warning: VWVI starts declining but still >50
- Stop loss exit: VWVI breaks below 50 or turns orange
⚠️ Risk control:
- False breakout: VWVI quickly falls back after breaking 60
- Trend end: VWVI oscillates at high levels
```
### **B. Range Trading Strategy**
```
🎯 Confirm range:
✅ VWVI breaks below 40 (red background flashing)
✅ Main line turns red and lingers at low levels
✅ Volume status shows "below average"
✅ Volatility strength shows "low volatility"
📍 Trading strategy:
- Upper range: Look for resistance to short
- Lower range: Look for support to long
- Stop loss: Breakout beyond range boundaries
- Profit target: Near range midpoint
⚠️ Notes:
- False breakouts may occur at range end
- Abnormal volume spikes may signal trend change
```
### **C. State Transition Strategy**
```
🔄 Range→Trend transition:
- Observe: VWVI rises from <40 to 40-60 range
- Prepare: Orange main line phase preparation
- Confirm: Consider entry when breaking 60
- Verify: Whether volume expands simultaneously
🔄 Trend→Range transition:
- Warning: VWVI declines from >60 to 40-60 range
- Reduce position: Gradually reduce in orange phase
- Confirm: Switch to range strategy when breaking 40
- Observe: Whether it's a trend pullback
```
---
## ⚠️ **IV. Common Mistakes and Precautions**
### **❌ Common Mistakes**
1. **Mistake 1: Using VWVI alone**
- ❌ Wrong: Making trading decisions based solely on VWVI
- ✅ Correct: Combine with price action, support/resistance, other indicators
2. **Mistake 2: Ignoring volume confirmation**
- ❌ Wrong: Only looking at VWVI values, ignoring volume status
- ✅ Correct: VWVI signal + volume confirmation = more reliable signal
3. **Mistake 3: Overtrading**
- ❌ Wrong: Trading every color change
- ✅ Correct: Wait for clear state transition signals
4. **Mistake 4: Fixed thresholds**
- ❌ Wrong: Using 60/40 thresholds for all markets
- ✅ Correct: Adjust parameters for different products
5. **Mistake 5: Ignoring background information**
- ❌ Wrong: Not considering market environment and fundamentals
- ✅ Correct: Combine with market cycles and important events
### **⚡ Special Situation Handling**
```
🚨 Abnormal signal identification:
- VWVI spikes sharply >80: May indicate sudden events
- VWVI remains <20 long-term: Extreme market contraction
- Frequent oscillation near thresholds: Market indecision
- Volume-VWVI divergence: Requires caution
🎯 Optimal usage environment:
✅ Suitable: Actively traded mainstream products
✅ Suitable: Markets with sufficient historical data
✅ Suitable: Exchanges with accurate volume data
❌ Not suitable: Extremely low liquidity products
❌ Not suitable: Heavily manipulated small coins
❌ Not suitable: Newly listed products (insufficient data)
```
### **🔧 Parameter Optimization Suggestions**
```
📊 Parameter suggestions for different markets:
- BTC/ETH major coins: Keep default 14/60/40
- Altcoins: Can adjust to 10/65/35 (more sensitive)
- Stock market: Can adjust to 20/55/45 (more stable)
- Forex market: Can adjust to 21/58/42 (follow tradition)
⏱️ Different timeframes:
- 1-minute: Not recommended (too noisy)
- 5-15 minutes: Short-term trading, can adjust sensitivity
- 1-4 hours: Medium-term trading, keep defaults
- Daily: Long-term analysis, can be more conservative
```
**Summary: VWVI is a powerful market state identification tool, but requires correct understanding of its meaning, combination with other analysis methods, and avoidance of overtrading to maximize effectiveness.**
# 📊 VWVI指标完全使用指南(当前版本)
## 🔍 **一、指标核心原理**
### **VWVI的独特价值**
VWVI不是简单的波动率指标,而是**成交量确认的波动强度指标**:
- **传统波动率指标问题**:ATR、布林带等只看价格波动,忽略了成交量
- **VWVI的优势**:只有伴随大成交量的波动才被认为是"真实波动"
- **核心逻辑**:大资金推动的波动比散户噪音更重要
---
## 🎨 **二、当前版本视觉元素详解**
### **1. 主线颜色系统(最重要的信号)**
```
🟢 绿色主线 (VWVI > 60):
├─ 含义:高波动 + 高成交量 = 真实趋势
├─ 市场状态:单边行情、突破行情、趋势加速
├─ 交易机会:趋势跟随、动量交易
└─ 持续时间:通常持续数个周期
🟠 橙色主线 (40 ≤ VWVI ≤ 60):
├─ 含义:中等波动或成交量不匹配
├─ 市场状态:过渡阶段、方向待定
├─ 交易策略:观望、等待明确信号
└─ 注意:假突破高发区域
🔴 红色主线 (VWVI < 40):
├─ 含义:低波动 + 低成交量 = 震荡整理
├─ 市场状态:横盘、区间震荡、成交萎缩
├─ 交易机会:区间交易、均值回归
└─ 特征:价格在支撑阻力间反复
```
### **2. 参考线系统(辅助判断)**
```
🟢 趋势阈值线 (默认60):
├─ 作用:趋势确认的分水岭
├─ 突破向上:趋势行情开始确认
├─ 跌破向下:趋势减弱或结束
└─ 调整建议:可根据市场特性调整(50-70)
🔴 震荡阈值线 (默认40):
├─ 作用:震荡行情的确认线
├─ 跌破向下:震荡行情确认
├─ 突破向上:震荡可能结束
└─ 调整建议:可根据波动性调整(30-50)
⚫ 中线 (50):
├─ 作用:市场中性参考
├─ 上方:偏向趋势特征
├─ 下方:偏向震荡特征
└─ 意义:长期均衡位置
```
### **3. 背景着色系统(状态识别)**
```
🟢 淡绿色背景:
├─ 触发:VWVI > 趋势阈值
├─ 含义:趋势行情确认期
├─ 交易建议:趋势跟随策略
└─ 风险:趋势末期可能反转
🔴 淡红色背景:
├─ 触发:VWVI < 震荡阈值
├─ 含义:震荡行情确认期
├─ 交易建议:区间交易策略
└─ 机会:寻找支撑阻力位
🟩 绿色背景闪烁:
├─ 触发:VWVI突破趋势阈值瞬间
├─ 含义:趋势信号产生
├─ 行动:考虑建立趋势仓位
└─ 确认:需结合其他指标
🟥 红色背景闪烁:
├─ 触发:VWVI跌破震荡阈值瞬间
├─ 含义:震荡信号产生
├─ 行动:考虑区间交易策略
└─ 确认:观察是否持续
```
### **4. 信息面板(右上角)**
```
📊 实时数据显示:
├─ VWVI数值:当前指标读数
├─ 当前状态:趋势/震荡/中性
├─ 成交量状态:高于/低于20日均值
├─ 波动强度:高波动/低波动
├─ 趋势阈值:当前设置值
└─ 震荡阈值:当前设置值
```
---
## 📈 **三、具体使用方法**
### **A. 趋势跟随策略**
```
🎯 入场时机:
✅ VWVI从下方突破60(绿色背景闪烁)
✅ 主线变为绿色且持续上升
✅ 成交量状态显示"高于均值"
✅ 波动强度显示"高波动"
📍 持仓管理:
- 继续持有:VWVI保持在60以上
- 减仓警告:VWVI开始下降但仍>50
- 止损离场:VWVI跌破50或变为橙色
⚠️ 风险控制:
- 假突破:VWVI突破60后快速回落
- 趋势末期:VWVI在高位震荡
```
### **B. 震荡交易策略**
```
🎯 确认震荡:
✅ VWVI跌破40(红色背景闪烁)
✅ 主线变为红色且在低位徘徊
✅ 成交量状态显示"低于均值"
✅ 波动强度显示"低波动"
📍 操作策略:
- 区间上沿:寻找阻力位做空
- 区间下沿:寻找支撑位做多
- 止损设置:突破区间边界
- 利润目标:区间中轴附近
⚠️ 注意事项:
- 震荡末期可能出现假突破
- 成交量异常放大需警惕变盘
```
### **C. 状态转换策略**
```
🔄 震荡→趋势转换:
- 观察:VWVI从<40上升至40-60区间
- 准备:橙色主线阶段做好准备
- 确认:突破60时考虑入场
- 验证:成交量是否同步放大
🔄 趋势→震荡转换:
- 警告:VWVI从>60下降至40-60区间
- 减仓:橙色主线阶段逐步减仓
- 确认:跌破40时转为震荡策略
- 观察:是否为趋势中的回调
```
---
## ⚠️ **四、使用误区与注意事项**
### **❌ 常见误区**
1. **误区一:单独使用VWVI**
- ❌ 错误:仅凭VWVI做交易决策
- ✅ 正确:结合价格行为、支撑阻力、其他指标
2. **误区二:忽略成交量确认**
- ❌ 错误:只看VWVI数值,不看成交量状态
- ✅ 正确:VWVI信号+成交量确认=更可靠信号
3. **误区三:频繁交易**
- ❌ 错误:每次颜色变化都交易
- ✅ 正确:等待明确的状态转换信号
4. **误区四:固定阈值**
- ❌ 错误:所有市场都用60/40阈值
- ✅ 正确:根据不同品种调整参数
5. **误区五:忽略背景信息**
- ❌ 错误:不看市场环境和基本面
- ✅ 正确:结合市场周期和重要事件
### **⚡ 特殊情况处理**
```
🚨 异常信号识别:
- VWVI急剧飙升>80:可能是突发事件
- VWVI长期<20:市场极度萎缩
- 频繁在阈值附近震荡:市场犹豫不决
- 成交量与VWVI背离:需谨慎对待
🎯 最佳使用环境:
✅ 适用:活跃交易的主流品种
✅ 适用:有足够历史数据的市场
✅ 适用:成交量数据准确的交易所
❌ 不适用:极低流动性品种
❌ 不适用:操纵严重的小币种
❌ 不适用:新上市品种(数据不足)
```
### **🔧 参数调优建议**
```
📊 不同市场的参数建议:
- BTC/ETH主流币:保持默认14/60/40
- 山寨币:可调整为10/65/35(更敏感)
- 股票市场:可调整为20/55/45(更稳定)
- 外汇市场:可调整为21/58/42(跟随传统)
⏱️ 不同时间周期:
- 1分钟:不建议使用(噪音太大)
- 5-15分钟:短线交易,参数可调敏感
- 1-4小时:中线交易,保持默认
- 日线:长线分析,可调保守
```
**总结:VWVI是一个强大的市场状态识别工具,但需要正确理解其含义,结合其他分析方法,避免过度交易,才能发挥最大效用。**

RSI Games 1.2he "RSI Games 1.2" indicator enhances the standard RSI by adding several layers of analysis:
Standard RSI Calculation: It calculates the RSI based on a configurable length (default 14 periods) and a user-selected source (default close price).
RSI Bands: It plots horizontal lines at 70 (red, overbought), 50 (yellow, neutral), and 30 (green, oversold) to easily identify extreme RSI levels.
RSI Smoothing with Moving Averages (MAs) and Bollinger Bands (BBs):
You can apply various types of moving averages (SMA, EMA, SMMA, WMA, VWMA) to smooth the RSI line.
If you choose "SMA + Bollinger Bands," the indicator will also plot Bollinger Bands around the smoothed RSI, providing dynamic overbought/oversold levels based on volatility.
The RSI line itself changes color based on whether it's above (green) or below (red) its smoothing MA.
It also fills the area between the RSI and its smoothing MA, coloring it green when RSI is above and red when below.
Bollinger Band Signals: When Bollinger Bands are enabled, the indicator marks "Buy" signals (green arrow up) when the RSI crosses above the lower Bollinger Band and "Sell" signals (red arrow down) when it crosses below the upper Bollinger Band.
Background Coloring: The background of the indicator pane changes to light green when RSI is below 30 (oversold) and light red when RSI is above 70 (overbought), visually highlighting extreme conditions.
Divergence Detection: This is a key feature. The indicator automatically identifies and labels:
Regular Bullish Divergence: Price makes a lower low, but RSI makes a higher low. This often signals a potential reversal to the upside.
Regular Bearish Divergence: Price makes a higher high, but RSI makes a lower high. This often signals a potential reversal to the downside.
Hidden Bullish Divergence: Price makes a higher low, but RSI makes a lower low. This can indicate a continuation of an uptrend.
Hidden Bearish Divergence: Price makes a lower high, but RSI makes a higher high. This can indicate a continuation of a downtrend.
Divergences are visually marked with labels and can trigger alerts.

Bitcoin Macro Oscillator | [DeV]The Bitcoin Macro Oscillator (BMO) is a sophisticated fundamental indicator designed to provide a comprehensive view of Bitcoin’s market conditions by combining four key on-chain metrics: the Market Value to Realized Value (MVRV) Ratio, Volume-Weighted Average Price (VWAP) Ratio, Cumulative Value-Days Destroyed (CVDD) Ratio, and Sharpe Ratio. These metrics are individually z-scored and weighted according to user-defined preferences, then averaged to produce a single oscillating value, the BMO Z-score. This helps users identify whether Bitcoin is in a bullish (above zero) or bearish (below zero) phase, offering insights into potential market tops, bottoms, and overall trend strength. Inspired and reverse engineered from the BMO of Woonomics, this indicator is enhanced with a customizable moving average.
Market Value to Realized Value (MVRV) Ratio
The MVRV Ratio compares Bitcoin’s current market capitalization (price multiplied by circulating supply) to its realized capitalization (the value of all coins at the price they were last moved on the blockchain). Calculated as MVRV = Market Cap / Realized Cap, it is then z-scored over a user-defined lookback period (default 120 days). This metric tracks whether Bitcoin is overvalued (high MVRV, suggesting a market top) or undervalued (low MVRV, indicating a potential bottom), providing a gauge of investor profitability and market sentiment.
Volume-Weighted Average Price (VWAP) Ratio
The VWAP Ratio measures Bitcoin’s current price against its volume-weighted average price, which is computed by summing the product of price and volume over a lookback period (default 120 days) and dividing by total volume, with a fallback to the current price if volume is zero. The ratio is z-scored to standardize it. This tracks the relationship between price and the average price paid with volume consideration, helping identify overbought or oversold conditions—high values may signal tops, while low values suggest bottoms.
Cumulative Value-Days Destroyed (CVDD) Ratio
The CVDD Ratio is based on the CVDD metric, which estimates the total value of Bitcoin that has been “destroyed” (spent at a loss) over time, approximated here using a longer-term simple moving average (SMA) of the price over twice the lookback period. The ratio is calculated as the current price divided by this CVDD price, then z-scored. It tracks the accumulation of value destruction, with low values indicating bearish exhaustion and high values suggesting bullish momentum.
Sharpe Ratio
The Sharpe Ratio assesses Bitcoin’s risk-adjusted return by comparing the average return (calculated as the natural log of the price change) to its volatility (standard deviation of returns) over a user-defined Sharpe lookback period (default 180 days). If volatility is zero, it defaults to zero to avoid errors. This z-scored value tracks whether Bitcoin’s price movements offer a favorable return for the risk taken—positive values indicate good risk-adjusted performance, while negative values suggest caution.
Together, the MVRV, VWAP, CVDD, and Sharpe Ratio metrics provide a multi-faceted view of Bitcoin’s market health, with each contributing unique insights into valuation, volume, value destruction, and risk-adjusted performance. Their weighted combination into the BMO Z-score balances these inputs to offer a unified signal, enhanced by a customizable moving average (default 90-period EMA) that smooths the Z-score for trend confirmation—rising when bullish, falling when bearish. Credit to Woonomics for inspiring this robust framework, which adapts their BMO concept into a flexible, user-tailored tool.

Gap Open DetectorIndicator Note: Gap Open Detector
What This Indicator Does
This indicator helps you spot significant price gaps at the start of new candles compared to the previous candle’s close. A gap means the current candle’s opening price is noticeably higher or lower than the previous candle’s closing price.
Gap Up: The new candle opens above the previous candle’s close.
Gap Down: The new candle opens below the previous candle’s close.
The indicator highlights these gaps with colored candles:
Green Candle: Gap Up detected.
Red Candle: Gap Down detected.
How to Use the Indicator:
This indicator gives Best Results on Hourly Candles:
This indicator works best on hourly charts (1-hour time frame). It is especially useful for spotting gaps at the start of the next day or after a significant break in trading.
Wait for Confirmation:
After a gap is detected at the open, wait for the candle to form. Ideally, wait for one hour (until the hourly candle is complete) to confirm the candle’s direction and strength before taking any action.
Customize Gap Size:
You can set the minimum gap size using either points or percentage:
Points: Enter the minimum number of points for a gap to be considered significant.
Percentage: Enter the minimum percentage change for a gap to be considered significant.
This flexibility allows you to adjust the indicator to suit different markets and volatility levels.
Trading Logic
If there is a Gap Up and the one hour candle is green:
Buy Option: Consider initiating a buy (long) position.
If there is a Gap Up but the one hour candle is red:
Sell Option: Consider initiating a sell (short) position.
If there is a Gap Down and the one hour closing candle is red:
Sell Option: Consider initiating a sell (short) position.
If there is a Gap Down but the one hour candle is green:
Buy Option: Consider initiating a buy (long) position.
Important Tips
1. Patience Pays: Always wait for the hourly candle to close before making any trading decisions based on the gap.
2. Next Day Open: This strategy is especially effective for catching gaps at the start of a new trading day or after a market break.
3. Visual Cues: The indicator gives you a simple visual cue to spot potential trading opportunities.
4. Flexible Settings: Set your preferred gap size in points or percentage to match your trading style.

Trend Gauge [BullByte]Trend Gauge
Summary
A multi-factor trend detection indicator that aggregates EMA alignment, VWMA momentum scaling, volume spikes, ATR breakout strength, higher-timeframe confirmation, ADX-based regime filtering, and RSI pivot-divergence penalty into one normalized trend score. It also provides a confidence meter, a Δ Score momentum histogram, divergence highlights, and a compact, scalable dashboard for at-a-glance status.
________________________________________
## 1. Purpose of the Indicator
Why this was built
Traders often monitor several indicators in parallel - EMAs, volume signals, volatility breakouts, higher-timeframe trends, ADX readings, divergence alerts, etc., which can be cumbersome and sometimes contradictory. The “Trend Gauge” indicator was created to consolidate these complementary checks into a single, normalized score that reflects the prevailing market bias (bullish, bearish, or neutral) and its strength. By combining multiple inputs with an adaptive regime filter, scaling contributions by magnitude, and penalizing weakening signals (divergence), this tool aims to reduce noise, highlight genuine trend opportunities, and warn when momentum fades.
Key Design Goals
Signal Aggregation
Merged trend-following signals (EMA crossover, ATR breakout, higher-timeframe confirmation) and momentum signals (VWMA thrust, volume spikes) into a unified score that reflects directional bias more holistically.
Market Regime Awareness
Implemented an ADX-style filter to distinguish between trending and ranging markets, reducing the influence of trend signals during sideways phases to avoid false breakouts.
Magnitude-Based Scaling
Replaced binary contributions with scaled inputs: VWMA thrust and ATR breakout are weighted relative to recent averages, allowing for more nuanced score adjustments based on signal strength.
Momentum Divergence Penalty
Integrated pivot-based RSI divergence detection to slightly reduce the overall score when early signs of momentum weakening are detected, improving risk-awareness in entries.
Confidence Transparency
Added a live confidence metric that shows what percentage of enabled sub-indicators currently agree with the overall bias, making the scoring system more interpretable.
Momentum Acceleration Visualization
Plotted the change in score (Δ Score) as a histogram bar-to-bar, highlighting whether momentum is increasing, flattening, or reversing, aiding in more timely decision-making.
Compact Informational Dashboard
Presented a clean, scalable dashboard that displays each component’s status, the final score, confidence %, detected regime (Trending/Ranging), and a labeled strength gauge for quick visual assessment.
________________________________________
## 2. Why a Trader Should Use It
Main benefits and use cases
1. Unified View: Rather than juggling multiple windows or panels, this indicator delivers a single score synthesizing diverse signals.
2. Regime Filtering: In ranging markets, trend signals often generate false entries. The ADX-based regime filter automatically down-weights trend-following components, helping you avoid chasing false breakouts.
3. Nuanced Momentum & Volatility: VWMA and ATR breakout contributions are normalized by recent averages, so strong moves register strongly while smaller fluctuations are de-emphasized.
4. Early Warning of Weakening: Pivot-based RSI divergence is detected and used to slightly reduce the score when price/momentum diverges, giving a cautionary signal before a full reversal.
5. Confidence Meter: See at a glance how many sub-indicators align with the aggregated bias (e.g., “80% confidence” means 4 out of 5 components agree ). This transparency avoids black-box decisions.
6. Trend Acceleration/Deceleration View: The Δ Score histogram visualizes whether the aggregated score is rising (accelerating trend) or falling (momentum fading), supplementing the main oscillator.
7. Compact Dashboard: A corner table lists each check’s status (“Bull”, “Bear”, “Flat” or “Disabled”), plus overall Score, Confidence %, Regime, Trend Strength label, and a gauge bar. Users can scale text size (Normal, Small, Tiny) without removing elements, so the full picture remains visible even in compact layouts.
8. Customizable & Transparent: All components can be enabled/disabled and parameterized (lengths, thresholds, weights). The full Pine code is open and well-commented, letting users inspect or adapt the logic.
9. Alert-ready: Built-in alert conditions fire when the score crosses weak thresholds to bullish/bearish or returns to neutral, enabling timely notifications.
________________________________________
## 3. Component Rationale (“Why These Specific Indicators?”)
Each sub-component was chosen because it adds complementary information about trend or momentum:
1. EMA Cross
o Basic trend measure: compares a faster EMA vs. a slower EMA. Quickly reflects trend shifts but by itself can whipsaw in sideways markets.
2. VWMA Momentum
o Volume-weighted moving average change indicates momentum with volume context. By normalizing (dividing by a recent average absolute change), we capture the strength of momentum relative to recent history. This scaling prevents tiny moves from dominating and highlights genuinely strong momentum.
3. Volume Spikes
o Sudden jumps in volume combined with price movement often accompany stronger moves or reversals. A binary detection (+1 for bullish spike, -1 for bearish spike) flags high-conviction bars.
4. ATR Breakout
o Detects price breaking beyond recent highs/lows by a multiple of ATR. Measures breakout strength by how far beyond the threshold price moves relative to ATR, capped to avoid extreme outliers. This gives a volatility-contextual trend signal.
5. Higher-Timeframe EMA Alignment
o Confirms whether the shorter-term trend aligns with a higher timeframe trend. Uses request.security with lookahead_off to avoid future data. When multiple timeframes agree, confidence in direction increases.
6. ADX Regime Filter (Manual Calculation)
o Computes directional movement (+DM/–DM), smoothes via RMA, computes DI+ and DI–, then a DX and ADX-like value. If ADX ≥ threshold, market is “Trending” and trend components carry full weight; if ADX < threshold, “Ranging” mode applies a configurable weight multiplier (e.g., 0.5) to trend-based contributions, reducing false signals in sideways conditions. Volume spikes remain binary (optional behavior; can be adjusted if desired).
7. RSI Pivot-Divergence Penalty
o Uses ta.pivothigh / ta.pivotlow with a lookback to detect pivot highs/lows on price and corresponding RSI values. When price makes a higher high but RSI makes a lower high (bearish divergence), or price makes a lower low but RSI makes a higher low (bullish divergence), a divergence signal is set. Rather than flipping the trend outright, the indicator subtracts (or adds) a small penalty (configurable) from the aggregated score if it would weaken the current bias. This subtle adjustment warns of weakening momentum without overreacting to noise.
8. Confidence Meter
o Counts how many enabled components currently agree in direction with the aggregated score (i.e., component sign × score sign > 0). Displays this as a percentage. A high percentage indicates strong corroboration; a low percentage warns of mixed signals.
9. Δ Score Momentum View
o Plots the bar-to-bar change in the aggregated score (delta_score = score - score ) as a histogram. When positive, bars are drawn in green above zero; when negative, bars are drawn in red below zero. This reveals acceleration (rising Δ) or deceleration (falling Δ), supplementing the main oscillator.
10. Dashboard
• A table in the indicator pane’s top-right with 11 rows:
1. EMA Cross status
2. VWMA Momentum status
3. Volume Spike status
4. ATR Breakout status
5. Higher-Timeframe Trend status
6. Score (numeric)
7. Confidence %
8. Regime (“Trending” or “Ranging”)
9. Trend Strength label (e.g., “Weak Bullish Trend”, “Strong Bearish Trend”)
10. Gauge bar visually representing score magnitude
• All rows always present; size_opt (Normal, Small, Tiny) only changes text size via text_size, not which elements appear. This ensures full transparency.
________________________________________
## 4. What Makes This Indicator Stand Out
• Regime-Weighted Multi-Factor Score: Trend and momentum signals are adaptively weighted by market regime (trending vs. ranging) , reducing false signals.
• Magnitude Scaling: VWMA and ATR breakout contributions are normalized by recent average momentum or ATR, giving finer gradation compared to simple ±1.
• Integrated Divergence Penalty: Divergence directly adjusts the aggregated score rather than appearing as a separate subplot; this influences alerts and trend labeling in real time.
• Confidence Meter: Shows the percentage of sub-signals in agreement, providing transparency and preventing blind trust in a single metric.
• Δ Score Histogram Momentum View: A histogram highlights acceleration or deceleration of the aggregated trend score, helping detect shifts early.
• Flexible Dashboard: Always-visible component statuses and summary metrics in one place; text size scaling keeps the full picture available in cramped layouts.
• Lookahead-Safe HTF Confirmation: Uses lookahead_off so no future data is accessed from higher timeframes, avoiding repaint bias.
• Repaint Transparency: Divergence detection uses pivot functions that inherently confirm only after lookback bars; description documents this lag so users understand how and when divergence labels appear.
• Open-Source & Educational: Full, well-commented Pine v6 code is provided; users can learn from its structure: manual ADX computation, conditional plotting with series = show ? value : na, efficient use of table.new in barstate.islast, and grouped inputs with tooltips.
• Compliance-Conscious: All plots have descriptive titles; inputs use clear names; no unnamed generic “Plot” entries; manual ADX uses RMA; all request.security calls use lookahead_off. Code comments mention repaint behavior and limitations.
________________________________________
## 5. Recommended Timeframes & Tuning
• Any Timeframe: The indicator works on small (e.g., 1m) to large (daily, weekly) timeframes. However:
o On very low timeframes (<1m or tick charts), noise may produce frequent whipsaws. Consider increasing smoothing lengths, disabling certain components (e.g., volume spike if volume data noisy), or using a larger pivot lookback for divergence.
o On higher timeframes (daily, weekly), consider longer lookbacks for ATR breakout or divergence, and set Higher-Timeframe trend appropriately (e.g., 4H HTF when on 5 Min chart).
• Defaults & Experimentation: Default input values are chosen to be balanced for many liquid markets. Users should test with replay or historical analysis on their symbol/timeframe and adjust:
o ADX threshold (e.g., 20–30) based on instrument volatility.
o VWMA and ATR scaling lengths to match average volatility cycles.
o Pivot lookback for divergence: shorter for faster markets, longer for slower ones.
• Combining with Other Analysis: Use in conjunction with price action, support/resistance, candlestick patterns, order flow, or other tools as desired. The aggregated score and alerts can guide attention but should not be the sole decision-factor.
________________________________________
## 6. How Scoring and Logic Works (Step-by-Step)
1. Compute Sub-Scores
o EMA Cross: Evaluate fast EMA > slow EMA ? +1 : fast EMA < slow EMA ? -1 : 0.
o VWMA Momentum: Calculate vwma = ta.vwma(close, length), then vwma_mom = vwma - vwma . Normalize: divide by recent average absolute momentum (e.g., ta.sma(abs(vwma_mom), lookback)), clip to .
o Volume Spike: Compute vol_SMA = ta.sma(volume, len). If volume > vol_SMA * multiplier AND price moved up ≥ threshold%, assign +1; if moved down ≥ threshold%, assign -1; else 0.
o ATR Breakout: Determine recent high/low over lookback. If close > high + ATR*mult, compute distance = close - (high + ATR*mult), normalize by ATR, cap at a configured maximum. Assign positive contribution. Similarly for bearish breakout below low.
o Higher-Timeframe Trend: Use request.security(..., lookahead=barmerge.lookahead_off) to fetch HTF EMAs; assign +1 or -1 based on alignment.
2. ADX Regime Weighting
o Compute manual ADX: directional movements (+DM, –DM), smoothed via RMA, DI+ and DI–, then DX and ADX via RMA. If ADX ≥ threshold, market is considered “Trending”; otherwise “Ranging.”
o If trending, trend-based contributions (EMA, VWMA, ATR, HTF) use full weight = 1.0. If ranging, use weight = ranging_weight (e.g., 0.5) to down-weight them. Volume spike stays binary ±1 (optional to change if desired).
3. Aggregate Raw Score
o Sum weighted contributions of all enabled components. Count the number of enabled components; if zero, default count = 1 to avoid division by zero.
4. Divergence Penalty
o Detect pivot highs/lows on price and corresponding RSI values, using a lookback. When price and RSI diverge (bearish or bullish divergence), check if current raw score is in the opposing direction:
If bearish divergence (price higher high, RSI lower high) and raw score currently positive, subtract a penalty (e.g., 0.5).
If bullish divergence (price lower low, RSI higher low) and raw score currently negative, add a penalty.
o This reduces score magnitude to reflect weakening momentum, without flipping the trend outright.
5. Normalize and Smooth
o Normalized score = (raw_score / number_of_enabled_components) * 100. This yields a roughly range.
o Optional EMA smoothing of this normalized score to reduce noise.
6. Interpretation
o Sign: >0 = net bullish bias; <0 = net bearish bias; near zero = neutral.
o Magnitude Zones: Compare |score| to thresholds (Weak, Medium, Strong) to label trend strength (e.g., “Weak Bullish Trend”, “Medium Bearish Trend”, “Strong Bullish Trend”).
o Δ Score Histogram: The histogram bars from zero show change from previous bar’s score; positive bars indicate acceleration, negative bars indicate deceleration.
o Confidence: Percentage of sub-indicators aligned with the score’s sign.
o Regime: Indicates whether trend-based signals are fully weighted or down-weighted.
________________________________________
## 7. Oscillator Plot & Visualization: How to Read It
Main Score Line & Area
The oscillator plots the aggregated score as a line, with colored fill: green above zero for bullish area, red below zero for bearish area. Horizontal reference lines at ±Weak, ±Medium, and ±Strong thresholds mark zones: crossing above +Weak suggests beginning of bullish bias, above +Medium for moderate strength, above +Strong for strong trend; similarly for bearish below negative thresholds.
Δ Score Histogram
If enabled, a histogram shows score - score . When positive, bars appear in green above zero, indicating accelerating bullish momentum; when negative, bars appear in red below zero, indicating decelerating or reversing momentum. The height of each bar reflects the magnitude of change in the aggregated score from the prior bar.
Divergence Highlight Fill
If enabled, when a pivot-based divergence is confirmed:
• Bullish Divergence : fill the area below zero down to –Weak threshold in green, signaling potential reversal from bearish to bullish.
• Bearish Divergence : fill the area above zero up to +Weak threshold in red, signaling potential reversal from bullish to bearish.
These fills appear with a lag equal to pivot lookback (the number of bars needed to confirm the pivot). They do not repaint after confirmation, but users must understand this lag.
Trend Direction Label
When score crosses above or below the Weak threshold, a small label appears near the score line reading “Bullish” or “Bearish.” If the score returns within ±Weak, the label “Neutral” appears. This helps quickly identify shifts at the moment they occur.
Dashboard Panel
In the indicator pane’s top-right, a table shows:
1. EMA Cross status: “Bull”, “Bear”, “Flat”, or “Disabled”
2. VWMA Momentum status: similarly
3. Volume Spike status: “Bull”, “Bear”, “No”, or “Disabled”
4. ATR Breakout status: “Bull”, “Bear”, “No”, or “Disabled”
5. Higher-Timeframe Trend status: “Bull”, “Bear”, “Flat”, or “Disabled”
6. Score: numeric value (rounded)
7. Confidence: e.g., “80%” (colored: green for high, amber for medium, red for low)
8. Regime: “Trending” or “Ranging” (colored accordingly)
9. Trend Strength: textual label based on magnitude (e.g., “Medium Bullish Trend”)
10. Gauge: a bar of blocks representing |score|/100
All rows remain visible at all times; changing Dashboard Size only scales text size (Normal, Small, Tiny).
________________________________________
## 8. Example Usage (Illustrative Scenario)
Example: BTCUSD 5 Min
1. Setup: Add “Trend Gauge ” to your BTCUSD 5 Min chart. Defaults: EMAs (8/21), VWMA 14 with lookback 3, volume spike settings, ATR breakout 14/5, HTF = 5m (or adjust to 4H if preferred), ADX threshold 25, ranging weight 0.5, divergence RSI length 14 pivot lookback 5, penalty 0.5, smoothing length 3, thresholds Weak=20, Medium=50, Strong=80. Dashboard Size = Small.
2. Trend Onset: At some point, price breaks above recent high by ATR multiple, volume spikes upward, faster EMA crosses above slower EMA, HTF EMA also bullish, and ADX (manual) ≥ threshold → aggregated score rises above +20 (Weak threshold) into +Medium zone. Dashboard shows “Bull” for EMA, VWMA, Vol Spike, ATR, HTF; Score ~+60–+70; Confidence ~100%; Regime “Trending”; Trend Strength “Medium Bullish Trend”; Gauge ~6–7 blocks. Δ Score histogram bars are green and rising, indicating accelerating bullish momentum. Trader notes the alignment.
3. Divergence Warning: Later, price makes a slightly higher high but RSI fails to confirm (lower RSI high). Pivot lookback completes; the indicator highlights a bearish divergence fill above zero and subtracts a small penalty from the score, causing score to stall or retrace slightly. Dashboard still bullish but score dips toward +Weak. This warns the trader to tighten stops or take partial profits.
4. Trend Weakens: Score eventually crosses below +Weak back into neutral; a “Neutral” label appears, and a “Neutral Trend” alert fires if enabled. Trader exits or avoids new long entries. If score subsequently crosses below –Weak, a “Bearish” label and alert occur.
5. Customization: If the trader finds VWMA noise too frequent on this instrument, they may disable VWMA or increase lookback. If ATR breakouts are too rare, adjust ATR length or multiplier. If ADX threshold seems off, tune threshold. All these adjustments are explained in Inputs section.
6. Visualization: The screenshot shows the main score oscillator with colored areas, reference lines at ±20/50/80, Δ Score histogram bars below/above zero, divergence fill highlighting potential reversal, and the dashboard table in the top-right.
________________________________________
## 9. Inputs Explanation
A concise yet clear summary of inputs helps users understand and adjust:
1. General Settings
• Theme (Dark/Light): Choose background-appropriate colors for the indicator pane.
• Dashboard Size (Normal/Small/Tiny): Scales text size only; all dashboard elements remain visible.
2. Indicator Settings
• Enable EMA Cross: Toggle on/off basic EMA alignment check.
o Fast EMA Length and Slow EMA Length: Periods for EMAs.
• Enable VWMA Momentum: Toggle VWMA momentum check.
o VWMA Length: Period for VWMA.
o VWMA Momentum Lookback: Bars to compare VWMA to measure momentum.
• Enable Volume Spike: Toggle volume spike detection.
o Volume SMA Length: Period to compute average volume.
o Volume Spike Multiplier: How many times above average volume qualifies as spike.
o Min Price Move (%): Minimum percent change in price during spike to qualify as bullish or bearish.
• Enable ATR Breakout: Toggle ATR breakout detection.
o ATR Length: Period for ATR.
o Breakout Lookback: Bars to look back for recent highs/lows.
o ATR Multiplier: Multiplier for breakout threshold.
• Enable Higher Timeframe Trend: Toggle HTF EMA alignment.
o Higher Timeframe: E.g., “5” for 5-minute when on 1-minute chart, or “60” for 5 Min when on 15m, etc. Uses lookahead_off.
• Enable ADX Regime Filter: Toggles regime-based weighting.
o ADX Length: Period for manual ADX calculation.
o ADX Threshold: Value above which market considered trending.
o Ranging Weight Multiplier: Weight applied to trend components when ADX < threshold (e.g., 0.5).
• Scale VWMA Momentum: Toggle normalization of VWMA momentum magnitude.
o VWMA Mom Scale Lookback: Period for average absolute VWMA momentum.
• Scale ATR Breakout Strength: Toggle normalization of breakout distance by ATR.
o ATR Scale Cap: Maximum multiple of ATR used for breakout strength.
• Enable Price-RSI Divergence: Toggle divergence detection.
o RSI Length for Divergence: Period for RSI.
o Pivot Lookback for Divergence: Bars on each side to identify pivot high/low.
o Divergence Penalty: Amount to subtract/add to score when divergence detected (e.g., 0.5).
3. Score Settings
• Smooth Score: Toggle EMA smoothing of normalized score.
• Score Smoothing Length: Period for smoothing EMA.
• Weak Threshold: Absolute score value under which trend is considered weak or neutral.
• Medium Threshold: Score above Weak but below Medium is moderate.
• Strong Threshold: Score above this indicates strong trend.
4. Visualization Settings
• Show Δ Score Histogram: Toggle display of the bar-to-bar change in score as a histogram. Default true.
• Show Divergence Fill: Toggle background fill highlighting confirmed divergences. Default true.
Each input has a tooltip in the code.
________________________________________
## 10. Limitations, Repaint Notes, and Disclaimers
10.1. Repaint & Lag Considerations
• Pivot-Based Divergence Lag: The divergence detection uses ta.pivothigh / ta.pivotlow with a specified lookback. By design, a pivot is only confirmed after the lookback number of bars. As a result:
o Divergence labels or fills appear with a delay equal to the pivot lookback.
o Once the pivot is confirmed and the divergence is detected, the fill/label does not repaint thereafter, but you must understand and accept this lag.
o Users should not treat divergence highlights as predictive signals without additional confirmation, because they appear after the pivot has fully formed.
• Higher-Timeframe EMA Alignment: Uses request.security(..., lookahead=barmerge.lookahead_off), so no future data from the higher timeframe is used. This avoids lookahead bias and ensures signals are based only on completed higher-timeframe bars.
• No Future Data: All calculations are designed to avoid using future information. For example, manual ADX uses RMA on past data; security calls use lookahead_off.
10.2. Market & Noise Considerations
• In very choppy or low-liquidity markets, some components (e.g., volume spikes or VWMA momentum) may be noisy. Users can disable or adjust those components’ parameters.
• On extremely low timeframes, noise may dominate; consider smoothing lengths or disabling certain features.
• On very high timeframes, pivots and breakouts occur less frequently; adjust lookbacks accordingly to avoid sparse signals.
10.3. Not a Standalone Trading System
• This is an indicator, not a complete trading strategy. It provides signals and context but does not manage entries, exits, position sizing, or risk management.
• Users must combine it with their own analysis, money management, and confirmations (e.g., price patterns, support/resistance, fundamental context).
• No guarantees: past behavior does not guarantee future performance.
10.4. Disclaimers
• Educational Purposes Only: The script is provided as-is for educational and informational purposes. It does not constitute financial, investment, or trading advice.
• Use at Your Own Risk: Trading involves risk of loss. Users should thoroughly test and use proper risk management.
• No Guarantees: The author is not responsible for trading outcomes based on this indicator.
• License: Published under Mozilla Public License 2.0; code is open for viewing and modification under MPL terms.
________________________________________
## 11. Alerts
• The indicator defines three alert conditions:
1. Bullish Trend: when the aggregated score crosses above the Weak threshold.
2. Bearish Trend: when the score crosses below the negative Weak threshold.
3. Neutral Trend: when the score returns within ±Weak after being outside.
Good luck
– BullByte

Gorgo's Hybrid Oscillator STrategy**Indicator Name:** Gorgo's Hybrid Oscillator STrategy (G.H.O.S.T.)
**Purpose:**
The Gorgo's Hybrid Oscillator STrategy (G.H.O.S.T.) is a multi-component technical analysis tool designed to identify overbought and oversold market conditions, assess trend strength, and signal potential buy and sell opportunities. By combining elements from RSI, Ultimate Oscillator, Stochastic CCI, and ADX, this custom indicator provides a comprehensive view of momentum, trend intensity, and volume context to enhance decision-making.
---
**Components and Logic:**
1. **RSI (Relative Strength Index):**
* Calculated using a customizable period (default: 14) and based on the hlc3 price source.
* Measures recent price changes to evaluate overbought/oversold conditions.
* Incorporated in the final oscillator average.
2. **Ultimate Oscillator:**
* Combines three timeframes (7, 14, 28 by default) to smooth out price movements.
* Uses true range and buying pressure for multi-frame momentum analysis.
* Averaged together with RSI to create the main oscillator signal.
3. **Stochastic CCI:**
* Applies a stochastic process to the Commodity Channel Index (CCI).
* Smooths the %K and %D lines (default: 3 each) to detect subtle reversals.
* Generates oversold (<35) and overbought (>69) signals, plotted as yellow circles.
4. **ADX + DI (Average Directional Index):**
* Determines trend strength using ADX and directional movement indicators (DI).
* ADX threshold is set at 24 by default to filter weak trends.
* Colored histogram columns:
* Green: Strong bullish trend.
* Red: Strong bearish trend.
* Gray: Weak/no trend.
5. **Volume Analysis:**
* Calculates a 9-period SMA of volume.
* Detects significant volume spikes (2.7× the average by default) to validate breakouts or fakeouts.
6. **Oscillator Output ("osc") and Levels:**
* The main plotted oscillator line is the average of the RSI and Ultimate Oscillator.
* Important horizontal lines:
* Overbought (69.0)
* Oversold (35.0)
* Midline (52.0): Neutral reference point.
* ADX threshold line (24.0)
---
**Signals:**
1. **Buy Signal Conditions:**
* Close is less than or equal to open (candle is red).
* Oscillator is decreasing and below oversold level.
* Stochastic CCI is below midline.
* Volume is above average, or excessive volume with oscillator falling below 40.
* ADX confirms trend presence (either above 15 or meeting threshold).
2. **Sell Signal Conditions:**
* ADX increasing and confirming trend.
* Oscillator is increasing and above overbought level.
* Stochastic CCI is above midline.
* Volume is above average, or very high with oscillator above 60.
3. **Visual Feedback:**
* Yellow dots highlight oversold/overbought Stochastic CCI.
* Oscillator line in cyan.
* Background colors:
* Light red for buy signals.
* White for sell signals.
4. **Alerts:**
* Built-in `alertcondition()` calls allow automated alerts for buy and sell events.
---
**Usage Guide:**
* **Best Use Cases:** Trend-following and reversal strategies on any timeframe.
* **Avoid Using Alone:** Use G.H.O.S.T. in conjunction with price action, support/resistance, and other confluence tools.
* **Customization:** All thresholds, periods, and volumes are user-editable from the settings panel.
---
**Interpretation Summary:**
G.H.O.S.T. excels at filtering out noise by combining different oscillators and volume signals to offer contextually valid entries and exits. A bullish (buy) signal typically suggests a market under pressure but potentially bottoming out, while a bearish (sell) signal highlights likely exhaustion after a strong upward push.
This hybrid approach makes the G.H.O.S.T. a reliable ally in volatile or choppy conditions where single-indicator strategies might fail.

Volumetric Expansion/Contraction### Indicator Title: Volumetric Expansion/Contraction
### Summary
The Volumetric Expansion/Contraction (PCC) indicator is a comprehensive momentum oscillator designed to identify high-conviction price moves. Unlike traditional oscillators that only look at price, the PCC integrates four critical dimensions of market activity: **Price Change**, **Relative Volume (RVOL)**, **Cumulative Volume Delta (CVD)**, and **Average True Range (ATR)**.
Its primary purpose is to help traders distinguish between meaningful, volume-backed market expansions and noisy, unsustainable price action. It gives more weight to moves that occur in a controlled, low-volatility environment, highlighting potential starts of new trends or significant shifts in market sentiment.
### Key Concepts & Purpose
The indicator's unique formula synthesizes the following concepts:
1. **Price Change:** Measures the magnitude and direction of the primary move.
2. **Relative Volume (RVOL):** Confirms that the move is backed by significant volume compared to its recent average, indicating institutional participation.
3. **Cumulative Volume Delta (CVD):** Measures the underlying buying and selling pressure, confirming that the price move is aligned with the net flow of market orders.
4. **Inverse Volatility (ATR):** This is the indicator's unique twist. It normalizes the signal by the inverse of the Average True Range. This means the indicator's value is **amplified** when volatility (ATR) is low (signifying a controlled, confident expansion) and **dampened** when volatility is high (filtering out chaotic, less predictable moves).
The goal is to provide a single, easy-to-read oscillator that signals when price, volume, and order flow are all in alignment, especially during a breakout from a period of contraction.
### Features
* **Main Oscillator Line:** A single line plotted in a separate pane that represents the calculated strength of the volumetric expansion or contraction.
* **Zero Line:** A dotted reference line to easily distinguish between bullish (above zero) and bearish (below zero) regimes.
* **Visual Threshold Zones:** The background automatically changes color to highlight periods of significant strength:
* **Bright Green:** Indicates a "Strong Up Move" when the oscillator crosses above the user-defined upper threshold.
* **Bright Fuchsia:** Indicates a "Strong Down Move" when the oscillator crosses below the user-defined lower threshold.
### Configurable Settings & Filters
The indicator is fully customizable to allow for extensive testing and adaptation to different assets and timeframes.
#### Main Calculation Inputs
* **Price Change Lookback:** Sets the period for calculating the primary price change.
* **CVD Normalization Length:** The lookback period for normalizing the Cumulative Volume Delta.
* **RVOL Avg Volume Length:** The lookback for the simple moving average of volume, used to calculate RVOL.
* **RVOL Normalization Length:** The lookback period for normalizing the RVOL score.
* **ATR Length & Normalization Length:** Sets the periods for calculating the ATR and its longer-term average for normalization.
#### Weights
* Fine-tune the impact of each core component on the final calculation, allowing you to emphasize what matters most to your strategy (e.g., give more weight to CVD or RVOL).
#### External Market Filter (Powerful Feature)
* **Enable SPY/QQQ Filter for Up Moves?:** A checkbox to activate a powerful regime filter.
* **Symbol:** A dropdown to choose whether to filter signals based on the trend of **SPY** or **QQQ**.
* **SMA Period:** Sets the lookback period for the Simple Moving Average (default is 50).
* **How it works:** When enabled, this filter will **only allow "Strong Up Move" signals to appear if the chosen symbol (SPY or QQQ) is currently trading above its specified SMA**. This is an excellent tool for aligning your signals with the broader market trend and avoiding bullish entries in a bearish market.
#### Visuals
* **Upper/Lower Threshold:** Allows you to define what level the oscillator must cross to trigger the colored background zones, letting you customize the indicator's sensitivity.
***
**Disclaimer:** This tool is designed for market analysis and confluence. It is not a standalone trading system. Always use this indicator in conjunction with your own trading strategy, risk management, and other forms of analysis.

Ultimate Williams %RUltimate Williams %R
The most advanced Williams %R indicator available - featuring multi-timeframe analysis, zero-lag processing, volatility adaptivity, and intelligent extreme zone detection.
Key Improvements Over Standard Williams %R
Multi-Timeframe: Combines short, medium, and long-term Williams %R calculations with Ultimate Oscillator-style weighting for superior signal quality
Zero-Lag Implementation: Utilizes Ehler's Zero-Lag EMA with error correction, eliminating traditional oscillator lag while maintaining smoothness
Volatility Adaptive: Automatically adjusts periods based on ATR volatility analysis for optimal performance in all market conditions
Z-Score Normalization: Provides consistent, statistically-based extreme level detection across different market environments
Perfect For
Overbought/Oversold Identification: Instantly spot extreme market conditions with visual intensity that scales with signal strength
Divergence Analysis: Enhanced responsiveness and smooth operation make divergence patterns clearer and more reliable
Multi-Timeframe Confirmation: Built-in timeframe combination eliminates the need for multiple Williams %R indicators
Entry/Exit Timing: Zero-lag processing provides earlier signals without sacrificing accuracy
Customizable Settings
Timeframe Periods: Adjustable short (7), medium (14), and long (28) periods
Volatility Adaptation: Configurable ATR-based period adjustment
Zero-Lag Processing: Toggle and fine-tune the smoothing system
Z-Score Normalization: Adjustable lookback period for statistical analysis
Extreme Levels: Customizable threshold for extreme signal detection
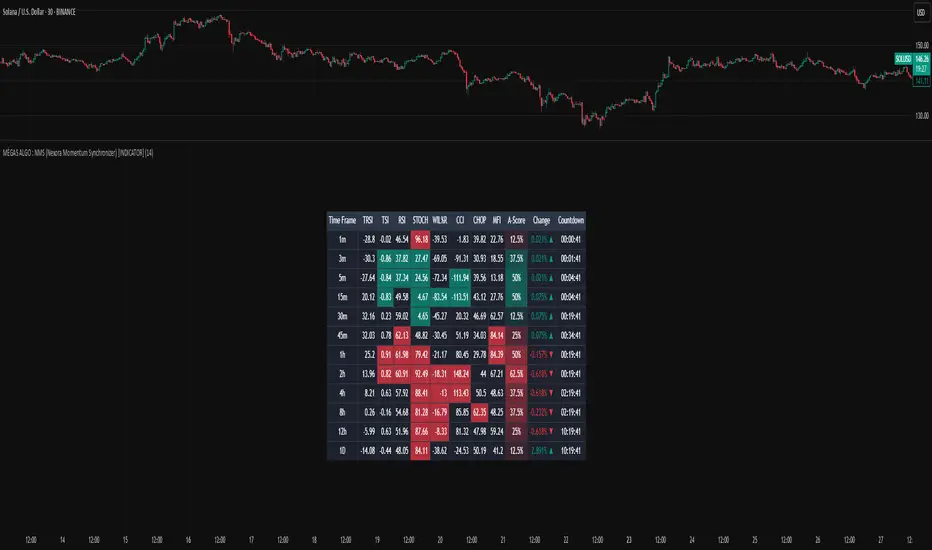
MÈGAS ALGO : NMS (Nexora Momentum Synchronizer) [INDICATOR]Overview
The NMS (Nexora Momentum Synchronizer) is a multi-timeframe indicator that aggregates and analyzes data of multiple momentum oscillators across different timeframes (1m, 5m, 15m, 30m, 45m, 1h, 2h, 4h, 8h, 12h and 24h).
A user-friendly table displaying the indicator’s current values for each timeframe simultaneously.
The script, thanks to the best technical momentum indicators provided by Tradingview, evaluates trend strength and market momentum through synchronized readings of TRSI , TSI , RSI , Stochastic RSI , Williams %R , and CCI.
In addition to the indicator also tracks:
-percentage change in price from the last bar's open across each timeframes
-countdown time to bar close
This indicator caters to the diverse needs of traders, whether they are focused on short-term momentum bursts or long-term trend-following strategies.
By synchronizing momentum indicators, real-time price change(%) from last open and countdow time to close, across multiple timeframes, this tool provides a holistic view of market dynamics, empowering traders to make informed decisions with confidence.
Key Features
1.Multi-Timeframe Momentum Analysis
The Nexora Momentum Synchronizer performs an analysis of key momentum indicator :
—Trend Strength Index (TSI) , True Strength Index (TSI) , Relative Strength Index (RSI) , Stochastic Oscillator (STOCH), Williams Percent Range (W%R) and Commodity Channel Index (CCI) —across multiple timeframes. This ensures traders receive a
comprehensive understanding of momentum alignment, helping them identify high-probability
trade setups with reduced noise and false signals.
In addition to oscillator alignment and regression-based zone detection, the script includes:
-real-time price change(%) from last open for each timeframe, providing insight into intrabar momentum and directional bias.
-real-time countdown to bar close , displayed directly in the table, which enhances timing precision and supports scalping or event-based trading strategies.
These tools combine to offer a comprehensive, real-time framework for both discretionary and alert-driven trading systems.
2.Customizable Parameters
Fully adjustable settings allow traders to tailor the indicator to their specific preferences and
adapt to diverse market conditions. From adjusting overbought and oversold levels to selecting preferred timeframes for alignment alerts, the Nexora Momentum Synchronizer offers unparalleled flexibility to meet individual trading styles.
3.Multi-Timeframe Alerts
Traders can set up alerts for momentum alignment across up to four different timeframes. These alerts ensure that no opportunity is missed, regardless of the trading horizon or strategy being employed.
These alerts can be set up to three different mode : All (to never miss opportunity), Once_for_Bar (to limit to one alert triggered during bar's period) or Bar_Close (to avoid earlier bias).
4.User-Friendly Interface
Designed with simplicity in mind, the Nexora Momentum Synchronizer features an intuitive
table interface that makes complex data easy to interpret. Clear visual cues and
interactive elements allow traders to focus on executing strategies without being
overwhelmed by cluttered charts.
Advantages of Nexora Momentum Synchronizer
Flexibility : Fully customizable parameters ensure the indicator adapts to diverse market
conditions and trader preferences.
Comprehensive Analysis : Multi-timeframe evaluation of momentum indicators provides a
holistic view of market dynamics, enhancing trade confidence.
Real-Time Alerts : Multi-timeframe alert functionality keeps traders informed of critical
market movements and momentum shifts across different horizons.
Please Note:
This indicator is provided for informational and educational purposes only. It is not financial advice, and it should not be considered a recommendation to buy, sell, or trade any financial instrument. Trading involves significant risks, including the potential loss of your entire investment. Always conduct your own research and consult with a licensed financial advisor before making any trading decisions.
The results and images provided are based on algorithms and historical/paid real-time market data but do not guarantee future results or accuracy. Use this tool at your own risk, and understand that past performance is not indicative of future outcomes.
Smarter Money Flow Divergence Detector [PhenLabs]📊 Smarter Money Flow Divergence Detector
Version: PineScript™ v6
📌 Description
SMFD was developed to help give you guys a better ability to “read” what is going on behind the scenes without directly having access to that level of data. SMFD is an enhanced divergence detection indicator that identifies money flow patterns from advanced volume analysis and price action correspondence. The detection portion of this indicator combines intelligent money flow calculations with multi timeframe volume analysis to help you see hidden accumulation and distribution phases before major price movements occur.
The indicator measures institutional trading activity by looking at volume surges, price volume dynamics, and the factors of momentum to construct an overall picture of market sentiment. It’s built to assist traders in identifying high probability entries by identifying if smart money is positioning against price action.
🚀 Points of Innovation
● Advanced Smart Money Flow algorithm with volume spike detection and large trade weighting
● Multi timeframe volume analysis for enhanced institutional activity detection
● Dynamic overbought/oversold zones that adapt to current market conditions
● Enhanced divergence detection with pivot confirmation and strength validation
● Color themes with customizable visual styling options
● Real time institutional bias tracking through accumulation/distribution analysis
🔧 Core Components
● Smart Money Flow Calculation: Combines price momentum, volume expansion, and VWAP analysis
● Institutional Bias Oscillator: Tracks accumulation/distribution patterns with volume pressure analysis
● Enhanced Divergence Engine: Detects bullish/bearish divergences with multiple confirmation factors
● Dynamic Zone Detection: Automatically adjusts overbought/oversold levels based on market volatility
● Volume Pressure Analysis: Measures buying vs selling pressure over configurable periods
● Multi factor Signal System: Generates entries with trend alignment and strength validation
🔥 Key Features
● Smart Money Flow Period: Configurable calculation period for institutional activity detection
● Volume Spike Threshold: Adjustable multiplier for detecting unusual institutional volume
● Large Trade Weight: Emphasis factor for high volume periods in flow calculations
● Pivot Detection: Customizable lookback period for accurate divergence identification
● Signal Sensitivity: Three tier system (Conservative/Medium/Aggressive) for signal generation
● Themes: Four color schemes optimized for different chart backgrounds
🎨 Visualization
● Main Oscillator: Line, Area, or Histogram display styles with dynamic color coding
● Institutional Bias Line: Real time tracking of accumulation/distribution phases
● Dynamic Zones: Adaptive overbought/oversold boundaries with gradient fills
● Divergence Lines: Automatic drawing of bullish/bearish divergence connections
● Entry Signals: Clear BUY/SELL labels with signal strength indicators
● Information Panel: Real time statistics and status updates in customizable positions
📖 Usage Guidelines
Algorithm Settings
● Smart Money Flow Period
○ Default: 20
○ Range: 5-100
○ Description: Controls the calculation period for institutional flow analysis.
Higher values provide smoother signals but reduce responsiveness to recent activity
● Volume Spike Threshold
○ Default: 1.8
○ Range: 1.0-5.0
○ Description: Multiplier for detecting unusual volume activity indicating institutional participation. Higher values require more extreme volume for detection
● Large Trade Weight
○ Default: 2.5
○ Range: 1.5-5.0
○ Description: Weight applied to high volume periods in smart money calculations. Increases emphasis on institutional sized transactions
Divergence Detection
● Pivot Detection Period
○ Default: 12
○ Range: 5-50
○ Description: Bars to analyze for pivot high/low identification.
Affects divergence accuracy and signal frequency
● Minimum Divergence Strength
○ Default: 0.25
○ Range: 0.1-1.0
○ Description: Required price change percentage for valid divergence patterns.
Higher values filter out weaker signals
✅ Best Use Cases
● Trading with intraday to daily timeframes for institutional position identification
● Confirming trend reversals when divergences align with support/resistance levels
● Entry timing in trending markets when institutional bias supports the direction
● Risk management by avoiding trades against strong institutional positioning
● Multi timeframe analysis combining short term signals with longer term bias
⚠️ Limitations
● Requires sufficient volume for accurate institutional detection in low volume markets
● Divergence signals may have false positives during highly volatile news events
● Best performance on liquid markets with consistent institutional participation
● Lagging nature of volume based calculations may delay signal generation
● Effectiveness reduced during low participation holiday periods
💡 What Makes This Unique
● Multi Factor Analysis: Combines volume, price, and momentum for comprehensive institutional detection
● Adaptive Zones: Dynamic overbought/oversold levels that adjust to market conditions
● Volume Intelligence: Advanced algorithms identify institutional sized transactions
● Professional Visualization: Multiple display styles with customizable themes
● Confirmation System: Multiple validation layers reduce false signal generation
🔬 How It Works
1. Volume Analysis Phase:
● Analyzes current volume against historical averages to identify institutional activity
● Applies multi timeframe analysis for enhanced detection accuracy
● Calculates volume pressure through buying vs selling momentum
2. Smart Money Flow Calculation:
● Combines typical price with volume weighted analysis
● Applies institutional trade weighting for high volume periods
● Generates directional flow based on price momentum and volume expansion
3. Divergence Detection Process:
● Identifies pivot highs/lows in both price and indicator values
● Validates divergence strength against minimum threshold requirements
● Confirms signals through multiple technical factors before generation
💡 Note: This indicator works best when combined with proper risk management and position sizing. The institutional bias component helps identify market sentiment shifts, while divergence signals provide specific entry opportunities. For optimal results, use on liquid markets with consistent institutional participation and combine with additional technical analysis methods.

Rolling Z-Score Trend [QuantAlgo]🟢 Overview
The Rolling Z-Score Trend measures how far the current price deviates from its rolling mean in terms of standard deviations. It transforms price data into standardized scores to identify overbought and oversold conditions while tracking momentum shifts.
The indicator displays a Z-Score line showing price deviation from statistical norms, with background momentum columns showing the rate of change in these deviations. This helps traders and investors identify mean reversion opportunities and momentum shifts across different asset classes and timeframes.
🟢 How It Works
The indicator uses the Z-Score formula: Z = (X - μ) / σ, where X is the current closing price, μ is the rolling mean, and σ is the rolling standard deviation over a user-defined lookback period. This creates a dynamic baseline that adapts to changing market conditions and standardizes price movements for interpretation across different assets and volatility conditions. The raw Z-Score undergoes 3-period EMA smoothing to reduce noise while maintaining responsiveness to market signals.
Beyond the basic Z-Score calculation, the indicator measures the rate of change in Z-Score values between successive bars, displayed as background momentum columns. This momentum component shows acceleration and deceleration of statistical deviations. All calculations are processed through confirmation filters, displaying signals only on confirmed bars to reduce premature signals based on incomplete price action.
🟢 How to Use
1. Z-Score Interpretation and Threshold Zones
Positive Values (Above Zero) : Price trading above statistical mean, suggesting bullish momentum or potential overbought conditions
Negative Values (Below Zero) : Price trading below statistical mean, suggesting bearish momentum or potential oversold conditions
Zero Line Crosses : Signal transitions between statistical regimes and potential trend changes
Upper Threshold Zone : Area above entry threshold (default 1.5) indicating potential overbought conditions
Lower Threshold Zone : Area below negative entry threshold (default -1.5) indicating potential oversold conditions
Extreme Values (±2.0 or higher) : Statistically significant deviations that may indicate reversal opportunities
2. Momentum Background Analysis and Info Table
Green Columns : Accelerating positive momentum in Z-Score values
Red Columns : Accelerating negative momentum in Z-Score values
Column Height : Magnitude of momentum change between bars
Momentum Divergence : When columns contradict primary Z-Score direction, often signals impending reversals
Info Table : Displays real-time numerical values for both Z-Score and momentum, including trend direction indicators and bar-to-bar change calculations for position management
3. Preconfigured Settings
Default : Balanced performance across multiple timeframes and asset classes for general trading and medium-term position management.
Scalping : Responsive setup for ultra-short-term trading on 1-15 minute charts with frequent signals and increased sensitivity to quick price movements.
Swing Trading : Optimized for multi-day positions with noise filtering, focusing on larger price swings. Most effective on 1-4 hour and daily timeframes.
Trend Following : Maximum smoothing that prioritizes established trends over short-term volatility. Generates fewer signals for daily and weekly charts.

Adaptive Momentum Deviation Oscillator | QuantMACAdaptive Momentum Deviation Oscillator | QuantMAC 📊
Overview 🎯
The Adaptive Momentum Deviation Oscillator (AMDO) is an advanced technical analysis indicator that combines the power of Bollinger Bands with adaptive momentum calculations to identify optimal entry and exit points in financial markets. This sophisticated oscillator creates dynamic bands that adapt to market volatility while providing clear visual signals for both trending and ranging market conditions.
How It Works 🔧
Core Methodology
The AMDO employs a sophisticated multi-layered approach to market analysis through four distinct phases:
Bollinger Band Foundation : The indicator begins by establishing a volatility baseline using traditional Bollinger Bands. These bands are calculated using a simple moving average as the center line, with upper and lower bands positioned at a specific number of standard deviations away from this centerline. The distance between these bands expands and contracts based on market volatility, creating a dynamic envelope around price action.
BB% Normalization Process : The raw price data is then transformed into a normalized percentage format that represents where the current price sits within the Bollinger Band envelope. When price is at the lower band, this percentage reads 0%; at the upper band, it reads 100%. This normalization allows for consistent comparison across different timeframes and price levels, creating a standardized oscillator that oscillates between extreme values.
Adaptive Momentum Band Construction : The normalized BB% values undergo a secondary volatility analysis where their own standard deviation is calculated over a specified period. This creates "bands around the bands" - upper and lower boundaries that adapt to the volatility of the normalized price position itself. These adaptive bands expand during periods of high momentum volatility and contract during consolidation phases.
Intelligent Signal Synthesis : The final layer combines the adaptive momentum bands with user-defined threshold levels to create a sophisticated trigger system. The indicator monitors when the dynamic bands cross above or below these thresholds, filtering out noise while capturing significant momentum shifts. This creates a dual-confirmation system where both volatility adaptation and threshold breaches must align for signal generation.
Key Components 🛠️
Adaptive Momentum Bands 📈
Dynamic Volatility Response : These bands automatically widen during periods of high momentum volatility and narrow during consolidation phases. Unlike fixed oscillator boundaries, they continuously recalibrate based on recent price behavior within the Bollinger Band framework.
Dual-Layer Calculation : The bands are derived from the volatility of the normalized price position itself, creating a "volatility of volatility" measurement. This provides early warning signals when momentum characteristics are changing, even before price breakouts occur.
State-Aware Visualization : The bands employ intelligent color coding that transitions between active and neutral states based on their interaction with threshold levels. Active states indicate high-probability momentum conditions, while neutral states suggest consolidation or indecision.
Momentum Persistence Tracking : The bands maintain memory of recent momentum characteristics, allowing them to distinguish between genuine momentum shifts and temporary price spikes or dips.
Threshold Levels 🎚️
Statistical Significance Boundaries : The threshold levels (default 83 for long, 40 for short) are positioned to capture statistically significant momentum events while filtering out market noise. These levels represent points where momentum probability shifts meaningfully in favor of directional moves.
Asymmetric Design Philosophy : The intentional asymmetry between long and short thresholds (83 vs 40) reflects the natural upward bias of many financial markets and the different risk/reward profiles of long versus short positions.
Contextual Sensitivity : The thresholds work in conjunction with the adaptive bands to create context-sensitive triggers. A threshold breach is only meaningful when it occurs in the proper sequence with band interactions.
Risk-Adjusted Positioning : The threshold levels are calibrated to provide favorable risk-adjusted entry points, considering both the probability of success and the potential magnitude of subsequent moves.
Bollinger Bands Overlay 📊
Multi-Timeframe Context : The price chart overlay provides essential context by showing traditional Bollinger Bands alongside the oscillator. This dual perspective allows traders to see both the absolute price position and the momentum characteristics simultaneously.
Support/Resistance Identification : The filled band area creates a visual representation of dynamic support and resistance levels. Price interaction with these bands provides additional confirmation for oscillator signals.
Volatility Environment Assessment : The width and slope of the bands offer immediate visual feedback about the current volatility environment, helping traders adjust their expectations and risk management accordingly.
Confluence Analysis : The overlay enables traders to identify confluence between price action at Bollinger Band levels and oscillator signals, creating higher-probability trade setups.
Signal Generation ⚡
The AMDO generates signals through precise mathematical crossover events:
Long Signals 🟢
Momentum Accumulation Detection : Long signals are generated when the lower adaptive momentum band crosses above the 83 threshold, indicating that downside momentum has exhausted and bullish momentum is beginning to accumulate. This represents a shift from defensive to offensive market posture.
Statistical Edge Confirmation : The crossing event occurs only when momentum characteristics have shifted sufficiently to provide a statistical edge for long positions. The adaptive nature ensures the signal quality remains consistent across different market volatility regimes.
Visual State Synchronization : Upon signal generation, the entire indicator ecosystem shifts to a bullish state - bar colors change, band states update, and the visual hierarchy emphasizes the long bias until conditions change.
Momentum Persistence Validation : The signal incorporates momentum persistence analysis to distinguish between genuine trend starts and false breakouts, reducing whipsaw trades in choppy market conditions.
Short Signals 🔴
Momentum Exhaustion Recognition : Short signals trigger when the upper adaptive momentum band crosses below the 40 threshold, signaling that bullish momentum has peaked and bearish momentum is emerging. This asymmetric threshold reflects the different dynamics of bullish versus bearish market phases.
Volatility-Adjusted Timing : The adaptive band system ensures that short signals are generated with appropriate timing regardless of the underlying volatility environment, maintaining signal quality in both high and low volatility conditions.
Regime-Aware Activation : Short signals are only active in Long/Short trading mode, recognizing that not all trading strategies benefit from short positions. The indicator adapts its behavior based on the selected trading approach.
Risk-Calibrated Thresholds : The 40 threshold is specifically calibrated to capture meaningful bearish momentum shifts while accounting for the higher risk typically associated with short positions.
Cash Signals 💰
Defensive Positioning Logic : In Long/Cash mode, cash signals are generated when short conditions are met, allowing traders to move to a defensive cash position rather than taking on short exposure. This preserves capital during unfavorable market conditions.
Risk Mitigation Strategy : Cash signals represent a risk-off approach that removes market exposure when momentum conditions favor the short side, protecting long-biased portfolios from adverse market movements.
Opportunity Cost Optimization : The cash position allows traders to avoid negative returns while maintaining flexibility to re-enter long positions when momentum conditions improve, optimizing the risk-adjusted return profile.
Features & Customization ⚙️
Color Schemes 🎨
9 pre-built color schemes (Classic through Classic9)
Custom color override option
Dynamic color changes based on signal states
Trading Modes 📈
Long/Short : Full bidirectional trading capability
Long/Cash : Long-only strategy with cash positions
Performance Metrics 📊
The indicator includes a comprehensive suite of advanced performance analytics that provide deep insights into strategy effectiveness:
Risk-Adjusted Return Metrics
Sortino Ratio : Measures returns relative to downside deviation only, providing a more accurate assessment of risk-adjusted performance by focusing on harmful volatility rather than total volatility. This metric is particularly valuable for asymmetric return distributions.
Sharpe Ratio : Calculates excess return per unit of total risk, offering a standardized measure of risk-adjusted performance that allows for comparison across different strategies and timeframes.
Omega Ratio : Employs probability-weighted analysis to compare the likelihood and magnitude of gains versus losses, providing insights into the overall shape of the return distribution and tail risk characteristics.
Drawdown and Risk Analysis
Maximum Drawdown : Tracks the largest peak-to-trough equity decline, providing crucial information about the worst-case scenario and helping traders understand the emotional and financial stress they might encounter.
Dynamic Drawdown Monitoring : Continuously updates drawdown calculations in real-time, allowing traders to monitor current drawdown levels relative to historical maximums.
Trade Statistics and Profitability
Profit Factor Analysis : Compares gross profits to gross losses, revealing the efficiency of the trading approach and the relationship between winning and losing trades.
Win Rate Calculation : Provides the percentage of profitable trades, which must be interpreted in conjunction with profit factor and average trade size for meaningful analysis.
Trade Frequency Tracking : Monitors total trade count to assess strategy turnover and transaction cost implications.
Position Sizing Guidance
Half Kelly Percentage : Calculates optimal position sizing based on Kelly Criterion methodology, then applies a conservative 50% reduction to account for parameter uncertainty and reduce volatility. This provides mathematically-based position sizing guidance that balances growth with risk management.
Parameters & Settings 🔧
BMD Settings
- Base Length : Period for Bollinger Band calculation (default: 10)
- Source : Price data source (default: close)
- Standard Deviation Length : Period for volatility calculation (default: 35)
- SD Multiplier : Bollinger Band width multiplier (default: 1.0)
- BB% Multiplier : Scaling factor for BB% calculation (default: 100)
BMD Settings
Base Length : Period for Bollinger Band calculation (default: 10)
Source : Price data source (default: close)
Standard Deviation Length : Period for volatility calculation (default: 35)
SD Multiplier : Bollinger Band width multiplier (default: 1.0)
BB% Multiplier : Scaling factor for BB% calculation (default: 100)
Signal Thresholds 🎯
Long Threshold : Trigger level for long signals (default: 83)
Short Threshold : Trigger level for short signals (default: 40)
Display Options 🖥️
Toggleable metrics table with 6 position options
Customizable date range limiter
Multiple visual elements for comprehensive analysis
Use Cases & Applications 💡
Trend Following
Identifies momentum shifts in trending markets
Provides early entry signals during trend continuations
Adaptive bands adjust to changing volatility conditions
Mean Reversion
Detects oversold/overbought conditions
Signals potential reversal points
Works effectively in ranging markets
Risk Management
Built-in performance metrics for strategy evaluation
Half Kelly percentage for position sizing guidance
Maximum drawdown monitoring
Advantages ✅
Adaptive Nature : Automatically adjusts to market volatility
Dual Display : Oscillator and price chart components work together
Comprehensive Metrics : Built-in performance analysis
Flexible Trading Modes : Supports different trading strategies
Visual Clarity : Color-coded signals and states
Customizable : Extensive parameter adjustment options
Important Considerations ⚠️
This indicator is designed for educational and analysis purposes
Should be used in conjunction with other technical analysis tools
Proper risk management is essential when trading
Backtest thoroughly before implementing in live trading
Market conditions can change rapidly, affecting indicator performance
Disclaimer ⚠️
Past performance is not indicative of future results. Trading involves substantial risk of loss and is not suitable for all investors. The information provided by this indicator should not be considered as financial advice. Always conduct your own research.
No indicator guarantees profitable trades - Always use proper risk management! 🛡️
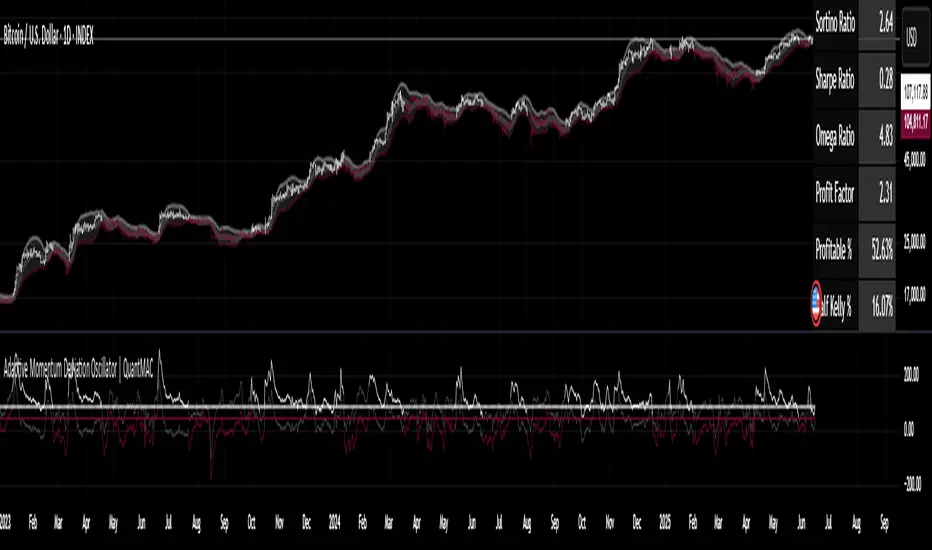
Trend Flow Trail [AlgoAlpha]OVERVIEW
This script overlays a custom hybrid indicator called the Money Flow Trail which combines a volatility-based trend-following trail with a volume-weighted momentum oscillator. It’s built around two core components: the AlphaTrail—a dynamic band system influenced by Hull MA and volatility—and a smoothed Money Flow Index (MFI) that provides insights into buying or selling pressure. Together, these tools are used to color bars, generate potential reversal markers, and assist traders in identifying trend continuation or exhaustion phases in any market or timeframe.
CONCEPTS
The AlphaTrail calculates a volatility-adjusted channel around price using the Hull Moving Average as the base and an EMA of range as the spread. It adaptively shifts based on price interaction to capture trend reversals while avoiding whipsaws. The direction (bullish or bearish) determines both the band being tracked and how the trail locks in. The Money Flow Index (MFI) is derived from hlc3 and volume, measuring buying vs selling pressure, and is further smoothed with a short Hull MA to reduce noise while preserving structure. These two systems work in tandem: AlphaTrail governs directional context, while MFI refines the timing.
FEATURES
Dynamic AlphaTrail line with regime switching logic that controls directional bias and bar coloring.
Smoothed MFI with gradient coloring to visually communicate pressure and exhaustion levels.
Overbought/oversold thresholds (80/20), mid-level (50), and custom extreme zones (90/10) for deeper signal granularity.
Built-in take-profit signal logic: crossover of MFI into overbought with bullish AlphaTrail, or into oversold with bearish AlphaTrail.
Visual fills between price and AlphaTrail for clearer confirmation during trend phases.
Alerts for regime shifts, MFI crossovers, trail interactions, and bar color regime changes.
USAGE
Add the indicator to any chart. Use the AlphaTrail plot to define trend context: bullish (trailing below price) or bearish (trailing above). MFI values give supporting confirmation—favor long setups when MFI is rising and above 50 in a bullish regime, and shorts when MFI is falling and below 50 in a bearish regime. The colored fills help visually track strength; sharp changes in MFI crossing 80/20 or 90/10 zones often precede pullbacks or reversals. Use the plotted circles as optional take-profit signals when MFI and trend are extended. Adjust AlphaTrail length/multiplier and MFI smoothing to better match the asset’s volatility profile.

MTF RSI MA System + Adaptive BandsMTF RSI MA System + Adaptive Bands
Overview
MTF RSI MA System + Adaptive Bands is a highly customizable Pine Script indicator for traders seeking a versatile tool for multi-timeframe (MTF) analysis. Unlike traditional RSI, it focuses on the Moving Average of RSI (RSI MA), delivering smoother and more flexible trading signals. The main screenshot displays the indicator in two panels to showcase its diverse capabilities.
Important: Timeframes do not adjust automatically – users must manually set them to match the chart’s timeframe.
Features
Core Component: Built around RSI MA, not raw RSI, for smoother trend signals.
Multi-Timeframe: Analyze RSI MA across three customizable timeframes (default: 4H, 8H, 12H).
Adaptive Bands: Three band calculation methods (Fixed, Percent, StdDev) for dynamic signals.
Flexible Signals: Generated via RSI MA crossovers, band interactions, or directional alignment across timeframes.
Background Coloring: Highlights when RSI MAs across timeframes move in the same direction, aiding trend confirmation.
Screenshot Panels Configuration
Upper Panel: Shows RSI, RSI MA, and fixed bands for reversal strategies (RSI crossing bands).
Lower Panel: Displays three RSI MAs (Alligator-style) for trend-following, with background coloring for directional alignment.
Band Calculation Methods
The indicator offers three ways to calculate bands around RSI MA, each with unique characteristics:
Fixed Bands
Set at a fixed point value (default: 10) above and below RSI MA.
Example: If RSI MA = 50, band value = 10 → upper band = 60, lower = 40.
Use Case: Best for stable markets or fixed-range preferences.
Tip: Adjust the band value to widen or narrow the range based on asset volatility.
Percent Bands
Calculated as a percentage of RSI MA (default: 10%).
Example: If RSI MA = 50, band value = 10% → upper band = 55, lower = 45.
Use Case: Ideal for assets with varying volatility, as bands scale with RSI MA.
Tip: Experiment with percentage values to match typical price swings.
Standard Deviation Bands (StdDev)
Based on RSI’s standard deviation over the MA period, multiplied by a user-defined factor (default: 10).
Example: If RSI MA = 50, standard deviation = 5, factor = 2 → upper band = 60, lower = 40.
Important: The default value (10) may produce wide bands. Reduce to 1–2 for tighter, practical bands.
Use Case: Best for dynamic markets with fluctuating volatility.
Configuration Options
RSI Length: Set RSI calculation period (default: 20).
MA Length: Set RSI MA period (default: 20).
MA Type: Choose SMA or EMA for RSI MA (default: EMA).
Timeframes: Configure three timeframes (default: 4H, 8H, 12H) for MTF analysis.
Overbought/Oversold Levels: Optionally display fixed levels (default: 70/30).
Background Coloring: Enable/disable for each timeframe to highlight directional alignment.
How to Use
Add Indicator: Load it onto your TradingView chart.
Setup:
Reversals: Configure like the upper panel (RSI, RSI MA, bands) and watch for RSI crossing bands.
Trends: Configure like the lower panel (three RSI MAs) and look for fastest MA crossovers and background coloring.
Adjust Timeframes: Manually set tf1, tf2, tf3 (e.g., 1H, 2H, 4H on a 1H chart) to suit your strategy.
Adjust Bands: Choose band type (Fixed, Percent, StdDev) and value. For StdDev, reduce to 1–2 for tighter bands.
Experiment: Test settings to match your trading style, whether scalping, swing trading, or long-term.
Notes
Timeframes: Always match tf1, tf2, tf3 to your chart’s needs, as they don’t auto-adjust.
StdDev Bands: Lower the default value (10) to avoid overly wide bands.
Versatility: Works across markets (stocks, forex, crypto).
