[FSSN] MA CrossOverview
This indicator provides a flexible and customizable tool for visualizing moving average crossovers, a classic technical analysis technique used to identify potential trend changes and generate trading signals. It plots two independent moving averages on the chart and clearly marks the points where they cross.
Key Features
Dual Moving Averages: Plots both a short-term (faster) and a long-term (slower) moving average.
Multiple MA Types: Offers a wide selection of popular moving average calculation types for each line independently:
SMA (Simple Moving Average)
EMA (Exponential Moving Average)
WMA (Weighted Moving Average)
HullMA (Hull Moving Average)
VWMA (Volume-Weighted Moving Average)
RMA1 (Rolling Moving Average - similar to Wilder's Smoothing)
TEMA (Triple Exponential Moving Average)
Customizable Lengths: Allows users to define the lookback period (length) for both the short and long moving averages.
Clear Crossover Signals: Automatically detects and plots a distinct visual marker (a cross) directly on the chart whenever the short MA crosses above or below the long MA.
Source Price: Utilizes the closing price ( close ) of each bar as the source data for all moving average calculations.
How It Works
Input Configuration: The user selects the desired calculation type (e.g., EMA, SMA, HMA) and sets the length (period) for both the short-term and long-term moving averages via the indicator settings.
Calculation: The script calculates the chosen moving average values for each bar based on the selected types, lengths, and the closing price ( close ). It correctly computes specialized types like the Hull Moving Average (HMA) and Triple Exponential Moving Average (TEMA) according to their respective formulas.
Plotting MAs: The calculated short-term MA and long-term MA values are plotted as continuous lines on the price chart (default colors are orange for short MA and green for long MA).
Crossover Detection: The script uses the ta.cross() function to identify bars where the short MA value crosses over or under the long MA value.
Plotting Cross Signals: When a crossover occurs, a visual marker (default: blue cross, style plot.style_cross ) is plotted. Note: The vertical position of this cross marker is placed at the level of the short Simple Moving Average (SMA) calculated with the shortlen input at the time of the crossover, regardless of the MA type selected for the plotted short MA line ( short_avg ).
Inputs / Settings
Short MA Length: Defines the lookback period for the faster moving average (Default: 7).
Long MA Length: Defines the lookback period for the slower moving average (Default: 25).
Short Media selector: Dropdown menu to select the calculation type for the short MA (Default: EMA). Options: SMA, EMA, WMA, HullMA, VWMA, RMA, TEMA.
Long Media selector: Dropdown menu to select the calculation type for the long MA (Default: EMA). Options: SMA, EMA, WMA, HullMA, VWMA, RMA, TEMA.
Visualization
Short MA Line: Represents the faster moving average (Default: Orange).
Long MA Line: Represents the slower moving average (Default: Green).
Cross Marker: Appears on bars where the Short MA crosses the Long MA (Default: Blue Cross). A cross above the Long MA typically suggests bullish momentum, while a cross below suggests bearish momentum.
Potential Use Cases
Trend Identification: When the short MA is above the long MA, it generally indicates an uptrend. When below, it suggests a downtrend.
Signal Generation: Crossovers can be used as potential entry or exit signals (e.g., buy when short MA crosses above long MA, sell when it crosses below). Always use in conjunction with other analysis methods.
Strategy Development: Forms the basis for MA crossover trading strategies. The flexibility in MA types allows tuning for different market conditions or asset characteristics (e.g., using faster MAs like EMA/TEMA for more responsive signals, or smoother MAs like SMA/WMA for longer-term trends).
Media
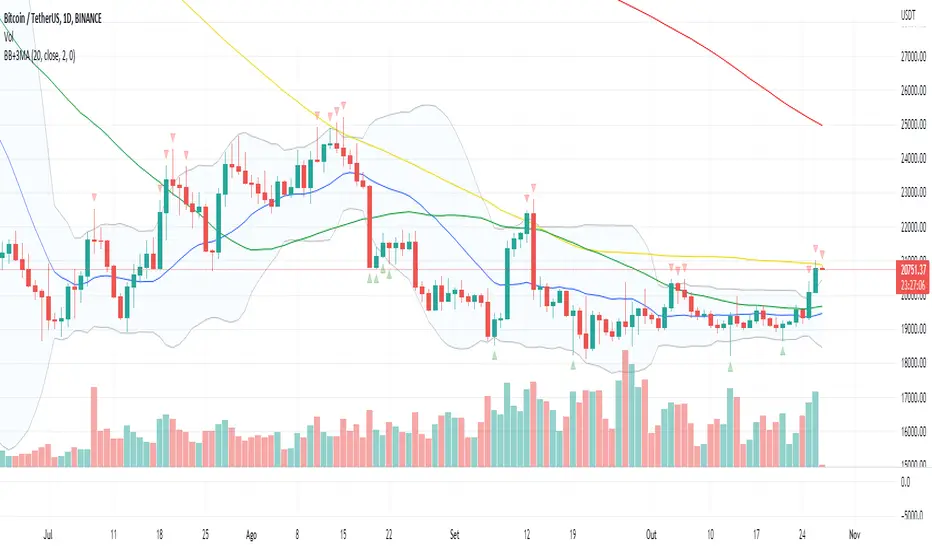
Bandas de Bollinger + 3 Medias Moviles SimplesDenota de una forma poco invasiva, cuando el precio alcanza las Bandas de Bollinger, y permite apreciar al mismo tiempo las medias móviles de 200,100 y 50 a fin de estar alerta a sus cruces, nos obstante, dicho indicador, debe ser apoyado junto con otros indicadores en los mercados financieros que estén al alza o a la baja.
Descargo de responsabilidad: Este contenido los datos, indicadores y valores reflejados, es solo para fines informativos y no debe interpretarse como asesoramiento legal, fiscal, de inversión, financiero o de otro tipo.
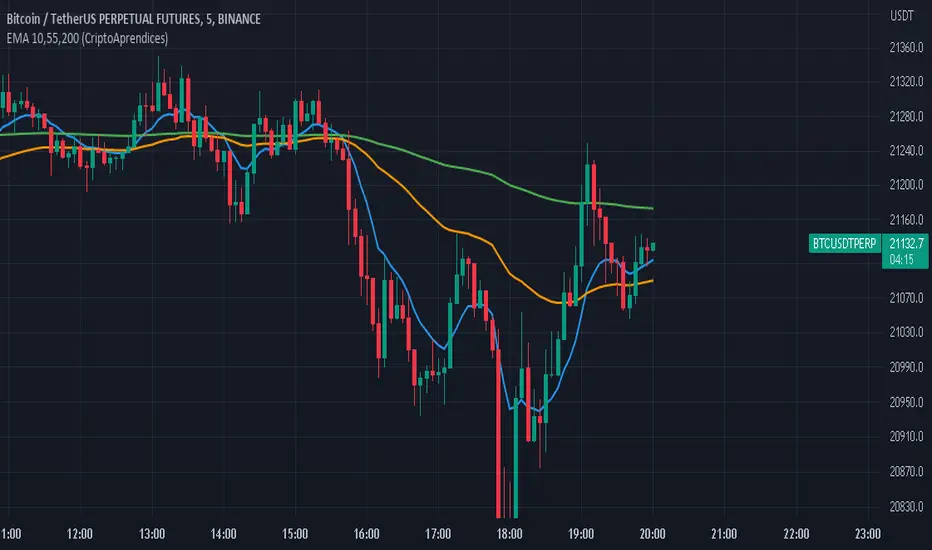
EMA 10,55,200 (CriptoAprendices) CriptoAprendices
Media Móvil Exponencial (EMA'S )de 10,55 Y 200 en Un Solo Indicador
Média 8, 21, 56, 200 SEMANAL - Augusto BackesFique tranquilo, aqui tem todas as médias que o Backes utiliza dentro de um indicador só, aproveite :)
Multi_TF_EMAMultiple TimeFrame EMA
In a single indicator, up to 6 EMAs can be displayed in 6 different time frames.
En un solo indicador se puede visualizar hasta 6 EMAs en diferentes TImeFrames.
EMA Slope - ValenteThis indicator will show you the EMA SLOPE as a HISTOGRAM.
Este indicador mostra a INCLINACAO da EMA como um HISTOGRAMA
The Fantastic Four of Oliver VelezThis script graphics the "fantastic 4" area, was created by oliver velez and is used in the opening of the american stock market, determined by:
1- ma200 at the closure of the previous day
2- ma20 at the closure of the previous day
3- price of previous day closure
4- activity of the last 30/60 min prior to the closure of the previous day (search the maximum and minimum)
Basically it is a very important support / resistance area the first hour from the opening, the trap area is an area in which it should be avoided to operate if the price opens within the same. In advance of being used as a support / resistance area if the price opens above the 4f is looking for longer opportunities (many more aspects should be evaluated) and if it is below.
Configuration:
- possibility to modify the amount of minutes of the activity of the previous day.
- possibility of hidding the "trap area" label.
- possibility of hidding the "change to temporary frame of 2 min" label.
Note: the temporary framework used is the 2 min, in the event of being in another temporary framework the indicator will not work and will be alerted with a label
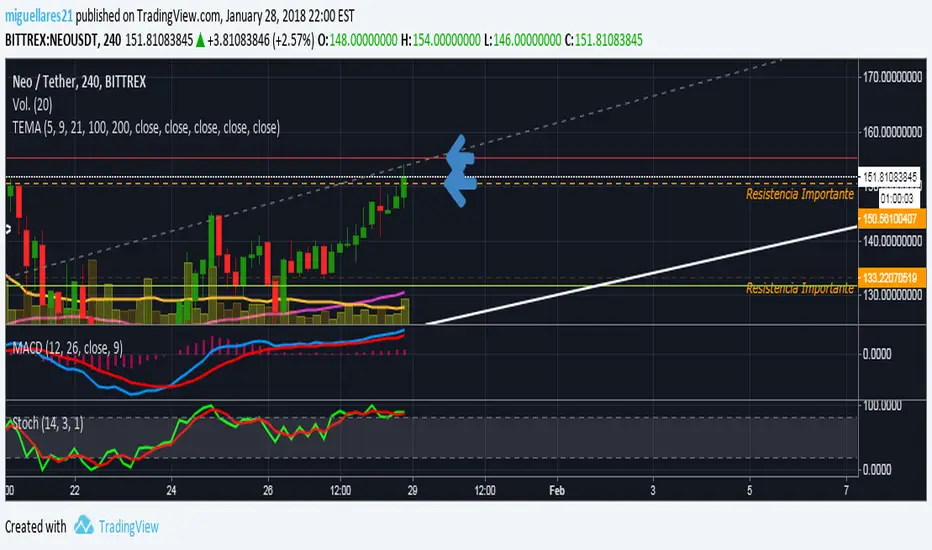
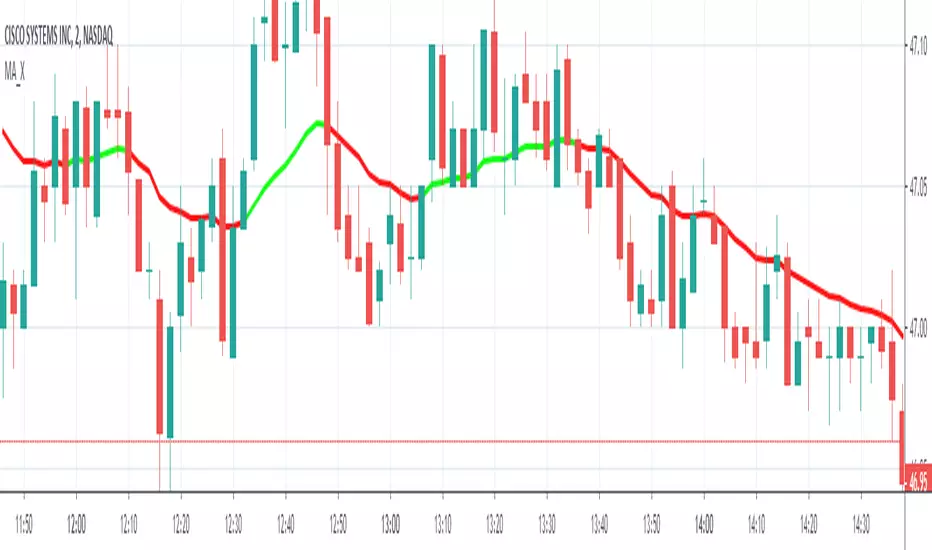
Moving Average Color Direction Detection Moving Average Color Direction Detection, possibility to configure:
- Type: SMA, EMA, WMA, VWMA, SMMA, DEMA, TEMA, HULLMA, ZEMA, TMA, SSMA
- Lenght
- Source
- Colour direction
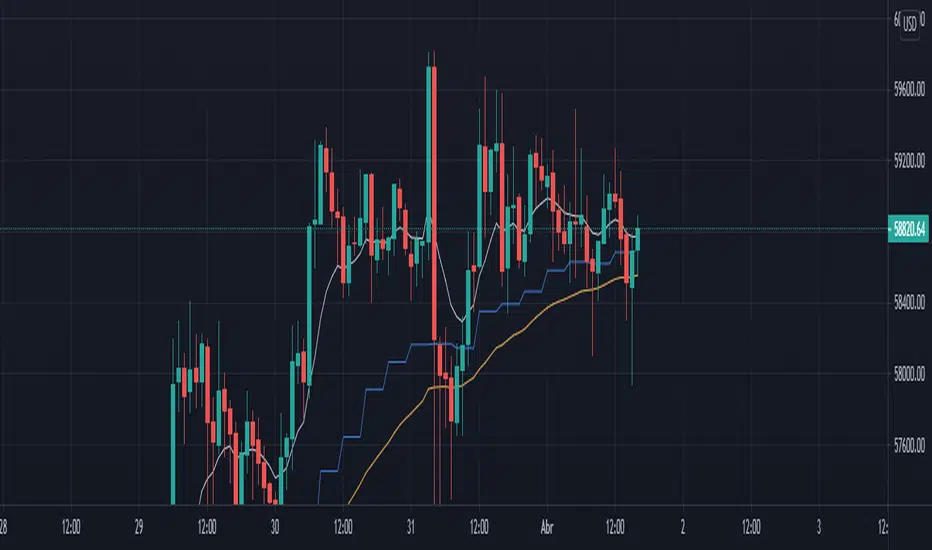
AVERAGE MULTI_SMAIndicator returns an average of 5 SMAs. an interesting point that I have noticed that the price has several times reacted on it.
Note 1: Do not just use this as a criterion for buying and selling, use as one more aid.
Note 2: It is possible to leave in the chart all the averages, if you feel it necessary.
------------------------------------//--------------------------------------------------
Indicador retorna uma média de 5 SMAs. um ponto interessante que tenho notado que o preço tem diversas vezes reagido nele.
Observação 1: Não use apenas isso como critério para compra e venda, use como mais um auxilio.
Observação 2: É possivel deixar no grafico todas as médias, caso você ache necessário.
5 en 1 EMACon este script puedes tener 5 EMA en un solo indicador, puedes configurar igualmente cada uno de sus valores!!