Concentric Geometry – Invariant MetricsConcentric Geometry – Invariant Metrics
This indicator demonstrates the invariant concept of a concentric circle around a selected price range. By anchoring two points (A & B), it calculates a set of ratios and slopes that remain consistent under concentric scaling of price and time. These invariants include the raw slope (ΔP/N), concentric slope, π-adjusted ratios, and √2 offsets — all of which can be used to explore deeper geometric relationships in the market.
What has been demonstrated here is not an “out-of-the-box” trading system. Instead, the outputs provide the raw invariant metrics from which the trader must derive their own ratios and extensions. For example, price-to-bar ratio inputs are not fixed — they need to be derived from the invariants themselves, and experimenting with them is the key to uncovering harmonic alignments and scaling behaviors.
Key features include:
• Range & Bars Analysis – Price range (ΔP) and bar count (N) between anchors.
• Core Invariants – Midpoint, radius (price and bar units), upper/lower bounds.
• Linear Slope Metrics – ΔP/N and √2 concentric slope.
• π-Adjusted Price/Bar – Harmonic arc-length ratio.
• Circumference & Offsets – Circle circumference, √2 and 1/√2 offsets in price and bar units.
This tool is best suited for traders studying market geometry, W.D. Gann principles, harmonic ratios, or the geometric methods of Michael Jenkins. It does not generate buy/sell signals — instead, it equips the trader with building blocks for geometric exploration.
Key point: The trader must experiment with the ratios derived from these metrics. Playing with different price-to-bar relationships unlocks the true potential of concentric market geometry, whether applied to dynamic anchored VWAPs, concentric overlays, or Vesica Piscis structures.
Use it to:
• Compare slopes across swings
• Derive new ratios from invariant metrics
• Anchor dynamic anchored VWAPs to concentric nodes
• Explore concentric or Vesica Piscis overlays
• Support advanced geometric trading strategies
Michael

Harris RSIThis is a variation of Wilder's RSI that was altered by Michael Harris.
CALCULATION
The average change of each of the length's source value is compared to the more recent source value.
The average difference of both positive or negative changes is found.
The range of 100 is divided by the divided result of the average incremented and decremented ratio plus one.
This result of the above is subracted from the range value of 100
I have added some signals and filtering options with moving averages:
Trend OB/OS: Uptrend after above Overbought Level. Downtrend after below Oversold Level (For the traditional RSI OB=60 and OS=40 is used)
OB/OS: When above Overbought, or below oversold
50-Cross: Above 50 line is uptrend, below is downtrend
Direction: Moving up or down
RSI vs MA: RSI above MA is an uptrend, RSI below MA is a downtrend
The signals I added are just some potential ideas, always backtest your own strategies.

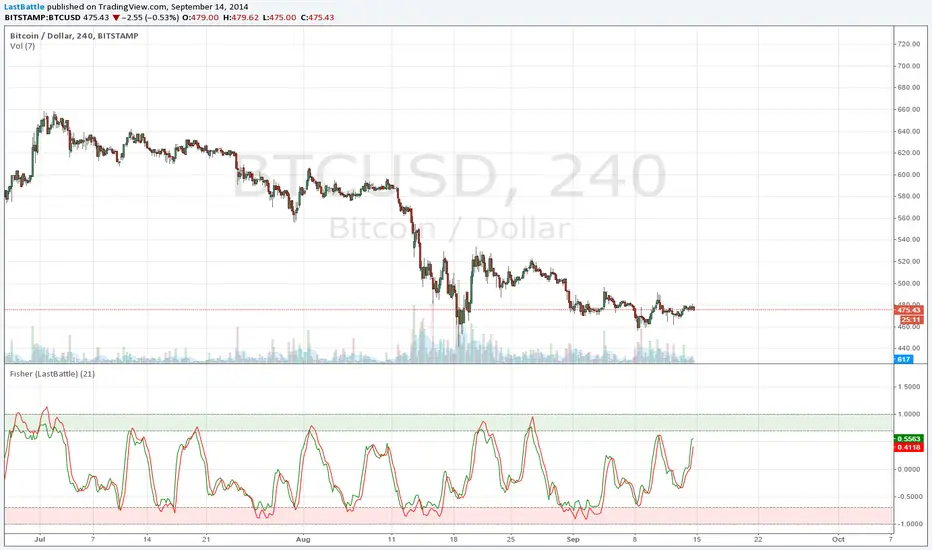
Fisher Transform StrategyDirect port of the original Fisher Transform to TradingView: media.johnwiley.com.au
www.mesasoftware.com
This might be better suited to be combined with other indicator to be effective, such as the Fisher Transform of RSI.
I hope you have found this useful :) Happy trading.
Thanks to @MikeLloyd for referring me to this, and here's my port for you.