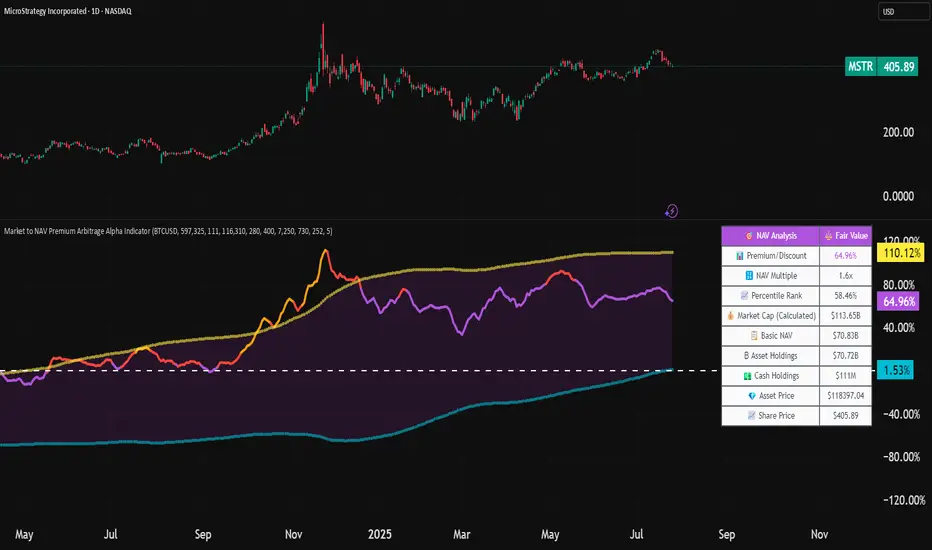
Market to NAV Premium Arbitrage Alpha IndicatorBitcoin treasury companies such as Microstrategy are known for trading at significant premiums. but how big exactly is the premium? And how can we measure it in real time?
I developed this quantitative tool to identify statistical mispricings between market capitalization and net asset value (NAV), specifically designed for arbitrage strategies and alpha generation in Bitcoin-holding companies, such as MicroStrategy or Sharplink Gaming, or SPACs used primarily to hold cryptocurrencies, Bitcoin ETFs, and other NAV-based instruments. It can probably also be used in certain spin-offs.
KEY FEATURES:
✅ Real-time Premium/Discount Calculation
• Automatically retrieves market cap data from TradingView
• Calculates precise NAV based on underlying asset holdings (for example Bitcoin)
• Formula: (Market Cap - NAV) / NAV × 100
✅ Statistical Analysis
• Historical percentile rankings (customizable lookback period)
• Standard deviation bands (2σ) for extreme value detection (close to these values might be seen as interesting points to short or go long)
• Smoothing period to reduce noise
✅ Multi-Source Market Cap Detection
• You can add the ticker of the NAV asset, but if necessary, you can also put it manually. Priority system: TradingView data → Calculated → Manual override
✅ Advanced NAV Modeling
• Basic NAV: Asset holdings + cash.
• Adjusted NAV: Includes software business value, debt, preferred shares. If the company has a lot of this kind of intrinsic value, put it in the "cash" field
• Support for any underlying asset (BTC, ETH, etc.)
TRADING APPLICATIONS:
🎯 Pairs Trading Signals
• Long/Short opportunities when premium reaches statistical extremes
• Mean reversion strategies based on historical ranges
• Risk-adjusted position sizing using percentile ranks
🎯 Arbitrage Detection
• Identifies when market pricing significantly deviates from fair value
• Quantifies the magnitude of mispricing for profit potential
• Historical context for timing entry/exit points
CONFIGURATION OPTIONS:
• Underlying Asset: Any symbol (default: COINBASE:BTCUSD) NEEDS MANUAL INPUT
• Asset Quantity: Precise holdings amount (for example, how much BTC does the company currently hold). NEEDS MANUAL INPUT
• Cash Holdings: Additional liquid assets. NEEDS MANUAL INPUT
• Market Cap Mode: Auto-detect, calculated, or manual
• Advanced Adjustments: Business value, debt, preferred shares
• Display Settings: Lookback period, smoothing, custom colors
IT CAN BE USED BY:
• Quantitative traders focused on statistical arbitrage
• Institutional investors monitoring NAV-based instruments
• Bitcoin ETF and MSTR traders seeking alpha generation
• Risk managers tracking premium/discount exposures
• Academic researchers studying market efficiency (as you can see, markets are not efficient 😉)
Microstrategy
MSTR-BTC PremiumThis custom indicator, “MSTR-BTC Premium with High, Average, and Low Levels,” helps you analyze the premium of MicroStrategy Incorporated’s (MSTR) stock price in relation to its Bitcoin holdings. By comparing the market capitalization of MSTR to the value of its Bitcoin holdings (using BTCUSD from Coinbase), this indicator calculates a premium that reflects how much the stock price deviates from its Bitcoin-related value.
Key Features:
• Premium Line: The primary feature is the “Premium,” which shows the ratio of MSTR’s market cap relative to its Bitcoin holdings and the BTCUSD price.
• High, Average, and Low Levels: The indicator calculates the highest, lowest, and average premium values over a user-defined period (default is 14 bars). These levels help identify overbought and oversold conditions relative to the stock’s Bitcoin valuation.
• Visual Shading: The area between the premium line and the average is shaded, making it easier to see when the premium is above or below its typical level. Optional shading is also available between the high and low levels to visualize the price range.
How to Use:
• Overbought/Undervalued Conditions: When the premium line rises significantly above the average, it may indicate that MSTR stock is overbought compared to its Bitcoin holdings. Conversely, when the premium falls below the average or approaches the low line, it might signal an undervalued opportunity.
• Trend and Mean Reversion: The high and low lines provide insight into extreme levels. Monitoring these alongside the average can assist in identifying potential mean reversion trades.
Customization:
• Calculation Period: The period for calculating the high, low, and average values can be adjusted to suit your trading strategy (default is 14).
• Shading Options: By default, the area between the premium and its average is shaded. You can enable or disable the shading between the high and low as needed.
This indicator is particularly useful for traders and investors following MicroStrategy (MSTR) and its Bitcoin strategy, providing a deeper understanding of the stock’s relationship to its underlying Bitcoin assets. It can assist in identifying key levels for decision-making based on deviations from historical norms.
How to Add the Indicator:
1. Adjust the calculation period (default is 14) to customize the analysis according to your preferred timeframe.
2. Watch for significant deviations of the premium line from its average to identify potential overbought/oversold conditions.
3. Use the high and low levels to help gauge extreme premium values and possible mean reversion opportunities.
Enjoy the analysis and make more informed decisions with the MSTR-BTC Premium Indicator!
This description should be clear and informative for anyone considering using your indicator. It highlights the functionality, purpose, and customization options in a straightforward way. Let me know if you’d like to tweak or adjust any part of it!

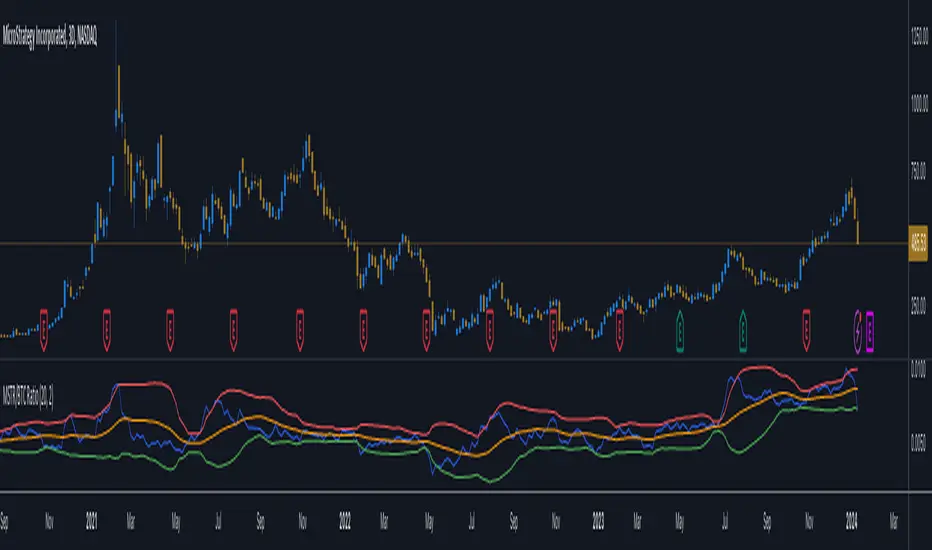
MicroStrategy / Bitcoin Market Cap RatioThis indicator offers a unique analytical perspective by comparing the market capitalization of MicroStrategy (MSTR) with that of Bitcoin (BTC) . Designed for investors and analysts interested in the correlation between MicroStrategy's financial performance and the Bitcoin market, the script calculates and visualizes the ratio of MSTR's market capitalization to Bitcoin's market capitalization.
Key Features:
Start Date: The script considers data starting from July 28, 2020, aligning with MicroStrategy's initial announcement to invest in Bitcoin.
Data Sources: It retrieves real-time data for MSTR's total shares outstanding, MSTR's stock price, and BTC's market capitalization.
Market Cap Calculations: The script calculates MicroStrategy's market cap by multiplying its stock price with the total shares outstanding. It then forms a ratio of MSTR's market cap to BTC's market cap.
Bollinger Bands: To add a layer of analysis, the script includes Bollinger Bands around the ratio, with customizable parameters for length and multiplier. These bands can help identify overbought or oversold conditions in the relationship between MSTR's and BTC's market values.
The indicator plots the MSTR/BTC market cap ratio and the Bollinger Bands, providing a clear visual representation of the relationship between these two market values over time.
This indicator is ideal for users who are tracking the impact of Bitcoin's market movements on MicroStrategy's valuation or vice versa. It provides a novel way to visualize and analyze the interconnectedness of a leading cryptocurrency asset and a major corporate investor in the space.
MicroStrategy MetricsA script showing all the key MSTR metrics. I will update the script every time degen Saylor sells some more office furniture to buy BTC.
All based around valuing MSTR, aside from its BTC holdings. I.e. the true market cap = enterprise value - BTC holdings. Hence, you're left with the value of the software business + any premium/discount decided by investors.
From this we can derive:
- BTC Holdings % of enterprise value
- Correlation to BTC (in this case we use CME futures...may change this)
- Equivalent Share Price (true market cap divided by shares outstanding)
- P/E Ratio (equivalent share price divided by quarterly EPS estimates x 4)
- Price to FCF Ratio (true market cap divided by FCF (ttm))
- Price to Revenue (^ but with total revenue (ttm))
