NSE/BSE Derivative - Next Expiry Date With HolidaysNSE & BSE Expiry Tracker with Holiday Adjustments
This Pine Script is a TradingView indicator that helps traders monitor upcoming expiry dates for major Indian derivative contracts. It dynamically adjusts these expiry dates based on weekends and holidays, and highlights any expiry that falls on the current day.
⸻
Key Features
1. Tracks Expiry Dates for Major Contracts
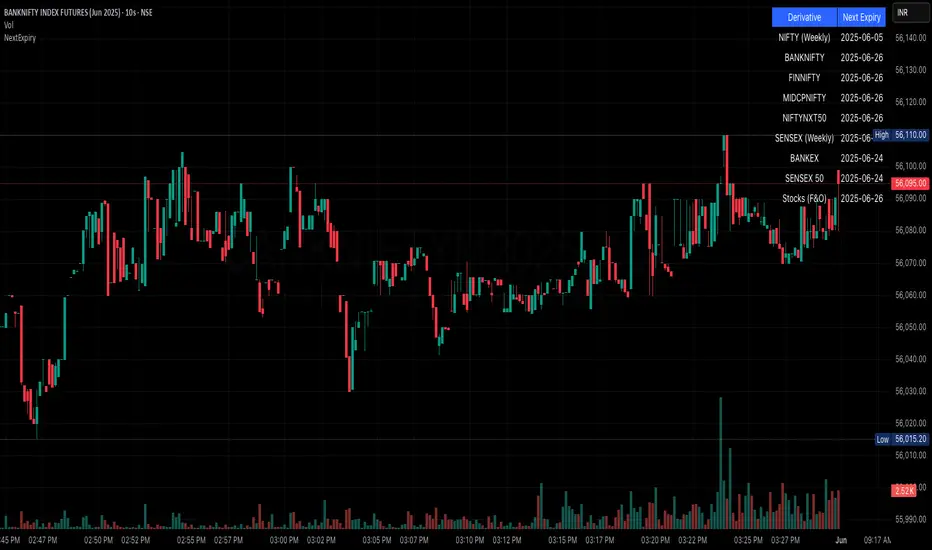
The script calculates and displays the next expiry dates for the following instruments:
• NIFTY (weekly expiry every Thursday)
• BANKNIFTY, FINNIFTY, MIDCPNIFTY, NIFTYNXT50 (monthly expiry on the last Thursday of the month)
• SENSEX (weekly expiry every Tuesday)
• BANKEX and SENSEX 50 (monthly expiry on the last Tuesday of the month)
• Stocks in the F&O segment (monthly expiry on the last Thursday)
2. Holiday Awareness
Users can input a list of holiday dates in the format YYYY-MM-DD,YYYY-MM-DD,.... If any calculated expiry falls on one of these holidays or a weekend, the script automatically adjusts the expiry to the previous working day (Monday to Friday).
3. Customization Options
The user can:
• Choose the position of the expiry table on the chart (e.g. top right, bottom left).
• Select the font size for the expiry table.
• Enable or disable the table entirely (if implemented as an input toggle).
4. Visual Expiry Highlighting
If today is an expiry day for any instrument, the script highlights that instrument in the display. This makes it easy to spot significant expiry days, which are often associated with increased volatility and trading volume.
⸻
How It Works
• The script calculates the next expiry for each index using built-in date/time functions.
• For weekly expiries, it finds the next occurrence of the designated weekday.
• For monthly expiries, it finds the last Thursday or Tuesday of the month.
• Each expiry date is passed through a check to adjust for holidays or weekends.
• If today matches the adjusted expiry date, that row is visually emphasized.
⸻
Use Case
This script is ideal for traders who want a quick glance at which instruments are expiring soon — especially those managing options, futures, or expiry-based strategies.
Midcpnifty
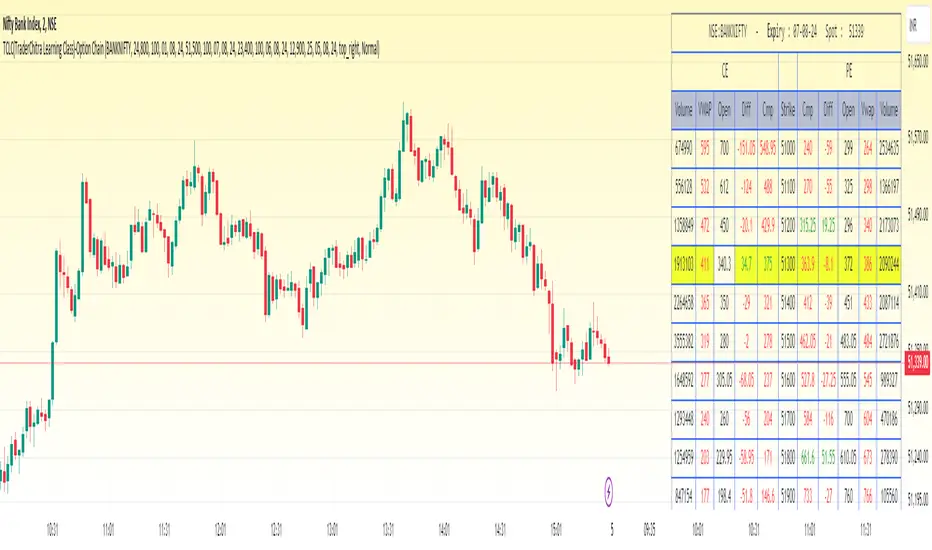
TCLC(TraderChitra Learning Class)-Option ChainThis indicator plots the Option chain data of the following instruments and columns..
It plots 11 rows ,
5 Rows above the input strike price
1 Row for the input strike price
5 Rows below the input strike price
Instruments :
1. NIFTY
2. BANKNIFTY
3. FINNIFTY
4. MIDCPNifty
Columns :
1. StrikePrice
2.CMP
3.Volume
4.VWAP
5.Diff (Open-Close)
Traders need to change the expiry date to check the premium of the corresponding instruments...
There are few key things,
1. Rows in yellow are marked as ATM strike price
2. Cell values in red / green indicates the prices are trading above / below the VWAP
The prices are expected to be bullish when cmp trades above VWAP and we can gauge the trend
The column Volume provides the details in which strike price more traders are actively traded..
The far month contracts can also be changed in the settings and it helps the swing/positional traders
The Strike price can be modified to check the appropriate strikes