TOMMAR#TOMMAR #MultiMovingAverages #MMAR
Dear fellow traders, this is Tommy, and today I'd like to introduce you to the Multi-Moving Averages Ribbon (MMAR) indicator, which I believe to be one of the best MMAR indicators available on TradingView. Moving Averages is a popular technical analysis tool used to smooth out price data by creating an average of past price data points over a specified time period. They can be used to identify trends and provide a clearer view of price action, as well as generate buy and sell signals by observing crossovers between different moving average lines.
In the MMAR indicator, we have incorporated 12 different types of Moving Averages, including Simple Moving Averages (SMA), Exponential Moving Averages (EMA), Weighted Moving Averages (WMA), Hull Moving Averages (HMA), and Smoothed Moving Averages (SMMA), among others. This allows traders to choose the optimal type for their preferred trading commodities.
One common technique in technical analysis is using multiple Moving Averages with varying lengths, which provides a more comprehensive view of price action. By analyzing multiple Moving Averages with different timeframes, traders can better understand both short- and long-term trends and make more informed trading decisions. Some of the well-known combinations of multiple moving averages used by traders are (5, 9, 14, 21, 45), (6, 11, 16, 22, 51), [8, 13, 21, 55), (50, 100, 200), and (60, 120, 240).
Another way to gauge the strength of the market trend is to look for the arrangement of the Moving Averages. If they are in a sequential order, with the shortest on top and the longest on the bottom, it is most likely a bullish trend. On the other hand, if they are arranged in reverse order, with the shortest on the bottom and the longest on top, it is most likely a bearish trend. The 'Trend Light' in the indicator settings will automatically signal when the Moving Averages are in either an orderly or reverse arrangement.
Lastly, I have added a useful feature to the indicator: the 'MA Projection'. This feature projects and forecasts the Moving Averages in the future, allowing traders to easily identify confluence zones in future candlesticks. Please note that the projection levels may change in the case of extreme price action that significantly affects the Moving Averages.
This is free so any Tradingview users can use this indicator. Just search TOMMAR in the indicator section located on top of the chart.
#TOMMAR #MultiMovingAverages #MMAR
안녕하세요 트레이더 여러분, 토미입니다. 오늘 여러분들에게 소개드릴 지표는 다양한 길이의 이동평균선 조합을 사용할 수 있는 MMAR (Multiple Moving Averages Ribbon)입니다. 아마 제가 만든 MMAR 지표가 트레이딩뷰에서 가장 쓸만할 겁니다. 이동평균선, 줄여서 이평선은 말 그대로 특정 기간 범위 내의 주가들을 평균한 값들로 이루어진 선입니다. 제가 이평선 관련된 강의 자료는 예전에 올려드린 바 있으니 더 자세한 내용이 궁금하신 분들은 아래 링크/이미지 클릭하시길 바랍니다.
본 지표는 Simple Moving Averages (SMA), Exponential Moving Averages (EMA), Weighted Moving Averages (WMA), Hull Moving Averages (HMA), 그리고 Smoothed Moving Averages (SMMA) 등을 포함해 총 12개 종류의 이평선 지표를 사용할 수 있습니다. 또한 각 이평선의 길이들도 하나하나 일일이 설정하실 수 있습니다. 예를 들어 요즘에 자주 보이는 이평선들의 조합이 , , , , 그리고 등등이 존재하는데 여러분의 취향에 맞게 설정하여 사용하시면 됩니다.
몇 가지 주요 기능에 대해서 설명 드리겠습니다. 설정에서 ‘Trend Light’를 키면 이평선들의 정배열 혹은 역배열 여부를 쉽게 볼 수 있습니다. 이평선이 정배열일때는 맨 아래의 이평선에 초록불이, 역배열일때는 맨 위의 이평선에 빨간불이 켜지며 둘 다 아닐 땐 아무 불도 켜지지 않습니다. 또한 ‘MA Projection’을 키면 이평선들의 미래 예측 값들을 확장해줍니다. 당연히 가격 변동이 갑자기 크게 나오면 이평선 예측 확장 레벨들이 확 바뀌겠죠.
지표창에 TOMMAR 검색하시거나 아래 즐겨찾기 인디케이터에 넣기 클릭하시면 누구나 사용하실 수 있습니다~ 여러분의 구독, 좋아요, 댓글은 저에게 큰 힘이 됩니다.
Mmar


Librehash Double Guppy ChannelThis indicator is a slightly more advanced twist to the commonly used 'CM Super Guppy' and Madrid Moving Average Ribbon (MMAr), if you are familiar with it.
If not, please take a look at the pictures below:
Above is the CM Super Guppy
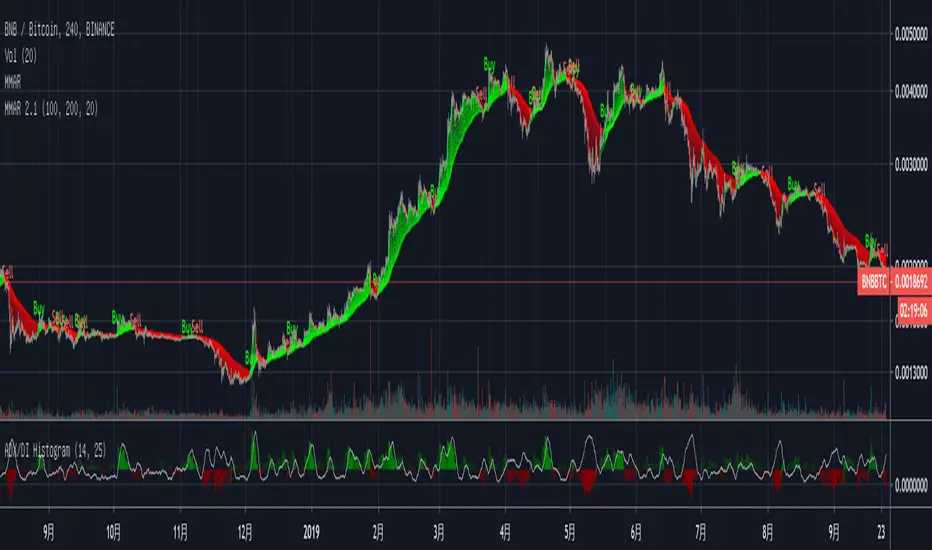
Above is the MMAR.
Core Difference Between the Zerononcense Double Guppy and the Two Former Iterations
The Zerononcense Double Guppy is a significant upgrade over both of the aforementioned indicators because it incorporates substantially more information for the user to make use of while trading.
1. The ZN Double Guppy creates a restrictive channel around the highs and lows of the price that imitate features of Donchian channels. Therefore, any and all trading practices that are asssociated with the Donchian can be applied here.
2. By implementing multiple moving averages for both the higher and lower end of the spectrum whilst providing a channel for the price at the same time, users are able to confirm trends easier and understand price direction as well as impending price action as well because the upper and lower bounds (two different colors) of the indicator will be providing traders information independent of one another, making this an infinitely useful tool to have in one's trading arsenal.
3. Perhaps the most awesome aspect of the ZN Double Guppy is that it confirms trend substantially earlier than the aforementioned indicators, and coding the upper and lower bounds separately allow for two layers of confirmation; making the indicator exponentially more powerful than its predecessors.
How to Read the Indicator:
This is simple.
A) The 'middle' part or the brown area is where the price's 'normal' trajectory is based on former price data (coded into the indicator).
B) If the price is either above or below these points, that represents an extreme in the data.
C) The colors change for the upper and lower bounds. For the upper bound, the default (neutral) color is blue. When a positive price trend is confirmed, the upper bound of the indicator will change to the color 'green'. The lower bound does the same thing. For example, the two colors of the lower bound indicator are 'purple' and 'red'. When the lower bound is showing 'purple', that is default (neutral). However, when it signals red, then the negative price action trend has been confirmed.
D) The indicator will never show both purple and green at the same time.
E) The indicator may, however, show both bounds in a neutral phase, this should be considered to be an abnormal level of consolidation and inaction in the price and other indicators should be consulted alongside this one in such situations.
F) This indicator is not meant to be predictive. However, it is definitely meant to assist with confirming trends. Although this is not the most glorious aspect of trading and it is oft underlooked, this is perhaps one of the most valuable and crucial facets of any experienced trader's repertoire. Without confirmation, one is subject to pivots, whipsaws, and other sharp market moves that may not be easily foreseen / anticipated without an indicator such as this one.
Interested in Using This Indicator?
If you're interested in using this indicator, just contact me on TradingView and we can talk. Please note that access to this indicator is not free.
Price and payment options (primarily crypto), will be discussed as well. Access is a very simple process.
Also, please do not hesitate to reach out if you have any doubts its going to work.
