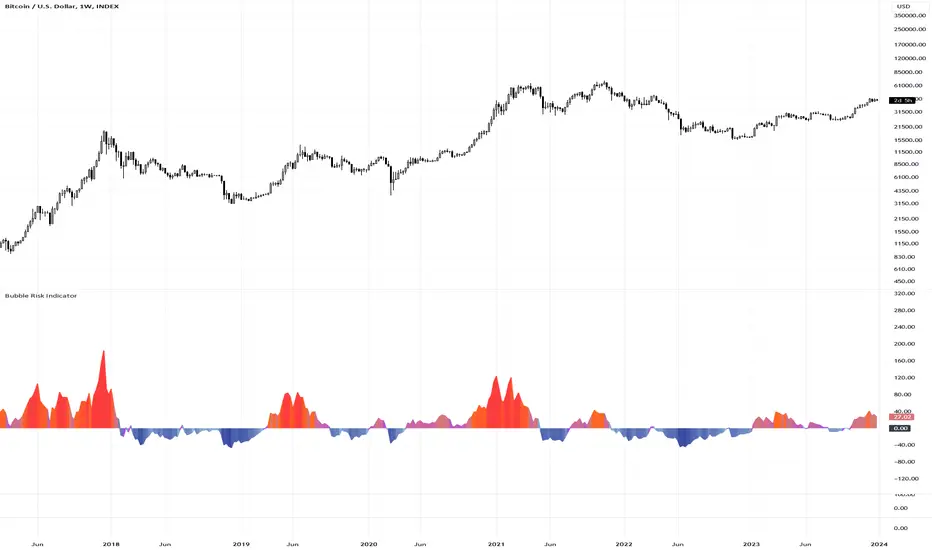
Bubble Risk IndicatorThe Bubble Risk Indicator is a sophisticated tool designed to assess the potential risk level of a trading instrument by measuring its deviation from a 20-week Simple Moving Average (SMA). This dynamic indicator visually represents the deviation with a color-changing line, indicating the degree of risk based on the distance from the SMA.
🔷 Calculation
The indicator calculates the deviation from the 20-week SMA and expresses it as a percentage extension:
20-Week SMA : Averages the closing prices over the past 20 periods, providing a consistent measure of the long-term trend.
Deviation Percentage : Measures the percentage difference between the current closing price and the 20-week SMA.
🔷 Color Coding
The line changes color based on the deviation level to represent different risk levels. Users can customize these colors as per their preferences. However, the following are the default recommended settings:
Extreme Low Risk (Below 0) : Blue
Low Risk (Below 0) : Light Blue
Low Risk (Above 0) : Light Purple
Medium Risk : Orange
High Risk : Red
Colors transition smoothly to reflect the increasing or decreasing risk based on the deviation from the SMA.
🔷 Customization
Users have the flexibility to change the colors representing each risk level through the indicator settings. While the default colors are recommended for a standard view, users comfortable with custom color schemes can adjust according to their preference.
🔷 Usage
This indicator is beneficial for gauging the relative risk associated with current price movements compared to a historical average. It's most effective when used in conjunction with other technical analysis tools and market knowledge.
🔷 Limitations
While the Bubble Risk Indicator provides valuable insights, it should form part of a broader trading strategy. It assesses risk levels based on historical data and does not predict future market directions.
🔷 Conclusion
The Bubble Risk Indicator offers a nuanced and visually intuitive way to understand market risk levels, providing traders with an additional tool for informed decision-making.
🔷 Risk Disclaimer
Trading involves significant risk and is not suitable for every investor. The value of investments can fluctuate. Past performance is not indicative of future results. Always consider your circumstances and seek independent advice before making financial decisions. This indicator is provided for informational purposes only and is not intended as financial advice.
Momentumindicator
Logical Trading Indicator V.1Features of the Logical Trading Indicator V.1
ATR-Based Trailing Stop Loss
The Logical Trading Indicator V.1 utilizes the Average True Range (ATR) to implement a dynamic trailing stop loss. You can customize the sensitivity of your alerts by adjusting the ATR Multiple and ATR Period settings.
Higher ATR Multiple values create wider stops, while lower values result in tighter stops. This feature ensures that your trades are protected against adverse price movements. For best practice, use higher values on higher timeframes and lower values on lower term timeframes.
Bollinger Bands
The Logical Trading Indicator V.1 includes Bollinger Bands, which can be customized to use either a Simple Moving Average (SMA) or an Exponential Moving Average (EMA) as the basis.
You can adjust the length and standard deviation multiplier of the Bollinger Bands to fine-tune your strategy. The color of the basis line changes to green when price is above and red when price is below the line to represent the trend.
The bands show a range vs a single band that also represents when the price is in overbought and oversold ranges similar to an RSI. These bands also control the take profit signals.
You also have the ability to change the band colors as well as toggle them off, which only affects the view, they are still active which will still fire the take profit signals.
Momentum Indicator
Our indicator offers a momentum filter option that highlights market momentum directly on the candlesticks, identifying periods of bullish, bearish, or consolidation phases. You can enable or disable this filter as needed, providing valuable insights into market conditions.
By default, you will see the candlestick colors represent the momentum direction as green or red, and consolidation periods as white, but the filter on the BUY and SELL signals is not active. The view options and filter can be toggled on and off in the settings.
Buy and Sell Signals
The Logical Trading Indicator V.1 generates buy and sell signals based on a combination of ATR-based filtering, Bollinger Band basis crossover, and optional momentum conditions if selected in the settings. These signals help you make informed decisions about when to enter or exit a trade. You can also enable a consolidation filter to stay out of trades during tight ranges.
Basically a BUY signal fires when the price closes above the basis line, and the price meets or exceeds the ATR multiple from the previous candle length, which is also editable in the settings.
If the momentum filter is engaged, it will not fire BUY signals when in consolidation periods. It works just the opposite for SELL signals.
Take Profit Signals
We've integrated a Take Profit feature that helps you identify points to exit your trades with profits. The indicator marks Long Take Profit when prices close below the upper zone line of the Bollinger Bands after the previous candle closes inside the band, suggesting an optimal point to exit a long trade or consider a short position.
Conversely, Short Take Profit signals appear when prices close above the lower zone after the previous candle closes inside of it, indicating the right time to exit a short trade or contemplate a long position.
Alerts for Informed Trading
The Logical Trading Indicator V.1 comes equipped with alert conditions for buy signals, sell signals, take profit points, and more. Receive real-time notifications to your preferred devices or platforms to stay updated on market movements and trading opportunities.

PhantomFlow TrendDetectorThe TrendDetector calculates waves on the chart using the built-in ZigZag indicator and detects a trend change after the last high/low update occurs in a minimum sequence of non-updated highs/lows. This assumes a continuation of the trend for the subsequent update of the remaining high/low.
For trend determination:
When you see a pink or light yellow trend color, it means that a new trend may potentially be emerging right now, and you can join it almost at the beginning. So, if you see patterns from your trading system aligning with the TrendDetector indicator and they have the same direction, it further increases the likelihood of your plan working out.
In the case where the trend phase has a red or green color, it may indicate that the primary market impulse has already occurred, and therefore, joining the trend at this time may not be advisable.
For trade entry:
Additionally, you can use the indicator specifically for entering the market using market orders. Depending on the timeframe (the smaller the timeframe, the more confirmation candles are needed), you can open a trade when one trend replaces another at the close, for example, the second candle in the case of a 10-minute timeframe. Stop-loss can be placed under the signal candle, a local peak, or a reversal trend valley, a global peak, or a reversal trend valley. In the example above, the second option was used.
Settings
You cannot technically adjust anything in this indicator because all the logic is hardcoded. However, for a better chart visualization, after adding it to the chart, click on the three dots next to the indicator name, select "Visual order," and then "Bring to front".

Momentum Memory Indicator
The Momentum Memory Indicator (MMI) is a custom tool designed to predict future price movements based on the historical momentum of an asset. By calculating the Rate of Change (ROC) and then averaging it over a specified "memory" period, the MMI provides a prediction that reflects both recent and slightly older momentum data. The prediction is visualized as a histogram, with colors indicating the direction of the momentum.
**Parameters:**
1. **Rate of Change Period (ROC Period):** This parameter sets the period for the Rate of Change calculation, which measures the momentum of the asset. The default value is 14.
2. **Memory Period:** This parameter determines the period over which the average momentum is calculated. By considering momentum over this "memory" period, the indicator aims to provide a more stable and reliable prediction. The default value is 5.
**Logic:**
1. **Rate of Change (Momentum):** The ROC is calculated based on the asset's closing prices over the specified ROC period. It provides a measure of how much the price has changed over that period, indicating momentum.
2. **Average Momentum:** The average momentum is calculated by taking a simple moving average (SMA) of the ROC values over the memory period. This smoothens out the momentum data and provides a more stable value for prediction.
3. **Prediction:** The prediction is calculated by adjusting the current closing price based on the average momentum. This gives an estimate of where the price might be in the next period, assuming the momentum continues.
4. **Prediction Color:** The color of the prediction histogram is determined by the direction of the average momentum. A positive momentum results in a green histogram, while a negative momentum results in a red histogram.
**Plots:**
1. **Prediction (Histogram):** Represents the predicted price movement based on the average momentum. The direction and magnitude of the histogram bars provide insights into the expected price change. The color of the bars (green or red) indicates the direction of the momentum.
ATR + Momentum Shifts w/Take ProfitThis script is a technical analysis indicator designed to assist in identifying potential entry points and setting take profit levels in trading. It combines the Average True Range (ATR) indicator, momentum shifts, and customizable take profit levels to provide insights into potential market movements.
Differences from Currently Published Ones:
This script is unique due to its use of a combination of elements:
ATR and Momentum: The script combines the ATR indicator to provide dynamic support and resistance levels with the momentum indicator to identify shifts in the underlying momentum.
Customizable Take Profit Levels: It offers the ability to set take profit levels based on customizable multipliers of the ATR, helping traders manage potential profits.
How to Use:
ATR Bands: The script plots upper and lower ATR bands as potential dynamic support and resistance levels.
Shift Arrows: Arrows are plotted below bars for potential long entry opportunities (green triangle) and above bars for potential short entry opportunities (yellow triangle).
Take Profit Levels: The script also plots take profit levels both above and below the source price based on the ATR multipliers set in the inputs.
Markets and Conditions:
This script can be used across various financial markets, including stocks, forex, commodities, and cryptocurrencies. It's most effective in trending markets where momentum shifts can signal potential reversals or continuation of trends. Traders should consider the following conditions:
Trend Confirmation: Look for momentum shifts in the direction of the prevailing trend for higher probability setups.
Volatility: Higher volatility can amplify ATR movements and subsequently affect the placement of ATR bands and take profit levels.
Risk Management: Always implement proper risk management strategies to protect your capital.
Additional Considerations:
Customization: Traders can adjust input parameters like ATR length, momentum length, and take profit multipliers to match their trading style and market conditions.
Combining with Other Indicators: Consider using this indicator in conjunction with other technical indicators or chart patterns for confirmation.

Standardized MACD Heikin-Ashi TransformedThe Standardized MACD Heikin-Ashi Transformed (St. MACD) is an advanced indicator designed to overcome the limitations of the traditional MACD. It offers a more robust and standardized measure of momentum, making it comparable across different timeframes and securities. By incorporating the Heikin-Ashi transformation, the St. MACD provides a smoother visualization of trends and potential reversals, enhancing its utility for traders seeking a clearer view of the underlying market direction.
Methodology:
The calculation of St. MACD begins with the traditional MACD, which computes the difference between two exponential moving averages (EMAs) of the price. To address the issue of non-comparability across assets, the St. MACD normalizes its values using the exponential average of the price's height. This normalization process ensures that the indicator's readings are not influenced by the absolute price levels, allowing for objective and quantitatively defined comparisons of momentum strength.
Furthermore, St. MACD utilizes the Heikin-Ashi transformation, which involves deriving candles from the price data. These Heikin-Ashi candles provide a smoother representation of trends and help filter out noise in the market. A predictive curve of Heikin-Ashi candles within the St. MACD turns blue or red, indicating the prevailing trend direction. This feature enables traders to easily identify trend shifts and make better informed trading decisions.
Advantages:
St. MACD offers several key advantages over the traditional MACD-
Standardization: By normalizing the indicator's values, St. MACD becomes comparable across different assets and timeframes. This makes it a valuable tool for traders analyzing various markets and seeking consistent momentum measurements.
Heikin-Ashi Transformation: The integration of the Heikin-Ashi transformation smoothes out the indicator's fluctuations and enhances trend visibility. Traders can more easily identify trends and potential reversal points, improving their market analysis.
Quantifiable Momentum: St. MACD's key levels represent the strength of momentum, providing traders with a quantifiable framework to gauge the intensity of market movements. This feature helps identify periods of increased or decreased momentum.
Utility:
The St. MACD indicator offers versatile utility for traders-
Trend Identification: Traders can use the color-coded predictive curve of Heikin-Ashi candles to swiftly determine the prevailing trend direction. This aids in identifying potential entry and exit points in the market.
Reversal Signals: Colored extremes within the St. MACD signal potential price reversals, alerting traders to potential turning points in the market. This assists in making timely decisions during market inflection points.
Overbought/Oversold Conditions: The histogram version of St. MACD can be used in conjunction with the bands to detect short-term overbought or oversold market conditions, allowing traders to adjust their strategies accordingly.
In conclusion, this tool addresses the limitations of the traditional MACD by providing a standardized and comparable momentum indicator. Its incorporation of the Heikin-Ashi transformation enhances trend visibility and assists traders in making more informed decisions. With its quantifiable momentum measurements and various utility features, the St. MACD is a valuable tool for traders seeking a clearer and more objective view of market trends and reversals.
Key Features:
Display Modes: MACD, Histogram or Hybrid
Reversion Triangles by adjustable thresholds
Bar Coloring Methods: MidLine, Candles, Signal Cross, Extremities, Reversions
Example Charts:
-Traditional limitations-
-Comparisons across time and securities-
-Showcase-
See Also:
-Other Heikin-Ashi Transforms-

Momentum Oscillator, Divergences & Signals [TrendAlpha]The "Momentum, Real Time Divergences & Signals " indicator is designed to provide traders with insights into market momentum, identify potential divergences, and generate buy and sell signals. It offers a comprehensive set of features to assist traders in making informed trading decisions.
The indicator starts by calculating the momentum oscillator based on user-defined parameters.
- Traders can adjust the "Length" parameter to customize the sensitivity of the oscillator. The default value is set to 7, but it can be modified according to individual preferences.
- The "Source" parameter allows traders to select the input source for the oscillator calculation, with the default being the closing price of the asset.
- Traders have the option to display divergence lines by switching on the "Show Lines" parameter. This feature helps identify potential divergences between the oscillator and the price.
The oscillator is calculated using a two-step process. First, a smoothing function is applied to the source data using the "sma" (simple moving average) function. Then, the rate of change is computed over the specified length using the "mom" (momentum) function. Positive oscillator values indicate upward momentum, while negative values indicate downward momentum.
The indicator also generates buy and sell signals by identifying bullish and bearish divergences. A bullish divergence occurs when the oscillator is negative and crosses above zero, while a bearish divergence occurs when the oscillator is positive and crosses below zero. The indicator checks for specific conditions to confirm the divergences, such as comparing the current oscillator value with the previous value and validating the corresponding price action.
When a bullish or bearish divergence is detected, the indicator plots circles to highlight these signals on the chart. A green circle indicates a bullish signal, suggesting a potential buying opportunity, while a red circle indicates a bearish signal, suggesting a potential selling opportunity. In addition to circles, the indicator also displays labels to provide further clarity on the signals. A "Buy" label is shown for bullish signals, and a "Sell" label is shown for bearish signals.
To visually represent the divergences, the indicator plots lines connecting the corresponding points on the oscillator. A green line is drawn for bullish divergences, while a red line is drawn for bearish divergences. Traders can easily observe the divergence patterns and their relationships with the price action, aiding them in making trading decisions.
- The indicator also includes alert conditions for both bullish and bearish divergences. Traders can set up alerts to receive notifications when potential divergences occur, allowing them to take timely action.

ATR Momentum [QuantVue]ATR Momentum is a dynamic technical analysis tool designed to assess the momentum of a securities price movement. It utilizes the comparison between a faster short-term Average True Range (ATR) and a slower long-term ATR to determine whether momentum is increasing or decreasing.
This indicator visually represents the momentum relationship by plotting both ATR values as lines on a chart and applying color fill between the lines based on if momentum is increasing or decreasing.
When the short-term ATR is greater than the long-term ATR, representing increasing momentum, the area between them is filled with green.
Conversely, when the short-term ATR is less than the long-term ATR line, the area between them is filled with red. This red fill indicates decreasing momentum.
Don't hesitate to reach out with any questions or concerns.
We hope you enjoy!
Cheers.

ADX Momentum Shaded CandlesDescription:
The "ADX Momentum Shaded Candles" indicator (ADXMSC) is an overlay indicator that enhances candlestick charts by adding shading based on the momentum derived from the Average Directional Index (ADX). This indicator provides visual cues about the strength of bullish and bearish momentum by adjusting the transparency of the candlesticks.
How it Works:
The indicator utilizes the ADX indicator to calculate the values of +DI (Directional Indicator Plus) and -DI (Directional Indicator Minus) based on user-defined parameters. It then determines the transparency levels for the bullish and bearish candlesticks based on the calculated values of +DI and -DI. Higher values of +DI or -DI result in lower transparency levels, while lower values increase transparency.
Transparency Calculation:
The transparency of the bullish and bearish candlesticks is adjusted based on the values of +DI and -DI, which reflect the momentum of the price movement. Transparency is inversely proportional to these values, with higher values resulting in lower transparency. To calculate transparency, the indicator uses the formula 100 minus the value of +DI or -DI multiplied by 2. This ensures that higher values of +DI or -DI produce more opaque candlesticks.
Usage:
To effectively use the "ADX Momentum Shaded Candles" indicator (ADXMSC), follow these steps:
1. Apply the indicator to your chart by adding it from the available indicators.
2. Observe the candlesticks on the chart:
- Bullish candlesticks are represented by the original bullish color with adjusted transparency.
- Bearish candlesticks are represented by the original bearish color with adjusted transparency.
3. Analyze the transparency levels of the candlesticks to assess the strength of bullish and bearish momentum. Less transparent candlesticks indicate stronger momentum, while more transparent ones suggest weaker momentum.
4. Combine the visual information from the shaded candlesticks with other technical analysis tools, such as support and resistance levels, trend lines, or oscillators, to confirm potential trade opportunities.
5. Customize the indicator's parameters, such as the ADX length and smoothing, to suit your trading preferences.
6. Implement appropriate risk management strategies, including setting stop-loss orders and position sizing, to manage your trades effectively and protect your capital.

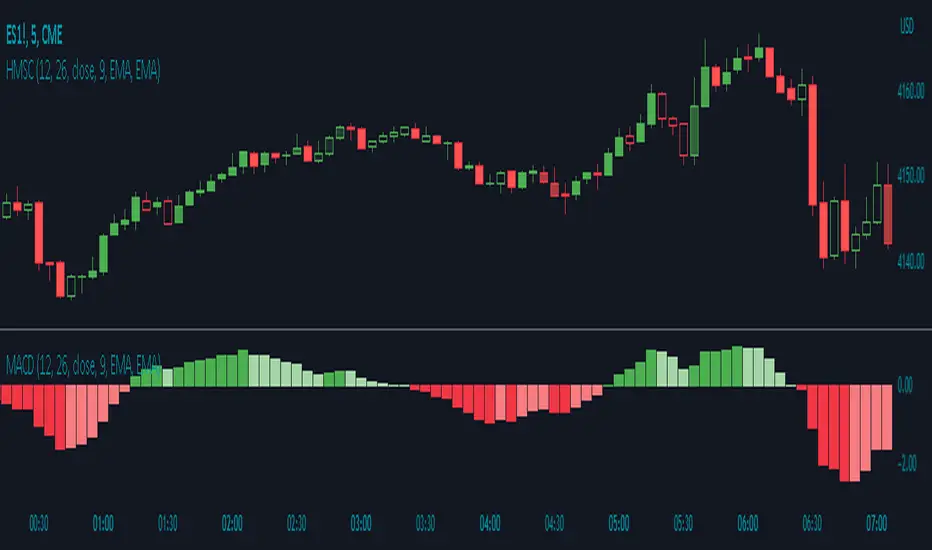
Histogram Momentum Shaded CandlesDescription:
The Histogram Momentum Shaded Candles indicator (HMSC) is a powerful technical analysis tool that combines the concepts of the MACD (Moving Average Convergence Divergence) indicator and shaded candlestick visualization. It provides insights into momentum and trend strength by representing the MACD histogram as shaded candles on the chart.
How it Works:
The HMSC indicator calculates the MACD (Moving Average Convergence Divergence) using user-defined parameters such as the fast length, slow length, source, signal smoothing, and moving average types. It then calculates the MACD histogram by subtracting the signal line from the MACD line. The indicator transforms the histogram values into transparency levels for the shaded candles, representing bullish and bearish momentum.
Usage:
To effectively utilize the Histogram Momentum Shaded Candles indicator, follow these steps:
1. Apply the HMSC indicator to your chart by adding it from the available indicators.
2. Customize the MACD settings such as the fast length, slow length, source, signal smoothing, and moving average types according to your trading preferences.
3. Observe the shaded candles plotted on the chart:
- Bullish shaded candles (green by default) indicate positive momentum and potential buying pressure.
- Bearish shaded candles (red by default) indicate negative momentum and potential selling pressure.
4. Assess the intensity of the shaded candles:
5. Shading intensity is determined by the magnitude of the MACD histogram, with higher values resulting in more opaque candles.
6. The shading intensity reflects the strength of momentum and can help identify significant shifts in price action.
7. Combine the analysis of shaded candles with traditional candlestick patterns, trend lines, support and resistance levels, and other technical indicators to validate potential trade setups.
8. Implement appropriate risk management strategies, including setting stop-loss orders and position sizing, to manage your trades effectively and protect your capital.
Colorful Moving Averageswhat is Colorful Moving Averages?
This indicator allows you to use your favorite moving averages in their advanced form.
what it does?
It gives you easy access to the following information with a single indicator: the direction and momentum of the price,
rate of change of momentum (acceleration),
time-dependent change in momentum,
and all the other information a moving average provides.
it paints the selected moving average type according to the momentum it has, and also shows the momentum and acceleration values in a table. colors are interpreted as follows: the color of the moving average is red, the momentum is negative; A green color means the momentum is positive, and a yellow color means the momentum is 0. As the momentum changes, the moving average takes on different shades of these 3 colors. how it actually works can be easily understood at a glance.
"Δ" sign indicates momentum compressed between 100 and -100.
"Γ" sign indicates the momentum of the momentum, that is the acceleration. its values are compressed between 100 and -100.
how it does it?
it uses this formulas:
how to use it?
First, select the moving average type you want to use. then set the length and source. Now, with a single indicator, you can observe both the distance of the price from the mean, its instantaneous momentum relative to the last candle by looking at the symbol "Δ", the current change of momentum by looking at the symbol "Γ", and the time-dependent change in its momentum by looking at the colors. you can also see the maximum and minimum points where the momentum is equal to 0.

Multi indicators tableThis is a comprehensive trading tool that presents an overview of the market in a tabular format. It consists of five distinct categories of trading indicators : Volatility, Trend, Momentum, Reversal, and Volume. Each category includes a series of indicators that are widely used in the trading communauty.
The Volatility category includes the Average True Range (ATR) and Bollinger Bands indicators. The Trend category comprises the Average Directional Index (ADX), four Exponential Moving Averages (EMAs), Aroon, Parabolic SAR, and the Supertrend. The Momentum category includes the Stochastic Relative Strength Index (StochRSI), Money Flow Index (MFI), Williams %R, Relative Strength Index (RSI), and Commodity Channel Index (CCI). The Reversal category includes Parabolic SAR, Moving Average Convergence Divergence (MACD), and PP Supertrend. Finally, the Volume category includes the Volume Exponential Moving Average (EMA) indicator.
The indicators states are easily readable, the indicator case is colored based on his actual state. A bullish color (green by default), a bearish color (red by default),
a very bullish color (dark green by default), a very bearish color (dark red by default) and a neutral color (gray by default) displayed when the indicator doesn't give us a clear signal. Some indicators do not have a very bullish or very bearish state. Concerning volatility indicators, the bullish color indicates high volatility, the bearish color indicates low volatility, and the neutral color indicates normal volatility.
Most of the indicators displayed in the table are customizable, and traders can choose to hide the categories they don't want to use. The Indicator provides a quick and easily readable view on the market and allows traders to reduce the number of indicators on their chart making it lighter and more readable.

Dynamo
╭━━━╮
╰╮╭╮┃
╱┃┃┃┣╮╱╭┳━╮╭━━┳╮╭┳━━╮
╱┃┃┃┃┃╱┃┃╭╮┫╭╮┃╰╯┃╭╮┃
╭╯╰╯┃╰━╯┃┃┃┃╭╮┃┃┃┃╰╯┃
╰━━━┻━╮╭┻╯╰┻╯╰┻┻┻┻━━╯
╱╱╱╱╭━╯┃
╱╱╱╱╰━━╯
Overview
Dynamo is built to be the Swiss-knife for price-movement & strength detection, it aims to provide a holistic view of the current price across multiple dimensions. This is achieved by combining 3 very specific indicators(RSI, Stochastic & ADX) into a single view. Each of which serve a different purpose, and collectively provide a simple, yet powerful tool to gauge the true nature of price-action.
Background
Dynamo uses 3 technical analysis tools in conjunction to provide better insights into price movement, they are briefly explained below:
Relative Strength Index(RSI)
RSI is a popular indicator that is often used to measure the velocity of price change & the intensity of directional moves. RSI computes the relative strength of the current price by comparing the security’s bullish strength versus bearish strength for a given period, i.e. by comparing average gain to average loss.
It is a range bound(0-100) variable that generates a bullish reading if average gain is higher, and a bullish reading if average loss is higher. Values over 50 are generally considered bullish & values less than 50 indicate a bearish market. Values over 70 indicate an overbought condition, and values below 30 indicate oversold condition.
Stochastic
Stochastic is an indicator that aims to measure the momentum in the market, by comparing most recent closing price of the security to its price range for a given period. It is based on the assumption that price tends to close near the recent high in an up trend, and it closes near the recent low during a down trend.
It is also range bound(0-100), values over 80 indicate overbought condition and values below 20 indicate oversold condition.
Average Directional Index(ADX)
ADX is an indicator that can quantify trend strength, it is derived from two underlying indices, known as Directional Movement Index(DMI). +DMI represents strength of the up trend, and -DMI represents strength of the down trend, and ADX is the average of the two.
ADX is non-directional or trend-neutral, which means, it does not follow the direction of the price, instead ADX will rise only when there is a strong trend, it does not matter if it’s an up trend or a down trend. Typical ranges of ADX are 25-50 for a strong trend, anything below 25 is considered as no trend or weak trend. ADX can frequently shoot upto higher values, but it generally finds exhaustion levels around the 60-75 range.
About the script
All these indicators are very powerful tools, but just like any other indicator they have their limitations. Stochastic & ADX can generate false signals in volatile markets, meaning price wouldn’t always follow through with what’s being indicated. ADX may even fail to generate a signal in less volatile markets, simply because it is based on moving averages, it tends to react slower to price changes. RSI can also lose it’s effectiveness when markets are trending strong, as it can stay in the overbought or oversold ranges for an extended period of time.
Dynamo aims to provide the trader with a much broader perspective by bringing together these contrasting indicators into a single simplified view. When Stochastic becomes less reliable in highly volatile conditions, one can cross validate their deduction by looking at RSI patterns. When RSI gets stuck in overbought or oversold range, one can refer to ADX to get better picture about the current trend. Similarly, various combinations of rules & setups can be formulated to get a more deterministic view, when working with either of these indicators.
There many possible use cases for a tool like this, and it totally depends on how you want to use it. An obvious option is to use it to trigger signals only after it has been confirmed by two or more indicators, for example, RSI & Stochastic make a great combination for cross-over or cross-under strategies. Some of the other options include trend detection, strength detection, reversals or price rejection points, possible duration of a trend, and all of these can very easily be translated into effective entry and exit points for trades.
How to use it
Dynamo is an easy-to-use tool, just add it to your chart and you’re good to start with your market analysis. Output consists of three overlapping plots, each of which tackle price movement from a slightly different angle.
Stochastic: A momentum indicator that plots the current closing price in relation to the price-range over a given period of time.
Can be used to detect the direction of the price movement, potential reversals, or duration of an up/down move.
Plotted as grey coloured histograms in the background.
Relative Strength Index(RSI): RSI is also a momentum indicator that measures the velocity with which the price changes.
Can be used to detect the speed of the price movement, RSI divergences can be a nice way to detect directional changes.
Plotted as an aqua coloured line.
Average Directional Index(ADX): ADX is an indicator that is used to measure the strength of the current trend.
Can be used to measure how strong the price movement is, both up and down, or to establish long terms trends.
Plotted as an orange coloured line.
Features
Provides a well-rounded view of the market movement by amalgamating some of the best strength indicators, helping traders make better informed decisions with minimal effort.
Simplistic plots that aim to convey clean signals, as a result, reducing clutter on the chart, and hopefully in the trader's head too.
Combines different types of indicators into a single view, which leads to an optimised use of the precious screen real-estate.
Final Note
Dynamo is designed to be minimalistic in functionality and in appearance, as it is being built to be a general purpose tool that is not only beginner friendly, but can also be highly-configurable to meet the needs of pro traders.
Thresholds & default values for the indicators are only suggestions based on industry standards, they may not be an exact match for all markets & conditions. Hence, it is advisable for the user to test & adjust these values according their securities and trading styles.
The chart highlights one of many possible setups using this tool, and it can used to create various types of setups & strategies, but it is also worth noting that the usability & the effectiveness of this tool also depends on the user’s understanding & interpretation of the underlying indicators.
Lastly, this tool is only an indicator and should only be perceived that way. It does not guarantee anything, and the user should do their own research before committing to trades based on any indicator.

Trend and Momentum DashboardI created this indicator to tell me when it's time to trade (going long) and when it's time to wait (or going short).
You can enter up to 13 ticker (default is S&P500 and key market segments).
For each ticker, fibonacci levels are calculated and represented either in 5 color or 3 color mode as single lines.
(Thanks to eykpunter for the fibonacci level implementation. I'm using his code and modified it slightly).
Color coding (5 color mode) explanation:
blue = in uptrend area
light blue = in prudent buyers area
gray = in center area
light red = in prudent sellers area
red = in downtrend area
The topline is a combination of all ticker and shows if the market is either bullish or bearish (threshold adjustable in settings)
The bullish/bearish trend can also be used as background color. Alternatively the last bar in the selected time period is been highlighted.
How to use it:
The indicator works on all timeframes. Use the color coding explanation above to see the status of each asset.
a) You can evaluate "long" term trend using day or week timeframe. e.g. I'm usually trading only long and stay out of the market when it is not bullish (top line & background = blue). I'm also using it to know which segments/assets are currently "hot".
b) You can evaluate short term momentum (using 1h or lower timeframe) and see in which direction the market/assets are moving. e.g. I use this when the exchanges open to see how the day is going to move.
I've attached 3 examples in the screenshot - first is the default, in the second one I'm using different asset classes and the third one is for crypto.
Limitations:
There are security request limits as well as string limitations for the security calls in pine script, so I went to the maximum what is currently possible.
(No financial advise, for testing purposes only)

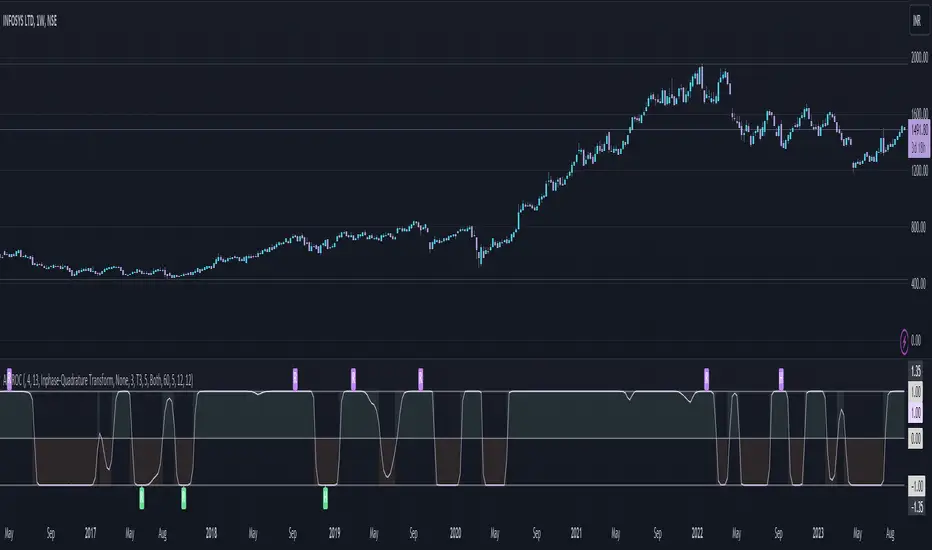
Adaptive Fisherized ROCIntroduction
Hello community, here I applied the Inverse Fisher Transform, Ehlers dominant cycle determination and smoothing methods on a simple Rate of Change (ROC) indicator
You have a lot of options to adjust the indicator.
Usage
The rate of change is most often used to measure the change in a security's price over time.
That's why it is a momentum indicator.
When it is positive, prices are accelerating upward; when negative, downward.
It is useable on every timeframe and could be a potential filter for you your trading system.
IMO it could help you to confirm entries or find exits (e.g. you have a long open, roc goes negative, you exit).
If you use a trend-following strategy, you could maybe look out for red zones in an in uptrend or green zones in a downtrend to confirm your entry on a pullback.
Signals
ROC above 0 => confirms bullish trend
ROC below 0 => confirms bearish trend
ROC hovers near 0 => price is consolidating
Enjoy! 🚀
Crypto-DX Crypto Directional Index [chhslai]Crypto-DX can be used to help measure the overall strength and direction of the crypto market trend.
Furthermore, it can be used as a screener to find out cryptocurrencies which are accumulating momentum and tends to potentially pump or dump.
How this indicator works :
If the Crypto-DX cross above the zero-level, it could be an indication that there is a trend reversal into upward. You should close your short position or place a long order right away.
If the Crypto-DX cross below the zero-level, it could be an indication that there is a trend reversal into downward. You should close your long position or place a short order right away.
If the Crypto-DX is consolidated around the zero-level, it could be an indication that the trend may be ended and followed by a sideway market. You are suggested not to place any order and wait for the market moves.
Divergence based trading strategy is fully applicable, just like the MACD.
Screener features :
Plot "Crypto Index" and "5 Custom Crypto"
Plot "Crypto Index" and "Top 30 Crypto"

Trend Surfers - Momentum + ADX + EMAThis script mixes the Lazybear Momentum indicator, ADX indicator, and EMA.
Histogram meaning:
Green = The momentum is growing and the ADX is growing or above your set value
Red = The momentum is growing on the downside and the ADX is growing or above your set value
Orange = The market doesn't have enough momentum or the ADX is not growing or above your value (no trend)
Background meaning:
Blue = The price is above the EMA
Purple = The price is under the EMA
Cross color on 0 line:
Dark = The market might be sideway still
Light = The market is in a bigger move

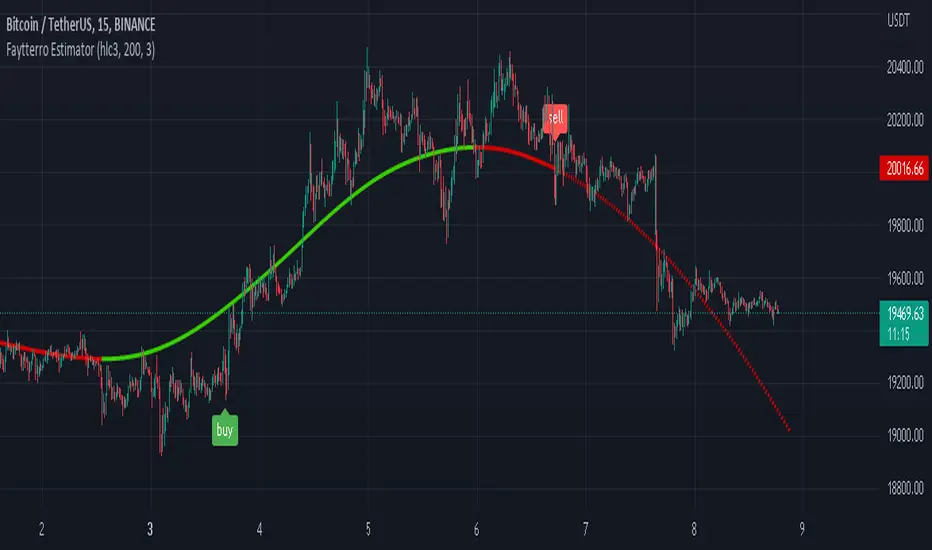
Faytterro EstimatorWhat is Faytterro Estimator?
This indicator is an advanced moving average.
What it does?
This indicator is both a moving average and at the same time, it predicts the future values that the price may take based on the values it has taken before.
How it does it?
takes the weighted average of data of the selected length (reducing the weight from the middle to the ends). then draws a parabola through the last three values, creating a predicted line.
How to use it?
it is simple to use. You can use it both as a regression to review past prices, and to predict the future value of a price. uptrends are in green and downtrends are in red. color change indicates a possible trend change.
Trend Friendly RSITrend Friendly RSI
Unlike the standard RSI, "Trend Friendly RSI" adapts to the trend. RSI and other momentum-based oscillators cannot give a buy signal in uptrends and a sell signal in downtrends because they do not take into account the momentum of the trend and behave as if the price is in a constant sideways trend. "Trend Friendly RSI", on the other hand, takes into account the momentum of the trend of your chosen length and subtracts it from the current momentum, thus giving more realistic buy and sell signals.
use it to identify your long-term investments and trading entry points for hodl. It would be wise to use this indicator for assets that you have done fundamental analysis and are sure of the trend direction. it doesn't know what the price will do, it just shows the points that are suitable for you.
remember this indicator will fail in horizontal trends.

On Balance Volume DeviationThe objective of this indicator is to be a leading indicator that can detect a large price change before it happens. It is based on the On Balance Volume (OBV) indicator, which is a leading indicator based on the premise that a large change in volume often precedes a large price change. This indicator charts the N-Period deviation of the OBV data and displays it as a histogram. This is overlayed on an area chart of the M-Period SMA of the histogram data. This combination helps to visually enhance the pattern that signifies that a jump in price is about to happen.
Useage:
When the histogram bars are above the area plot, then a jump in price is about to happen
As with all leading indicators, there are a lot of false signals. Confirm with price action or another indicator
The further the histogram bars are above the area plot, the larger the predicted jump in price
It seems to work better on shorter intraday timeframes than on the longer timeframes
At the close of a market session, it is a good indicator of how much the price will jump on the opening of the next market session.

Neo's %KIn my opinion the %K is the only part of the stochastic that you actually need. It's the fast RSI, so it responds much better to large price movements and reveals divergence a lot sooner than %D. The %D has no real confluence with the rest of my strategy so, I only use %K.

Momentum Scalping & Swing Signals With AlertsThis Momentum indicator shows a green or red ribbon when smoothed momentum is bullish or bearish. It also includes a long moving average for overall trend confirmation. Wait until the ribbon holds above or below the long moving average and take positions in that direction.
To get an easier to read momentum indicator, I smoothed the momentum out and paired it next to a short term RMA. These two together form the ribbon that will show you early reversals and trend direction. The long moving average is used as an overall trend detector and confirmation for longer term trends.
***HOW TO USE***
Scalping: Enter longs when the ribbon turns green and enter shorts when the ribbon turns red. Exit positions when the ribbon turns the opposite color or crosses the long moving average.
Swing Trading: When the ribbon holds above the long moving average or breaks out and retests it, look for long positions and exit when the ribbon turns red or crosses the long moving average. When the ribbon holds below the long moving average or breaks down and retests it, look for short positions and exit when the ribbon turns green or crosses the long moving average.
***DETAILS***
This indicator gives early reversal signals very well and waiting for the momentum ribbon to cross the long moving average helps to get you into positions when the market is ready to really move while filtering out some of the noise.
The ribbon and background will change to green or red depending on whether it is currently bullish or bearish.
There is also a label that changes colors and tells you if momentum is bullish or bearish and also whether the momentum ribbon is above or below the long moving average.
Green or red circles will appear on the indicator when there is a bullish or bearish cross of the momentum ribbon and the long moving average.
It includes alerts that trigger when momentum is turning bullish/bearish or when the momentum ribbon is crossing the long moving average.
***CUSTOMIZATION***
Each piece of this indicator can be customized to suit your preferences including the momentum source, length, smoothing length, short moving average length and long moving average length. You can also turn off the labels, signals and long moving average. All of these settings can be managed within the indicator settings input tab.
***MARKETS***
This indicator can be used as a signal on all markets, including stocks, crypto, futures and forex.
***TIMEFRAMES***
This Momentum Scalping & Swing Signals indicator can be used on all timeframes.
***TIPS***
Try using numerous indicators of ours on your chart so you can instantly see the bullish or bearish trend of multiple indicators in real time without having to analyze the data. Some of our favorites are Trend Friend Scalp & Swing Trade Signals, Volume Spike Scanner, Buy & Sell Pressure Volume Profile, and RSI Scalper in combination with this momentum indicator. They all have real time Bullish and Bearish labels as well so you can immediately understand each indicator's trend.

Accelerating Dual Momentum ScoreThis is a score metric used by the Accelerating Dual Momentum strategy.
According to the website you referenced when you created, the strategy is as follows:
Strategy Rules
This strategy allocates 100% of of the portfolio to one asset each month.
1. On the last trading day of each month, calculate the “momentum score” for the S&P 500 ( SPY ) and the international small cap equities (SCZ). The momentum score is the average of the 1, 3, and 6-month total return for each asset.
2. If the momentum score of SCZ > SPY and is greater than 0, invest in SCZ.
3. If the momentum score of SPY > SCZ and is greater than 0, invest in SPY .
4. If neither momentum score is greater than 0, calculate the 1-month total return for long-term US Treasuries ( TLT ) and US TIPS (TIP). Invest in whichever has the higher return.
Source: portfoliodb.co
