Lunar Phases AdvancedHigh Precision Lunar Phases Advanced Indicator
Our Beautiful Companion in the Night:
At New Moon, the Moon sits between Earth and the Sun. The Near side is completely dark, so the Moon is unseen (except during a solar eclipse). At Full Moon, the Near side of the Moon is on the opposite side of Earth from the Sun, so sunlight hits the entire face we see—creating that big, beautifully bright Ball in the night sky. Due to tidal locking, we never see the Far side of the moon from Earth's surface.
Right after New Moon, a thin Waxing Crescent appears low in the western sky at dusk, growing into the half-lit First Quarter, then a bulging Waxing Gibbous until reaching Full Moon which rises exactly as the Sun sets. After Full, it shrinks through Waning Gibbous, Last Quarter (half-lit visible in the early morning sky), finishing with a Waning Crescent (thin sliver again) just before disappearing at dawn for the next New Moon.
The Moon’s orbit is elliptical, so its distance from Earth varies. When Full and near Perigee(closest approach) it appears larger and up to 30% brighter leading way to the name, Super Moon. Near Apogee(farthest distance) the Moon will look smaller and dimmer, or Micro Moon. These extreme alignments tend to cluster in "seasons" because the point of closest approach slowly drifts around the orbit, completing a full cycle every 18.6 years.
Chart zoomed out to highlight the seasonal Super Moon behavior:
This indicator places markers on your chart for every New/Full Moon. Super Moon events use larger circles, Micro Moon events use smaller ones (both optional based on distance at event). There are background colors for Apogee and Perigee events, with optional diamond markers.
Chart with Full/New Moon markers and phase background colors:
Extended Functionality
This advanced version builds on the core Phase detection by adding Lunar orbit extremes with event tilt values:
Precise Perigee (closest approach) and Apogee (farthest away) markers optionally appear as red diamonds above the bar for Perigee and green diamonds below for Apogee.
Background tint shows whether the Moon is currently approaching Perigee (cyan shade) or Apogee (violet shade), giving instant visual context for distance expansion and contraction.
Chart with Apogee/Perigee markers and approaching background colors:
Accuracy:
New and Full Moon times are typically within ±few minutes
Distances are typically within ±10–100 km
Tilt values are typically within ±0.01° of astronomically true.
The Info Table expands to three columns:
Current — live phase name and live geocentric distance
Next Phase — upcoming New or Full Moon, countdown timer, and expected distance
Next Extreme — upcoming Perigee or Apogee, countdown timer, and expected distance
Settings:
Thresholds group:
"Full"/"New" checkboxes turn SuperMoon and MicroMoon individually on or off for each
Distance inputs let you set your own km cutoffs for what counts as super or micro (defaults are common values around 369,000 km and 405,000 km)
Start Date and End Date control the time range the script scans for events (default 2010–2028)
BackGround Color group:
"Current Phase" checkbox turns the Waxing/Waning background colors on or off
Color pickers let you choose your own Waxing (default purple shade) and Waning (default blue shade)
"Approaching" checkbox turns the Apogee/Perigee background colors on or off
Color pickers let you choose your own Perigee (default cyan shade) and Apogee (default violet shade)
Information group:
"Show Info Table" turns the top-right panel on or off
"(New/Full)" checkbox adds detailed labels directly on New/Full bars with user selected time-zone, distance, and Lunar tilt from Earths Ecliptic
"(Peri/Apo)" checkbox adds detailed labels directly on Peri/Apo bars with user selected time-zone, distance, and Lunar tilt from Earths Ecliptic
Drop down time-zone for label
Powered by multiple 50-term approximations of the ELP2000-82B lunar theory.
Disclaimer: The script was developed with assistance from Grok 4.1, always under human supervision and decision-making.
月相指標

Lunar Phases & DistanceHigh Precision Lunar Phases & Distance Indicator
Our Beautiful Companion in the Night:
At New Moon, the Moon sits between Earth and the Sun. The side facing us is completely dark, so the Moon is invisible (except during a solar eclipse). At Full Moon, the Moon is on the opposite side of Earth from the Sun, so sunlight hits the entire face we see—creating that big, beautifully bright Ball in the night sky.
Right after New Moon, a thin Waxing Crescent appears low in the western evening sky, growing into the half-lit First Quarter, then a bulging waxing gibbous until reaching Full Moon. After Full, it shrinks through Waning Gibbous, Last Quarter (half-lit visible in the morning sky), finishing with a Waning Crescent (thin sliver again) just before disappearing at the next New Moon.
The Moon’s orbit is elliptical, so its distance from Earth varies. When Full and near Perigee(closest approach) it appears larger and up to 30% brighter leading way to the name, Super Moon. Near Apogee(farthest distance) the Moon will look smaller and dimmer, or Micro Moon. These extreme alignments tend to cluster in "seasons" because the point of closest approach slowly drifts around the orbit, completing a full cycle every 18.6 years.
This indicator places clear markers on your chart for every exact New and Full Moon. Super Moon events use larger circles, Micro Moon events use smaller ones (both optional based on distance at event).
Chart zoomed out to highlight the seasonal behavior:
Accuracy:
New and Full Moon times are typically within ±few minutes & Distances are typically within ±10–100 km of astronomically true.
A small info table sits in the top-right corner and shows:
Current phase name (e.g., "Waxing Gibbous" or "Super Full Moon")
Live geocentric distance to the Moon right now
Name of the next New or Full Moon, with a countdown timer (days:hours:minutes)
Expected distance at that upcoming event
Settings
Thresholds group:
Two "Enable" checkboxes completely turn supermoon and micromoon highlighting on or off
Distance inputs let you set your own km cutoffs for what counts as super or micro (defaults are common values around 367,000 km and 405,000 km)
Start Date and End Date control the time range the script scans for events (default 2010–2028)
BackGround group:
"Current Phase" checkbox turns the waxing/waning background colours on or off
Colour pickers let you choose your own waxing (default soft purple) and waning (default soft blue) shades
Information group:
"Show Info Table" turns the top-right panel on or off
"(New/Full)" debug checkbox adds detailed labels directly on New/Full bars with exact UTC time and distance (useful for verification)
Powered by the open-source (telephonejack/LunarSolver/1) library using multiple 50-term approximations of the ELP2000-82B lunar theory.
Disclaimer: The script was developed with assistance from Grok 4.1, always under human supervision and decision-making.

LunarSolverLunarSolver Library
Implements analytical approximations from Éphéméride Lunaire Parisienne (ELP2000-82B) lunar theory (Chapront-Touzé & Chapront). Uses truncated Fourier series of the main problem in Delaunay arguments D, l, l', F.
Exported functions:
delta_t(t_ms) → ΔT (seconds); polynomial fit valid ~1950–2050.
julian_day_tt(t_ms) → JD in Terrestrial Time from UTC millisecond timestamp.
jde_tt_to_utc_ms(jde_tt) → Approximate UTC millisecond timestamp from JD TT.
elp_true_distance_km_50(jd_tt) → Geocentric distance (km); 50 largest-amplitude terms.
elp_new_moon_solver_50(k) → JDE TT of new moon nearest lunation number k (k=0 ≈ 2000-01-06); 50-term longitude series + Newton-Raphson iteration (convergence <0.005 days).
elp_full_moon_solver_50(k) → JDE TT of full moon nearest k (k=0 ≈ 2000-01-21); 50-term longitude series + nutation correction + damped iteration (convergence <0.001 days).
Accuracy (truncation-limited):
- Distance: typically ± 10 - 100 km.
- Syzygy times: typically ± few minutes.
Import:
import telephonejack/LunarSolver/1 as lunar
Usage examples:
//@version=6
indicator("Lunar Distance Demo")
float jd_tt = lunar.julian_day_tt(time)
float dist_km = lunar.elp_true_distance_km_50(jd_tt)
plot(dist_km, "Distance (km)")
// Approximate lunation k for current bar
float k_approx = (lunar.julian_day_tt(time) - 2451550.25977) / 29.530588861
int k = math.round(k_approx)
float new_jde = lunar.elp_new_moon_solver_50(k)
float full_jde = lunar.elp_full_moon_solver_50(k)
Coefficients: top 50 terms by amplitude from ELP main problem series (radius vector & longitude). Phase solvers use longitude terms only. Library contains no latitude series.
Disclaimer: The library was developed with assistance from Grok 4.1, always under human supervision and decision-making.

Moon Phases 2026-2035Moon Phases 2026–2035
This custom indicator displays moon phases as vertical lines on your chart, allowing traders to observe and study potential relationships between lunar cycles and market behavior.
This indicator is best used on the Daily timeframe. Lunar cycles tend to align more clearly with price action when viewed on daily bars, making it easier to analyze broader market trends and patterns.
Key Features
Moon Phases (2026–2035)
Displays the four major lunar phases — New Moon, First Quarter, Full Moon, and Last Quarter — from 2026 through 2035 , marked clearly with vertical lines on the chart.
Clear Visual Markers
Each moon phase is represented consistently, making it easy to spot potential turning points, volatility changes, or cyclical behavior in price action.
Customizable Display
You can toggle the visibility of individual moon phases (New Moon, First Quarter, Full Moon, Last Quarter) to focus only on the phases you find most relevant.
Why Moon Phases Matter in Trading
Some traders believe lunar cycles can influence market sentiment and price movement. Common interpretations include:
New Moon : Often associated with new beginnings or potential reversals.
Full Moon : Frequently linked to heightened volatility or market extremes.
First Quarter & Last Quarter : May coincide with consolidation phases or momentum shifts.
This indicator allows you to visually align these lunar events with price data, helping you incorporate cyclical analysis into your broader trading approach.
Disclaimer
The information and publications provided by this indicator are not intended to be, and do not constitute, financial, investment, trading, or other types of advice. Always conduct your own analysis and manage risk appropriately.

Moon Phases & Declinations - Chronos Capital [BETA]High-Precision Lunar Cycles: Moon Phases & Declinations (Swiss Ephemeris)
Overview
This indicator provides institutional-grade astronomical data directly on your chart. Unlike standard scripts that use basic sine-wave approximations, this tool implements the **Swiss Ephemeris algorithm**, the gold standard for high-precision celestial calculations.
By tracking the Moon’s phases and its **Maximum/Minimum Declinations**, traders can identify potential "turning points" or "energy shifts" in market volatility often associated with lunar cycles.
---
Key Features
Ultra-High Precision: Calculations are accurate to within *seconds* of time, ensuring that the visual plot aligns perfectly with astronomical reality.
Moon Phase Tracking: Distinct markers for New Moon, Full Moon, and Quarters.
Lunar Declination Peaks: Automatically identifies when the moon reaches its *Maximum North* and *Maximum South* points (Lunar Extremes).
Customizable Visuals: Toggle between background highlights, vertical lines, or plot signals to suit your trading style.
---
Technical Accuracy
This script is built using a ported version of the Swiss Ephemeris
Positional Accuracy: Within 0.1 arcseconds.
Time Accuracy: Within **~1-2 seconds** of official JPL data.
Algorithm: Integration of the *ELP2000-85* lunar theory for maximum reliability over decades of historical data.
---
### **How to Use**
1. **Reversal Zones:** Watch for the Moon’s *Max/Min Declination* points, which often coincide with local tops or bottoms in trending markets.
2. **Volatility Shifts:** Use the *New Moon* and *Full Moon* markers to anticipate periods of increased or decreased market liquidity and volume.
3. **Confluence:** Best used in combination with your existing price action or momentum indicators to add a "time-based" filter to your entries.
*Disclaimer: This tool is for educational and analytical purposes only. Lunar cycles are a study of time-based correlation, not a guaranteed financial signal.*

DHYT Moon Cycles IndicatorThis indicator tracks the moon cycles which seem to correlate with bullish and bearish periods for Cryptocurrency trading. This indicator allows you to calibrate these windows using recent moon phase dates and times. You can also add customizable highlighted bands before and after these events to highlight these bullish and bearish periods.
Created by: Dan Heilman

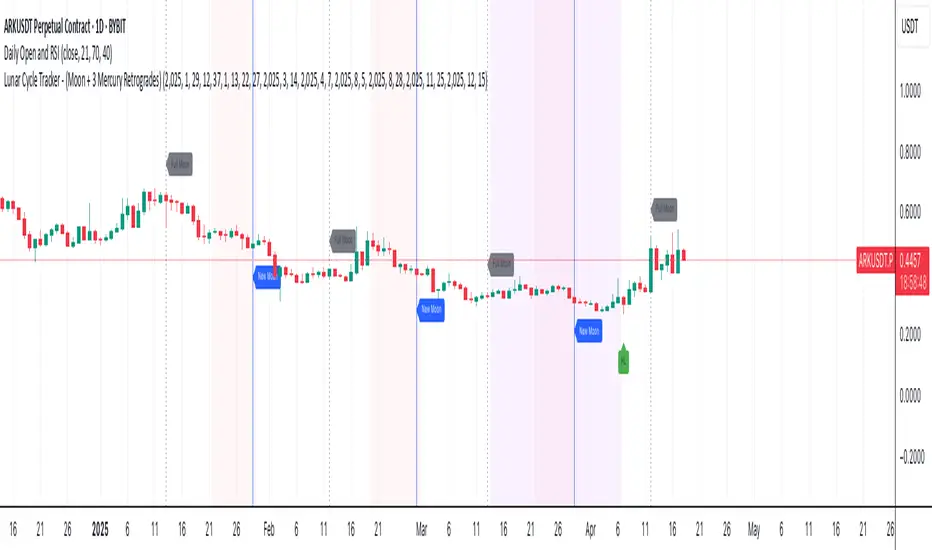
Lunar Cycle Tracker - (Moon + 3 Mercury Retrogrades)This script overlays the lunar and Mercury retrograde cycles directly onto your chart, helping traders visualize natural timing intervals that may influence market behavior.
Key Features:
🌑 New Moon & Full Moon Markers:
Vertical lines and labels indicate new and full moon events each month. You can fully customize their colors.
🌗 Last Quarter Moon Fill:
A soft pink background highlights the last quarter moon phase (from 7.4 days after the full moon to the next new moon).
🪐 Three Mercury Retrograde Zones:
Highlight up to three retrograde periods per year with customizable date inputs and background color. Great for spotting potential reversal or volatility windows.
Customization:
Moon event dates and colors
Manual input for Mercury retrograde periods (year, month, day)
Full compatibility with all timeframes (1H, 4H, daily, etc.)
Great for astro-cycle traders, Gann-based analysts, or anyone who respects time symmetry in the markets.
Fully customizable & works across all timeframes.
This tool was created by AngelArt as part of a larger astro-market model using lunar timing and planetary retrogrades for cycle-based market analysis.
Lunar Cycles Projected Forward; Moon phases into futureProjecting Lunar Cycles/ half-cycles forward in time
User sets the recent Full moon in history to anchor from; Indicator projects 1/2 cycles forward in time
//inputs//
-input number of full lunar cycles to project forward from input full moon time
-choose color/opacity/border color/text display

Moon Phases Strategy 2015 till 2021Moon Phases Strategy
Thank you to Author: Dustin Drummond for allowing me to use his Moon Phase strategy code and modify it. I wanted to test out the accuracy of the moon phase. And I could not have done it without his code
It was created to test the Moon Phase theory compared to just a buy and hold strategy.
It buys on full Moon and sells on the new moon. I also have added the ability to add stop loss and target profit if anyone wants to tinker with it. This strategy uses hard-coded dates from 1/1/2015 until 12/31/2021 only! Any dates outside of that range need to be added manually in the code or it will not work.
I may or may not update this so please don't be upset if it stops working after 12/31/2021.
Feel free to use any part of this code and please let me know if you can improve on this strategy.
Result:
50% accurate using data from 2015 till today.
I find a buy and hold strategy to have outperformed the moon phase.
It does have its value. It might be used as a confluence with other established indicators.

RoboDCARoboDCA is an indicator I developed to help me accrue Bitcoin at its low point. It won't necessarily be at its lowest point but it's low enough that if you dollar cost average for the long term, the difference is negligible. While using this indicator, I find it also suitable for swing trades in the 4H timeframe every once in a while. Might be the indicator to use if you only do 2-5 trades a month last a few days between trades.
The fundamentals of RoboDCA came from these 2 theories:
Bill Williams Balance Line
Moon Phase
Bill Williams Balance Line
Bill Williams is fantastic, a lot of how I see the chart borrows from his books. For this particular case, his balance line is interesting to me because it's a series of highs and lows that are when broken through inspires a powerful move.
Moon Phase
Every month for as long as the moon and earth have danced in the cosmos, the moons gravity affects the earth physically. Some myth and legends like werewolves even came from this cosmic relationship. For prices though it paints a more honest relationship I would say. It is mostly accurate more than 50% of the time that when the moon's light intensity hits 90% or above, its gravity pulls prices to its lower if not lowest point for about 15 days in the past and 15 days in the future. While a new moon with its light intensity at the lowest would present a local peak.
I wasn't sure about this the first time but charts don't lie, they can't. For dollar cost average purposes, this is one of the best way of not just buying blindly into the market.
RoboDCA
Based on the 2 fundamentals above, I tried to create an indicator to help me see price movements and its direction more honestly. What I can say is this indicator tries to tell you if prices are in a good position to buy.
Numbers have always been interesting for me and while developing this indicator I came across an interesting one, number 528 . The number is supposedly an angelic number that communicates wealth and prosperity, sound like my kind of number. I thought to myself, the simplest prove is to just put the number to a moving average indicator. I opted for EMA to keep it close to prices compared to regular MA and I was pleasantly surprised.
As you can see, the EMA line acts as a perfect support and resistance. Breaking up or down the line would start a powerful move to the direction it was breaking at while touching the line through wicks held as strong support and resistance.
The problem I don't enjoy with moving averages is it's hard to measure zones, you'd need to zoom in into the candles to define the zones manually. I wanted something that would define the zones on screen without my intervention. This brought me back to Bill Williams Balance Line, they have highs and lows. The next step was to put the high/low from the balance line and EMA both lines creating a zone.
The zone created fits perfectly to my needs. Now I can see powerful moves before it happens. When a zone has been tested 2 or 3 times, the chances of prices making powerful moves is humongous. This is a zone that is derived from exponential moving averages of the last 528 high and low balance lines, this in itself is a strong indication for direction.
Let's couple the zone with moon phases like what the chart below illustrates.
In this daily chart, the blue upwards arrow represent an opportunity to buy while the red downward arrows represent an opportunity to sell based on Moon Phases. For dollar cost average, you can see that blue arrows that showed up near to the balance line ribbon represent a perfect buy entry, conviction to buy is as strong as it can be.
Although both Moon Phases and the zone should be enough to know when to buy, it doesn't tell a story of how the upcoming move came to be. Someone told me about another angelic number, this time it's number 247 . Let's how this stack up when put both EMA528 and EMA247 together.
It's a sight to behold.
When prices are moving back and forth between the both EMAs, it's telling you that a powerful move is soon coming. Most traders would also know the meaning of crossovers between a slower MA versus a faster MA or the other way around.
Conclusion
This indicator is written to help me dollar cost average, I hope the explanation above is enough to describe to you how to use the indicator opportunistically. I regret that for this indicator I decided to not share its source code. The logic for this indicator is described above which I'm sure can be a base for anyone to write their own version of it.
Above said, I wish everyone a 528 vibe of wealth and prosperity. Cheers!

The Moon█ OVERVIEW
The Moon is a script that is designed to help Traders analyse their charts using the moon. This script consists of three main features :
1. Moon Phases Pro : This is a more powerful version of the default built-in Moon Phases where it would plot both past cycles and Future cycles with a better accuracy.
2. Moon Lines : This plots the moon's longitude into price. you can also select your desired $/degree ( price vs time unit) to make these lines better suited for your chart and the asset your playing with. We also didn't forget to add an option to enable harmonics of these lines. In addition, you can select "reverse" to get the downtrending plants as well.
3. Moon Angles : This allows you to highlight areas where the moon is at X degree. you can get the Moon at zero aris or 180 degrees or any other degree!.
We also added some styling options to help with the visuals.
█ Future Plans and upgrades to this script may include :
1. Enhanced algorithm for a faster loading/processing script.
2. More future dates plotting.
And more! Feel free to contact me with any feature that you would like to see in this script
█ How to use :
1. Open the settings.
2. Enable your desired tool and adjust the settings.
Give the script a few seconds and you should be set. Don't enable more than 2 tools at the same time, but if you want to do that, you can insert the same script twice or more in your chart.
This script is coded as an addon to the Gann ToolBox package/scripts.

[astropark] Moon Phases [alarms]Dear Followers,
today I'm glad to present you an indicator which calculates Moon Phases and let's you set an alert over it.
This is a public free indicator based on the public one by @paaax:
I added my usual alert system logic, plus some more customization inputs for easy coloring.
The lower the timeframe you use it and set your alerts on, the more precise the alert value you get.
Here below the script for backtesting it:
Enjoy!
-- astropark

[astropark] Moon Phases [strategy]Dear Followers,
today I'm glad to present you an indicator which calculates Moon Phases and let's you backtest the simplest strategy over it: buy/sell on full moon and do the opposite on new moon.
This is a public free indicator based on the public one by @paaax:
I added my usual backtesting logic, plus some more customization inputs for easy coloring.
The lower the timeframe you backtest on, the more backtesting data are effective.
Enjoy!
-- astropark

Simple Moon Phases StrategySimple Moon Phases Strategy
This strategy is very basic and needs some filters to improve results. It was created to test the Moon Phase theory compared to just a buy and hold strategy and it did not beat the buy and hold. However, if you flip the entry and exit signals to the opposite signals it performs a lot worse, so there might be some validity to the Moon Phases having an effect on the markets. I might try to add some filters and increase hold times with trailing stops in a separate version.
WARNING: This strategy uses hard-coded dates from 1/1/2015 until 12/31/2021 only! Any dates outside of that range need to be added manually in the code or it will not work. I may or may not update this so please don't be upset if it stops working after 12/31/2021.
Feel free to use any part of this code and please let me know if you can improve on this strategy.
CC - Moon TraderMakes trades based on the moon's elliptical cycle. Only "works" at a 1m, 1h, 1d scale, highly experimental and is only using the crudest orbital math. Please do not use this strategy for anything other than research. At this point, it was just a feasibility test. Let me know your opinions. Thank you.

Moon Phase This Script is calculating the Moon Phase IE full moon and new moon. In the past most of the time during these times the price action does a nice size move either up or down depending on the current trend that we are in. the New Moon and Full Moon are indicated by color and a moon printed on the chart.

Moon CyclesInformative Script for astrological seasonal changes
Equinoxes and Solstices
Full,New,Growing and waning lunar phases
Lunar Maturation counter
Trend coloring from one of my oscillators to give script something more than vanilla calculations and labels
Labels can be customized
Plotting set to absolute
First version is placeholder and will be updated with eclipse tracking,background coloration
Script is for seasonal and lunar study,Its not generating signals
The decay and lunar calculations borrowed from MQL

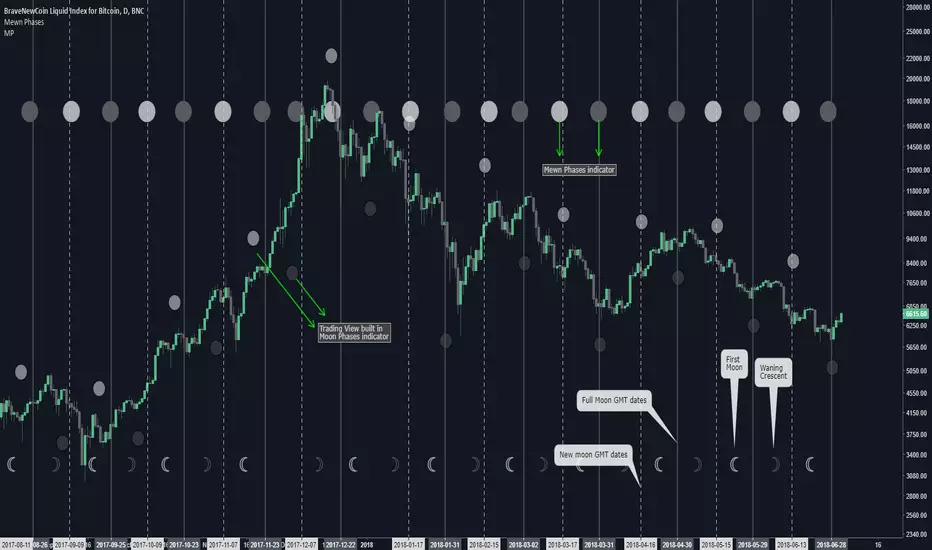
Mewn PhasesPhases of the moon, based on Julian date. Commissioned indicator. Option to highlight the background for the 4 other phases of the moon.
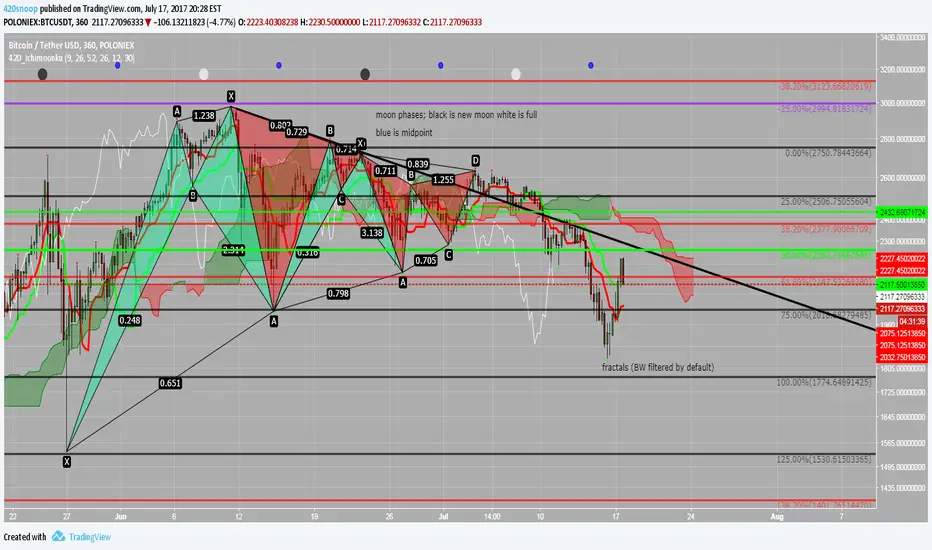
420_IchimoonkuSup all,
Snoop here with another script -- this time it is an ichimoku-type script. The ichimoku system is very powerful and the base script I have chosen to work from is the work of BrainZZ and Chris Moody; I added some alerts based on their signals and recolored to my liking. I suggest using the 'alert once per bar (on close)' if utilizing the alerts for TS crossing KS or the KS slope direction.
This script is great because it includes a moonphase indicator as well. This moonphase indicator was the work of Glaz and I appreciate the work he did on the base script which I have further modified and incorporated into this indicator. New moons are black, full moons are white, and the Q1 and Q3 are shown as blue.
The last thing in this script is the Williams Fractal and Higher High Higher Low fractal recognition. This is the work of JustUncleL and I appreciate the work he has done.
I hope everyone can get some good useage out of this it is packed full of some very powerful tools; feel free to PM me if you need resources on the ichimoku system or check out the education section of ichimoku_trader's posts.
As always good luck and happy trading!
xoxo
-- Snoop