SMT Pro — Multi-Timeframe Divergence (MD)# SMT Pro - Multi-Timeframe Divergence
## What You Get
SMT Pro automatically identifies Smart Money Technique (SMT) divergences across multiple correlated markets, giving you high-probability reversal signals that institutional traders watch.
**Key Benefits:**
- **Automatic Market Correlation** - The indicator intelligently selects correlated pairs (ES/YM, NQ/ES, GC/XAUUSD) based on your chart symbol, or you can specify custom pairs
- **Clean, Actionable Signals** - Only the most relevant divergences are displayed, eliminating noise through intelligent priority filtering
- **Multi-Timeframe Coverage** - From 1-minute scalping to monthly swing trading, all major timeframes are covered
- **Higher Timeframe Priority** - Advanced algorithm ensures higher timeframe signals always take precedence, preventing conflicting signals
- **Professional Visualization** - Clear color-coded lines and labels show exact divergence levels and timeframes
## What Is SMT?
Smart Money Technique (SMT) occurs when two correlated markets move in opposite directions at key turning points. When one market makes a new high/low while its correlated pair fails to confirm, it signals institutional repositioning and potential reversals.
**Example:**
- ES makes a new higher high
- YM makes a lower high (fails to confirm)
- Result: Bearish SMT divergence = potential reversal down
## Features
- **10 Timeframe Controls**: Monthly, Weekly, Daily, 12H, 4H, 1H, 30min, 15min, 5min, 1min
- **Direction Filter**: Choose Bullish, Bearish, or Both signals
- **Symbol Modes**: Automatic correlation detection or manual pair selection
- **Customizable Colors**: Match your chart theme with adjustable bullish/bearish colors
- **Smart Display**: Labels show the timeframe of each divergence
- **Optimized Performance**: Advanced algorithms ensure fast, reliable signal detection
## How To Use
1. **Add to Chart**: Apply SMT Pro to your primary market chart (e.g., ES, NQ, BTC, EUR)
2. **Configure Symbols**:
- **Automatic Mode** (Recommended): The indicator auto-selects correlated pairs
- **Manual Mode**: Specify custom symbol pairs for analysis
3. **Select Timeframes**: Enable/disable timeframes based on your trading style:
- Scalpers: 1min, 5min, 15min
- Day Traders: 15min, 30min, 1H, 4H
- Swing Traders: 4H, 12H, Daily, Weekly
- Position Traders: Daily, Weekly, Monthly
4. **Interpret Signals**:
- **Blue Lines** = Bullish SMT (potential reversal up)
- **Red Lines** = Bearish SMT (potential reversal down)
- **Labels** = Show timeframe and which correlated symbol triggered the divergence
5. **Trade Confirmation**: Use SMT signals with your existing strategy for entry confirmation, stop placement, and profit targets
## Best Practices
- **Higher Timeframes = Higher Probability**: Weekly and Daily SMTs carry more weight than minute-based signals
- **Confluence Is Key**: Multiple timeframe SMTs at the same level increase trade probability
- **HTF Priority System**: The indicator automatically prioritizes higher timeframe signals, reducing visual clutter
- **Wait for Confirmation**: Let price action confirm the divergence before entering
- **Combine With Price Action**: Use SMT with support/resistance, order blocks, and liquidity concepts
## Performance Notes
- **Optimized for Speed**: Proprietary algorithms ensure real-time signal detection without lag
- **Replay Mode Compatible**: Works perfectly with TradingView's bar replay feature
- **Chart Timeframe Adaptive**: Automatically adjusts internal processing based on your chart's timeframe
## Recommended Settings
**For Scalping (1-5min charts):**
- Enable: 1min, 5min, 15min, 30min
- Disable: Higher timeframes
**For Day Trading (15min-1H charts):**
- Enable: 15min, 30min, 1H, 4H
- Disable: 1min, 5min, Monthly
**For Swing Trading (4H-Daily charts):**
- Enable: 4H, 12H, Daily, Weekly
- Disable: Minute-based timeframes
**For Position Trading (Daily+ charts):**
- Enable: Daily, Weekly, Monthly
- Disable: All intraday timeframes
## Symbol Compatibility
**Automatic Mode Supports:**
- **E-mini Futures**: NQ, ES, YM (automatically paired)
- **Micro E-mini Futures**: MNQ, MES, MYM (automatically paired)
- **Gold Markets**: GC, XAUUSD, XAUGBP (automatically paired)
**Manual Mode:**
- Works with any two correlated instruments
- Supports futures, crypto, forex, stocks, indices
- You specify both symbols manually
## Support
For questions or feedback, contact the author through TradingView.
---
**Version**: 6.0.0 PUBLIC
**Release Date**: November 18, 2025
**Author**: Md Modasshir (MD)
*This indicator implements proprietary algorithms for institutional-grade divergence detection. All signal generation logic is optimized for professional trading environments.*
Multitimeframe

Relative Strength TableRelative Strength Table
1. Overview and Key Features
The Relative Strength Table is an indicator that compares multiple tickers against a benchmark (default: SPY) and displays their relative strength.
It is designed to help analyze stock leadership, sector trends, and portfolio performance in one consolidated table.
You can freely input up to 20 tickers from the Inputs panel, allowing flexible comparisons.
(If 20 tickers feel too limited, let me know in the comments — I’ll expand it.)
2. How the RS Percentile Is Calculated and What It Means
The RS Percentile shows how strong the current price ratio is compared to past data, expressed as a percentile rank.
First, the indicator calculates the price ratio by dividing the ticker’s close by the benchmark’s close.
Then, it compares the latest ratio with historical ratio data and determines its percentile value.
Examples:
・80% or higher → relatively strong
・Around 50% → neutral
・40% or below → relatively weak
3. Indicator Features and Customization
3-1. RS Lookback Settings
You can set up to four lookback periods for RS calculation and customize the bar count for each.
Default values are 5, 21, 63, and 126 bars.
You can choose which column to sort by, and the selected column is marked with an asterisk.
Each RS column can be shown or hidden individually via checkboxes.
3-2. Visual Highlight Settings
Relative strength can be color-coded for clarity.
You can freely customize:
・Highlight colors
・Threshold values
・On/off toggles for each highlight layer
3-3. Default Tickers and Reset Function
These 16 sector ETFs are included as the default ticker set:
QQQ, QQQE, RSP, DIA, IWM, XLV, XLE, XLF, XLRE, XLB, XLP, XLU, XLY, XLK, XLC, XLI
You can return to the default list anytime by pressing the refresh button next to the ticker fields.
4. Use Cases and Analysis Examples
4-1. Sector Rotation Analysis
By comparing RS across multiple periods, you can easily identify:
・Sectors gaining short-term strength
・Sectors with steady long-term inflows
A sharp rise in short-term RS may signal the early stages of a rotation.
4-2. Identifying Leaders Within a Sector
You can compare up to 20 tickers at once, making it easy to spot true sector leaders.
4-3. Objective Evaluation of Portfolio Holdings
By entering your portfolio tickers, you can instantly see:
・Whether each name is outperforming or underperforming
・Which timeframes show strength
・How each ticker compares to the benchmark

Multi-Timeframe Trend MA&BB Suite: 6x Moving Averages by Jenn.ioMulti-Timeframe Trend MA & BB Suite: 6x Moving Averages + 5x MTF View by Jenn.io
Indicator Overview
This indicator is a comprehensive, all-in-one trend and volatility tool designed for traders who rely on Moving Averages (MAs) and Bollinger Bands (BBs). It stands out by allowing users to plot up to six fully customized MAs on the current chart, while simultaneously projecting the values of those same MAs from up to five higher timeframes (MTF).
It's the essential tool for top-down analysis and identifying high-probability confluence zones.
Key Features and Customization
1. The Core: 6x MAs and Bollinger Bands: six Independent MAs: Plot up to six separate Moving Averages on your current chart. Each MA is fully customizable in terms of:
Type: Choose from SMA, EMA, SMMA (RMA), WMA, or VWMA.
Source and Length: Set the calculation source (Close, Open, etc.) and the lookback period.
Style: Customize color, thickness, and line style (Solid, Dashed, Dotted).
Integrated Bollinger Bands (BB): Includes standard Bollinger Bands with customization for length, standard deviation, MA type, and the option to enable or disable the band fill color.
2. Advanced: Multi-Timeframe (MTF) Projection
a. 5x MTF Timeframes: The user can enable and fully customize up to five distinct higher timeframes (e.g., Daily, Weekly, Monthly, 4H, 15m).
b. Dynamic MTF Visualization: The indicator fetches the value of the 6 MAs from these higher timeframes and displays them on the current chart using one of three customizable modes:
Extended Mode: Projects the MTF MA value as a continuous line extending to the right, simulating where the MA is moving on the higher chart.
Floating Segment: Draws a short, visible line segment near the current price action, showing the MA value without cluttering the whole chart.
Floating Label: Displays the MA value as a text label anchored to the right of the current bar, providing clean, non-obtrusive data.
Recommended Usage
1. MTF Confluence: Look for instances where the MTF MA lines align closely with the MAs or BBs of your current timeframe. These areas represent strong support/resistance zones.
2. Trend Filter: Use the Extended Mode MTF lines to quickly determine the higher-timeframe trend without changing your chart. For example, if the Daily 200 EMA is above the current price, the bias is bearish.
3. Precision Entries: Use the Floating Label Mode to see the precise MA value from a higher timeframe. This is useful for placing limit orders near key structural levels.

FVG HTF# FVG HTF — Higher‑Timeframe Fair Value Gaps
## Summary
- Plots higher‑timeframe Fair Value Gap (FVG) zones directly on your current chart.
- Tracks fill progress using four methods: Any Touch, Midpoint Reached, Wick Sweep, Body Beyond.
- Shows optional labels with timeframe source and live fill percentage; label text color is configurable.
- Designed for clean overlays and efficient rendering with limits on graphics and bars processed.
## What It Does
- Detects bullish and bearish FVGs from a chosen timeframe (or the chart timeframe) and renders:
- Zone Top/Bottom lines and a dotted midpoint line
- Semi‑transparent area fill between the edges
- Optional label at the midpoint with a tooltip showing zone prices
- Continuously updates zones forward and removes them when the selected fill condition is met.
## Inputs
- `Enable FVG` (`fvgSH2`): Toggle detection/plotting on/off.
- `Timeframe` (`fvgTF2`): Choose `Chart` or HTFs (`5 Minutes`, `15 Minutes`, `1 Hour`, `4 Hours`, `1 Day`, `1 Week`, `1 Month`).
- `Fill Method` (`fvgFill2`):
- Any Touch — wick or body touches any part of the zone
- Midpoint Reached — price reaches at least the 50% of the zone
- Wick Sweep — wick fully travels past the far edge and back inside (conceptually stricter than touch)
- Body Beyond — candle body closes beyond the opposite edge (strong confirmation)
- `Zones` colors (`fvgCb2`, `fvgCs2`): Bullish/Bearish zone colors.
- `Labels` (`fvgLB2`): Show/Hide on‑chart labels.
- `Label Color` (`fvgLBc2`): Color picker for label text (default: white).
- `Max Bars Back` (`maxBars2`): Limits processing to recent bars for performance.
## Timeframe Rules
- The helper `htfTF` prevents selecting a timeframe lower than the chart. If an invalid lower TF is chosen, it falls back to `timeframe.period`.
- Supports minute, daily, weekly, and monthly aggregations that are safe for intraday/daily/weekly charts.
## Detection Logic
- Uses rolling higher‑timeframe bars constructed on the fly and checks 3‑bar displacement patterns:
- Bullish FVG: current HTF low above the high two bars ago AND previous HTF close above that high, with no direct gap condition.
- Bearish FVG: current HTF high below the low two bars ago AND previous HTF close below that low, with no direct gap condition.
- On detection, the script creates an FVG object with:
- Top/Bottom lines (`lnTop`, `lnBtm`) and midpoint line (`lnAvg`)
- Midpoint label (`lbTxt`) showing source timeframe and updating fill percentage
- Semi‑transparent fill (`linefill`) for visual clarity
## Fill Tracking
- Fill threshold depends on selected method:
- Any Touch: opposite edge
- Midpoint Reached: zone’s midpoint
- Wick Sweep: stricter condition conceptually (implemented as an opposite‑edge threshold)
- Body Beyond: requires close beyond the opposite edge
- Each bar updates label x‑position and line endpoints forward; the label text shows the best fill ratio achieved.
- When the threshold is reached, the FVG (label, lines, fill) is removed from the chart.
## Best Practices
- Start with `Any Touch` to visualize broad repairs; switch to `Body Beyond` for conservative confirmations.
- Use `1 Hour` or `4 Hours` overlays on 5m–15m charts for context; `1 Day` on 1H charts; `1 Week` on daily charts.
- Keep labels on when monitoring fills intraday; hide labels for clean higher‑level context.
- Adjust `Max Bars Back` if performance is impacted by many zones.
## Repainting Notes
- HTF zones are computed on `timeframe.change(tf)` and therefore confirm on HTF bar closes.
- Label endpoints extend each bar; detection itself avoids lookahead bias. For strict confirmation, align entries with HTF closes.
## Limitations
- “Wick Sweep” is treated as a stricter touch to the far edge; it does not enforce a separate “return inside” bar state.
- Label text color applies uniformly to bull/bear labels. If you need separate colors per side, contact the author.
## Credits & Version
- Pine Script v6; © rithsilanew2020
## Quick Start
1. Enable FVG and choose your HTF (e.g., `1 Hour`).
2. Pick a Fill Method (start with `Any Touch`).
3. Select zone colors and label text color.
4. Set `Max Bars Back` as needed for performance.
5. Use labels/tooltip values (Top/Mid/Bottom) to plan entries and manage risk.

WeAxes SMC Pro - Complete Trading SystemOverview
WeAxes SMC Pro is a comprehensive trading indicator that combines Smart Money Concepts (SMC) with multi-timeframe trend analysis. This powerful tool helps traders identify high-probability setups by aligning price action, market structure, and momentum across different timeframes.
Key Features
1. Multi-Timeframe Trend Alignment
Dual EMA System: Tracks EMA 5/10 on both current and H1 timeframes
Trend Confirmation: Requires alignment between current TF and H1 TF for optimal setups
Visual Band Display: Colored H1 EMA band (green for bullish, red for bearish)
2. Smart Money Concepts Integration
Support/Resistance Detection: Automatically identifies key H1 swing levels
Break & Retest Logic: Detects institutional order block patterns
Market Structure Analysis: Identifies recent highs/lows for momentum confirmation
3. Advanced Confluence Scoring System
The indicator calculates a comprehensive score (0-12 points) based on:
Trend Alignment (0-4 points): Multi-timeframe EMA alignment
S/R Analysis (0-4 points): Support/resistance breakouts and retests
Volume Confirmation (0-2 points): Volume spike analysis
RSI Momentum(0-2 points): Momentum filter customization
Price Action (0-2 points): Candlestick pattern strength
4. Visual Enhancements
Color-Coded Candles: Automatic candle coloring based on trend alignment
Dynamic S/R Lines**: Recent support/resistance levels plotted on chart
- **Background Highlights**: Visual alerts for strong alignment conditions
Setup & Configuration
Basic Settings (WeAxes SMC Settings)
Show Score Table: Toggle the confluence scoring table
Min Confluence Score: Set minimum score for high-probability alerts (3-10)
Volume Confirmation: Enable/disable volume analysis
RSI Filter: Add momentum confirmation with RSI
Trend Following Settings
H1 EMA Band: Show/hide the H1 trend band
Candle Coloring: Automatic candle coloring based on alignment
RSI Filter Settings: Customize RSI thresholds for bullish/bearish conditions
Smoothing Options: Choose smoothing method for H1 EMAs
How to Use
Step 1: Identify Trend Direction
Look for BULLISH ALIGN or BEARISH ALIGN in the score table
Confirm H1 EMA band color matches your bias (green = bullish, red = bearish)
Step 2: Check Confluence Score
8-12 Points: Perfect setup - strong trend + S/R confluence
5-7 Points: Good setup - moderate confluence
3-4 Points: Weak setup - proceed with caution
0-2 Points: Avoid trade - no clear edge
Step 3: Analyze Market Structure
Support/Resistance Levels: Check plotted S/R lines
Break & Retest: Look for recent breakouts with retest confirmation
Price Action: Strong bullish/bearish candles near key levels
*Step 4: Entry Confirmation
LONG SETUPS:
- Bullish alignment (current + H1)
- Price above key EMA levels
- Support hold or resistance break
- High confluence score (5+)
- Green candle coloring
**SHORT SETUPS:**
- Bearish alignment (current + H1)
- Price below key EMA levels
- Resistance hold or support break
- High confluence score (5+)
- Red candle coloring
Trade Management
Entry Signals
Perfect Setup: Score 8+ with all components aligned
Good Setup: Score 5-7 with strong trend + S/R confluence
Avoid: Near opposite S/R levels or low scores
Risk Management
- Use detected S/R levels for stop loss placement
- Position size based on confluence score strength
- Avoid trades when score table shows "NEAR RES - AVOID" or "NEAR SUP - AVOID"
Exit Strategy
- Monitor for trend alignment changes
- Watch for candle color shifts
- Use subsequent S/R levels for profit targets
Pro Tips**
1. Combine Timeframes: Use H4 for direction, H1 for structure, current TF for entries
2. Volume Matters: High volume on breakouts increases setup validity
3. Patience Pays: Wait for full alignment rather than forcing marginal setups
4. Score First: Let the confluence score guide your trade decisions
5. Practice: Backtest to understand how different score combinations perform
Customization
The indicator is highly customizable:
- Adjust RSI thresholds for different market conditions
- Modify score thresholds based on your risk tolerance
- Toggle visual elements to reduce chart clutter
- Customize colors to match your trading style
⚠️ Disclaimer
This tool is designed to assist with analysis, not replace it. Always combine with proper risk management and market context. Past performance doesn't guarantee future results.

All-in-One RSI & StochRSI: 4x MTF View Matrix by Jenn.ioAll-in-One RSI & StochRSI: 4x MTF View Matrix (Momentum Dashboard) by Jenn.io
Indicator Overview
This indicator is a complete momentum tool that combines the Relative Strength Index (RSI) and the Stochastic RSI (StochRSI) into a single pane, complemented by a powerful Multi-Timeframe (MTF) Table of up to 4 timeframes for a comprehensive market view.
It is ideal for traders looking to confirm overbought/oversold conditions across multiple timeframes before making a trading decision.
Key Features and Logic:
Dual Oscillator Display: It plots the RSI (to measure the speed and change of price movements) and the %K and %D lines of the StochRSI (to measure the RSI relative to its range).
Visual Signaling: Background Shading: The RSI area is shaded in Red or Green (overbought or oversold) for quick identification of extreme zones.
Optional Labels: Displays clear labels like "OB" (Overbought) or "OS" (Oversold) when the oscillators cross critical levels.
Multi-Timeframe Table (MTF 4): The core feature. It displays the values of the RSI and the StochRSI Average ((K + D) / 2) across four different timeframes fully customizable by the user (e.g., 15m, 1h, 4h, Daily).
Heatmap Matrix: The MTF table values are dynamically colored:Red or Green: If the value is in the Overbought zone ($\geq 70$ by default) or Oversold zone ($\leq 30$ by default).
Recommended Usage:
Signal Confluence: Use the primary oscillators to identify an entry signal on your operating timeframe.
MTF Confirmation: Check the MTF table to confirm that momentum on higher timeframes (e.g., 4H or Daily) is moving in the same direction (e.g., if the current timeframe oscillator is oversold, look for higher TFs to show a neutral or low value to confirm exhaustion).
Risk Management: Avoid taking buy signals if the higher TFs are already showing a strong overbought condition (Red or Green).

Ichimoku Multi-Timeframe Status (IMTF – VFG)-----------------------------
Overview
-----------------------------
This tool displays the status of key Ichimoku components (Tenkan, Kijun, and the Cloud) across multiple timeframes in a compact color-coded table. It helps traders quickly assess trend alignment and market structure without plotting the full Ichimoku on the chart.
👉 How to Read
✔ TK row:
Green = price above Tenkan
Red = price below Tenkan
✔ KJ row:
Green = price above Kijun
Red = price below Kijun
✔ KU row (Cloud):
Green = above the cloud
Red = below the cloud
Blue = inside the cloud
The KU row is highlighted for visibility.
👉 Usage
This indicator does not generate signals.
It simply summarizes Ichimoku conditions on several timeframes to help identify:
1️⃣ multi-timeframe trend alignment,
2️⃣ momentum vs. structure (TK vs. KJ),
3️⃣l cloud context for trend-following or structural analysis.

IMS 4H Structural Framework (MA / Pivot / MTF Levels)IMS 4H Structural Framework (MA / Pivot / MTF Levels)
✅ SHORT, COMPLIANT DESCRIPTION (Invite-Only Safe)
Description:
This tool visualizes a 4H Institutional Market Structure (IMS) framework by combining three workflow components into a single structural map—MA-based bias shifts, pivot-derived 4H trendlines, and multi-timeframe (1H/45m) structural levels.
It does not generate signals or performance claims.
The framework is designed purely for visual, discretionary analysis of structural flow, risk context, and higher-timeframe alignment.
Core Components:
• 4H Bias Shift (MA): Highlights directional bias transitions.
• 4H Trendlines (Pivot-Based): Shows structural slopes and reaction zones.
• MTF Levels (1H & 45m): Adds micro-structure inside the 4H box for refinement.
• Caution Zones: Marks potential reaction areas near support/resistance or trendlines.
• Dashboard: Displays bias context and educational guidance only.
Intended Use:
For traders who analyze 4H structural flow and wish to visualize bias, context, and multi-timeframe alignment—not for automation or signals.
________________________________________
✅ SHORT, SAFE DISCLAIMER (Invite-Only Approved)
Disclaimer:
This tool is for educational and informational purposes only.
It does not provide trading signals, financial advice, or performance guarantees.
All decisions remain solely with the user.

7 EMA Cross StrategyKhanaal Traders.7 EMA Cross Strategy is a visual tool designed to display a structured group of seven Exponential Moving Averages (EMAs) and highlight moments when these averages form specific alignment conditions. The script supports two optional interpretation modes:
• A sequential alignment mode, where EMAs arrange themselves in order relative to one another.
• A multi-step pattern mode, where the chart price interacts with all EMAs while alignment is present.
The script includes adjustable periods for each EMA, customizable colors, and optional multi-timeframe filtering, allowing users to compare alignment conditions between a higher timeframe and the chart’s timeframe. It also provides optional markers that appear when alignment begins, when alignment is lost and regained, or when repetitive markers are allowed.
Additional features include:
• Individual EMA visibility toggles
• Background highlighting based on alignment conditions
• Optional retest-based marker behavior
• Optional alert conditions tied to alignment events
This tool is intended to help users observe EMA structure, visualize trend organization, and study how multiple EMAs behave together across different timeframes.

Range Oscillator with Alerts (Anson)Range Oscillator with Alerts (Anson)
From Range Oscillator (Zeiierman)
I made a little change and added an alert function.
The oscillator maps market movement as a heat zone, highlighting when the price approaches the upper or lower range boundaries and signaling potential breakout or mean-reversion conditions. Instead of relying on traditional overbought/oversold thresholds, it uses adaptive range detection and heatmap coloring to reveal where price is trading within a volatility-adjusted band.

Liquidity & inducementsHi all!
This indicator will show liquidity and inducements.
I will continue to try to add different types of liquidity and inducements, at this moment it contains 6 kinds of liquidity/inducement, they are:
• Grabs
• Big grabs
• Sweeps
• Turtle soups
• Equal highs/lows (liquidity and inducement)
• BSL & SSL
And 1 type of inducement:
• Retracement
This description will contain indicator examples of each individual liquidity and inducement. They will all be with the default settings.
Settings
First you will find settings for the market structure (BOS/CHoCH/CHoCH+). Select left and right pivot lengths and if the pivots should have a label or not.
This is the base foundation of this indicator and is possible with my library 'PriceAction' ().
You will see solid lines for break of structures (BOS), change of characters (CHoCH) and change of character plus (CHoCH+).
The pivots found will be the core of this indicator and will show you when the closing price breaks it. When that happens a break of structure (BOS) or a change of character (CHoCH or CHoCH+) will be created. The latest 5 pivots found within the current trend will be kept to take action on.
A break of structure is removed if an earlier pivot within the same trend is broken and the pivot's high price for a bullish trend or low price for a bearish trend is more extreme than the BOS pivot's price.
You are able to show the pivots that are used. "HH" (higher high), "HL" (higher low), "LH" (lower high), "LL" (lower low) and "H"/"L" (for pivots (high/low) when the trend has changed) are the labels used.
In the next section ('Liquidity ($$$)') you can select which types of liquidity you want to see. Note that 'Equal highs/lows' can also show inducement (more on that later).
In the section afterwards ('Inducement (IDM)') you can select if you want retracement inducements to be visible or not. More information on what they are later on.
The section for each individual liquidity and/or inducement can first contain a line named 'Pivot', where you can set the pivot lengths (first left, then right). Then you can set the 'Lookback', which means that the 'Lookback' number of past pivots is to take action on. After that you set the 'Timeframe' for the pivots used. That means that all available liquidity/inducements will be from your desired timeframe. Lastly you set the color of the liquidity/inducement (either a single color or bullish followed by bearish colors).
Lastly in the settings you can select the font sizes for the market structure and liquidity/inducements and what style liquidity/inducements lines will have. The sizes defaults to 7 and has a dotted line look.
Grabs
Liquidity grabs and liquidity sweeps are very similar. It all depends on if the current bar closed above/below the liquidity pivot and on if its a continuation or reversal. In a liquidity grab the bar that's above or below the liquidity pivot was not closed above or below it. Like this:
Or
The visual feedback will be a dotted line between the liquidity pivot and liquidity grab bar and a linefill between the high of the liquidity grab bar and the liquidity pivot.
Indicator example:
Big grabs
This is another 'grabs' option. You can show an additional grab if you want to. I suggest having this grab from a higher timeframe or with larger pivot lengths than the other grab.
The default is with the chart timeframe and 10/10 as pivot lengths.
Indicator example:
Sweeps
A liquidity sweep is like a liquidity grab but with the difference that price closes above/below and has a continuation instead of a reversal. If the liquidity pivot was at the same bar as a BOS/CHoCH/CHoCH+ it will not be a liquidity grab but a structural break instead.
They can look like this:
Indicator example;
Turtle soups
If only one candle is beyond the pivot it could be a liquidity grab. It's a grab if price didn't close beyond the liquidity pivot, if so it's invaliditet. Turtle soups are basically false breakouts that takes liquidity (is a false breakout from a pivot with the lengths and timeframe from the settings).
The turtle soup can have a confirmation in the terms of a change of character (CHoCH). You can enable this in the settings section for 'Turtle soups' through the 'Confirmation' checkbox (enabled by default). The turtle soup strategy usually comes with some sort of confirmation, in this case a CHoCH, but it can also be a market structure shift (MSS) or a change in state of delivery (CISD).
The addition of turtle soups is possible through my script 'Turtle soup' ().
The drawing will be a dotted line between the liquidity pivot and the last bar of the false breakout and a box from the start of the false breakout to the end of it.
Indicator example:
Equal highs/lows
Equal highs/lows will always show liquidity, but might also show inducement. Inducement will be shown on equal lows if the trend is bullish and on equal highs if it's bearish, like this:
Or
Equal highs can only be created if the second pivot is lower than the first one. Equal lows can only be created if the second pivot is higher than the first one. If that is not the case it could be a liquidity grab.
When equal highs or equal lows are find that produces inducement (equal lows in a bullish trend and equal highs in a bearish trend), the indicator will first display inducement and will show liquidity once traders are induced to enter the security. Stop loss placement, for liquidity, is 0.1 * the average true range (ATR, of length 14). They will look like this:
Only inducement:
Inducement and liquidity:
Indicator example:
Equal highs/lows inducements can not be triggered after a BOS/CHoCH/CHoCH+. They are cleared upon a structural break.
BSL & SSL
Buyside liquidity (BSL) and sellside liquidity (SSL) will be shown. A pivot that's been mitigated (touched by price) can never be BSL or SSL. The BSL/SSL available will be dynamic while price moves (work in Replay and lower timeframes that moves fast) and pick the latest pivot/s (with left and right lengths from the 'Market structure' section). You can define how many BSL/SSL you want to see with a default value of 1, meaning only 1 BSL and 1 SSL can be shown. If there is no unmitigated high (BSL) or low (SSL), no BSL/SSL will be available to show. If there are BSL/SSL available they're very useful to use as targets for entering a trade.
The will look like this when available;
And without BSL available:
Or
And without SSL available:
Note that the examples without BSL/SSL available could have liquidity available from previous price legs.
This can be an example of a BSL/SSL sequence:
First both buyside and sellside liquidity is available:
Then a new low appears and new sellside liquidity is available:
Then buyside liquidity is mitigated, so only sellside liquidity is available:
A new high pivot appears and buyside liquidity is available again:
Lastly a bearish CHoCH happens and sellside liquidity is mitigated, only buyside liquidity is available:
Retracement
The first retracement after a BOS/CHoCH/CHoCH+ is considered an inducement with the mission to get traders into a trade prematurely to get stopped out. This level is shown and look like this:
Or
A retracement inducement is removed when a new BOS/CHoCH/CHoCH+ appears and it's not triggered.
---------------------------
As of now there aren't any alerts available. You cannot use the Pine Screener from Tradingview either to see new liquidity/inducement events. I have this planned for future updates though.
I hope that this long description makes sense, let me know otherwise! Also let me know if you experience any bugs or have a feature request or just want to share good settings to use.
Best of trading luck!

Custom MTF VWAP 4x with IBI put this indicator together to have my main VWAP levels displayed on the chart easily with shaded areas when price is over extended. The IB I added to have the option to change futures based on an initial balance strategy combined with the daily and NY VWAP.

W%R Cycle Swings - MTF Trend📄 English Description
Overview
The W%R Cycle Swings – MTF Trend indicator is a market-structure tool built on top of Williams %R cycle logic. It detects meaningful swing highs and lows from W%R behavior, then uses those swings to locate the first Market Structure Shift (MSS-first) and track multi-timeframe trend bias + cancel levels.
This is not a random mashup of indicators: all components are derived from one core concept—W%R cycles—and are combined into a single, coherent framework for reading structure and trend across timeframes.
Core Concepts
1. Williams %R Cycle Swings (Current Timeframe)
Instead of using price swings based only on highs/lows, this script uses Williams %R behavior to define swing points:
Swing High pattern: OS → OB → OS
Swing Low pattern: OB → OS → OB
The script:
Tracks overbought/oversold states using user-defined levels.
Builds a zone for each potential swing (accumulating the extremums during the OB/OS phase).
Confirms a swing only when the opposite state appears again.
Plots labels on the chart:
Swing High label above price
Swing Low label below price
Optional price display on the label (toggle in settings).
This makes the swing points cycle-based rather than purely bar-based.
2. MSS-first (Market Structure Shift on Current TF)
Once swings are defined, the script looks for the first break of the most recent swing:
Bullish MSS-first: price breaks above the last confirmed swing high.
Bearish MSS-first: price breaks below the last confirmed swing low.
You can choose whether to confirm by close or by wick (mssByClose input).
When an MSS-first is detected:
A colored label (bullish/bearish) is drawn at the relevant swing level.
A horizontal line is drawn from the swing bar to the MSS bar to visually connect the structure break.
Internal trendBias is updated to Up or Down, preventing duplicate MSS labels in the same direction.
This gives a clear, visual definition of when the structure actually shifted based on W%R-driven swings.
3. MTF MSS-first Trend & Cancel Logic
The same MSS-first concept is applied inside a function and called via request.security() on multiple timeframes (5m, 15m, 30m, 1h, 4h).
For each timeframe, the function:
Recalculates W%R swings with the same parameters.
Detects MSS-first events (bullish or bearish).
Tracks a trend state:
1 → Up trend
-1 → Down trend
0 → Unknown / Neutral
Maintains a cancel level, which represents the price that would invalidate the current trend:
In an uptrend, cancel is typically the last relevant swing low.
In a downtrend, cancel is typically the last relevant swing high.
This provides:
Trend direction per TF (Up / Down / -)
A concrete price level that acts as a structural “stop” or invalidation level.
4. MTF Trend Table (Visual Overview)
If enabled, a compact table is displayed on the chart (position configurable):
Columns: 5m, 15m, 30m, 1h, 4h
Rows:
Trend → shows Up, Down or -, with color-coded background.
Cancel → shows the current cancel price for that timeframe.
This creates a multi-timeframe structure dashboard that tells you:
Which timeframes are currently in an Up or Down MSS-based trend.
At which price the current structural view would be canceled.
5. Alert Conditions
The script includes alert conditions for:
Current timeframe MSS-first:
Bullish MSS-first (structure break up).
Bearish MSS-first (structure break down).
MTF MSS-first events for:
5m, 15m, 30m, 1h, 4h (Bullish & Bearish separately).
This allows you to receive notifications when a fresh structural shift happens on any of the tracked timeframes.
How to Use
Use Swing High / Swing Low labels to understand the current W%R cycle structure on your main timeframe.
Watch for MSS-first labels to catch the first break of structure after a swing completes.
Use the MTF Trend table:
Trade in the direction of higher-timeframe trends.
Use cancel levels as logical invalidation areas or structural stop guides.
Combine the current timeframe swings with MTF bias:
Example: look for long setups when H1/H4 show Up trend and price forms new bullish MSS on lower TF.
The tool is suitable for both intraday and swing trading, on any symbol and timeframe.
Why This Script Is Original
It links cycle-based swings from Williams %R directly to MSS-first detection, rather than using generic pivot logic.
It combines:
W%R-driven swing definition,
MSS-first structural breaks,
Multi-timeframe trend state,
Cancel (invalidation) levels,
Alerts for MSS events on multiple TFs,
into a single, coherent market-structure framework.
The MTF table is not a generic dashboard: it is specifically built around this W%R-MSS-first structural model, which gives traders both trend context and exact invalidation prices.
🇹🇭 Thai Description — คำอธิบายภาษาไทย
ภาพรวม
อินดิเคเตอร์ W%R Cycle Swings – MTF Trend เป็นเครื่องมืออ่านโครงสร้างราคา โดยใช้ “วงจรของ Williams %R” เป็นหลักในการหา Swing High / Swing Low แล้วใช้จุด Swing เหล่านั้นมาหา MSS-first (จุดเปลี่ยนโครงสร้างครั้งแรก) จากนั้นต่อยอดไปสู่ การดูแนวโน้มหลายกรอบเวลา + ระดับ Cancel (จุดที่โครงสร้างจะถูกมองว่าพัง)
แนวคิดหลัก
Swing จาก Williams %R (TF ปัจจุบัน)
ใช้รูปแบบ OS → OB → OS เพื่อยืนยัน Swing High
และ OB → OS → OB เพื่อยืนยัน Swing Low
เมื่อยืนยันแล้วจะสร้าง Label “Swing High / Swing Low” บนกราฟ และสามารถแสดงราคาบนป้ายได้
ทำให้จุด Swing มีพื้นฐานจาก “Cycle ของ W%R” ไม่ใช่แค่ high/low เฉย ๆ
MSS-first บน TF ปัจจุบัน
ถ้าราคาทะลุ Swing High ล่าสุด → มองเป็น Bullish MSS-first
ถ้าราคาทะลุ Swing Low ล่าสุด → มองเป็น Bearish MSS-first
เลือกได้ว่าจะยืนยันจาก Close หรือจาก ไส้แท่งเทียน
วาดป้าย MSS + เส้นเชื่อมจาก Swing ไปยังจุดที่เกิด MSS
มีตัวแปร trendBias ป้องกันไม่ให้ยิง MSS ซ้ำในทิศทางเดิมจนรก
MTF MSS-first + Cancel Logic
นำ Logic เดียวกันไปใช้กับ TF: 5m, 15m, 30m, 1h, 4h
สำหรับแต่ละ TF จะได้:
สถานะแนวโน้ม: Up / Down / Unknown
ระดับ Cancel: ราคาที่ถ้าหลุดจะถือว่าโครงสร้างเทรนด์นั้นถูก “ยกเลิก”
เช่น ในเทรนด์ขาขึ้น ระดับ Cancel มักมาจาก Swing Low ล่าสุด ฯลฯ
MTF Table บนกราฟ
แสดง Trend + Cancel ของ 5 TF ในรูปแบบตาราง
อ่านง่าย: แถว Trend เป็น Up/Down พร้อมสีพื้น, แถว Cancel เป็นตัวเลขราคา
ใช้ดูภาพรวมโครงสร้างหลาย TF ในมุมมองเดียว
Alert Conditions
แจ้งเตือน MSS-first ของ TF ปัจจุบัน
แจ้งเตือน MSS-first ของ TF 5m / 15m / 30m / 1h / 4h แยก Bull / Bear
วิธีใช้งาน
ใช้ Swing High / Swing Low เพื่อดูว่าโครงสร้าง cycle ปัจจุบันอยู่ตรงไหน
รอให้เกิด MSS-first เพื่อมองว่า “โครงสร้างราคาเริ่มกลับตัวแล้ว”
ใช้ Table MTF:
ดูว่า TF ไหนเป็น Up / Down
ใช้ราคาบรรทัด Cancel เป็นแนว “จุดตัดขาดทุนเชิงโครงสร้าง” หรือจุดเปลี่ยนมุมมอง
เทรดตามทิศทาง TF ใหญ่ แล้วหา Entry จาก MSS ของ TF เล็ก
จุดเด่น / ความเป็น Original
ใช้ Williams %R เป็นฐานในการสร้าง Swing Pattern แทนการใช้ Pivot ธรรมดา
เชื่อม W%R Swing เข้ากับแนวคิด MSS-first อย่างเป็นระบบ
มีทั้ง:
ป้าย Swing
ป้าย MSS + เส้นเชื่อม
MTF Trend + Cancel
Alert เตือน MSS ในหลาย TF
อยู่ในสคริปต์เดียว
เหมาะกับคนที่ต้องการอ่านโครงสร้างราคาแบบมีที่มาที่ไป ไม่ใช่แค่ตามอินดี้ตัวเดียวครับ ✅

CG Momentum - Table✅ 📄 English Description
Overview
The CG Momentum – Table indicator is a multi-timeframe momentum dashboard designed to help traders quickly evaluate market conditions across eight key timeframes. Instead of combining indicators arbitrarily, this script integrates four different momentum components—Williams %R, Stochastic %K, MACD slope, and RSI vs RSI-SMA trend state—into one unified framework. Each element contributes a unique perspective on momentum behavior, allowing traders to see alignment or divergence across all timeframes in a single glance.
Concept & Logic
1. Williams %R Cycle Position (Overbought/Oversold)
Uses a custom calculation instead of built-in W%R to ensure consistent values across security() calls.
Highlights overbought/oversold cycles using user-defined threshold levels.
Helps identify cycle turning points across higher and lower timeframes.
2. Stochastic %K Momentum (9-3-3 Model)
Computes raw %K manually, then applies smoothing to maintain accuracy in lower timeframes.
Evaluates overbought/oversold states based on traditional Stoch thresholds.
Color-coded for quick visual confirmation.
3. MACD Slope State (+ / –)
Instead of using MACD crossovers, this script analyzes MACD momentum direction by detecting 2-bar slope patterns.
A positive state means MACD is accelerating upward; negative means it is decelerating downward.
Ideal for spotting early trend acceleration.
4. RSI Trend State (RSI vs RSI-SMA)
Compares RSI(14) to its SMA(14).
Produces a + (bullish) or – (bearish) state.
A clean method to detect underlying trend bias in any timeframe.
How the Dashboard Works
The script displays a clean table in the bottom-right corner of the chart with the following columns:
TF | W%R | Stoch K | MACD | RSI
For each timeframe (5m → 1M):
W%R and Stoch cells are color-coded:
Green = Overbought (cycle top)
Red = Oversold (cycle bottom)
Gray = Neutral
MACD shows + or – with a trend-colored background.
RSI shows + or – depending on whether RSI is above/below its moving average.
This provides a compact yet powerful view of multi-timeframe momentum consensus.
How to Use
Look for alignment across timeframes (e.g., several timeframes showing bullish momentum).
Confirm entries by checking whether short-term momentum aligns with higher-timeframe structure.
Use W%R and Stoch colors to identify cycle extremes.
Use MACD/RSI states to confirm whether momentum is strengthening or weakening.
Ideal for intraday, swing, or position trading.
Why This Script Is Unique
Uses custom implementations for W%R, Stoch, RSI-MA state, and MACD slope instead of built-ins, ensuring consistent behavior across multi-timeframe security() calls.
Provides four distinct momentum perspectives in one unified visual tool.
Designed for clarity, reducing chart noise by consolidating indicators into one panel.
Suitable for all assets and timeframes.
🇹🇭 คำอธิบายภาษาไทย (สำหรับผู้ใช้ไทย)
ภาพรวม
อินดิเคเตอร์ CG Momentum – Table เป็นแดชบอร์ดวัดโมเมนตัมแบบหลายกรอบเวลา ที่รวมสัญญาณสำคัญ 4 ประเภท ได้แก่ Williams %R, Stochastic %K, MACD slope และสถานะ RSI เทียบ SMA ไว้ในตารางเดียว เพื่อช่วยให้เทรดเดอร์มองเห็นภาพรวมของโมเมนตัมในทุกไทม์เฟรมได้อย่างชัดเจนและอ่านง่าย
แนวคิดและหลักการทำงาน
1. Williams %R (วงจรราคาซื้อเกิน/ขายเกิน)
คำนวณด้วยสูตรเองเพื่อความแม่นยำในทุก TF
เน้นการหา cycle top/bottom
2. Stochastic %K (โมเมนตัมระยะสั้น)
ใช้สูตร 9-3-3 พร้อม smoothing
ช่วยหาจุดเร่งหรืออ่อนแรงของราคาในช่วงสั้น
3. MACD Slope State
ไม่ใช้สัญญาณ cross
ใช้การตรวจ “ความชันของ MACD” ว่ากำลังเร่งขึ้นหรือเร่งลง
เหมาะกับการจับสัญญาณเร่งตัวของแนวโน้ม
4. RSI Trend State
เปรียบเทียบ RSI กับค่าเฉลี่ยของมันเอง
ถ้า RSI > SMA → ขาขึ้น
ถ้า RSI < SMA → ขาลง
วิธีใช้งาน
ดูความสอดคล้องของโมเมนตัมระหว่างหลาย ๆ TF
ถ้าหลายกรอบเวลาชี้ไปทางเดียวกัน → ความน่าเชื่อถือสูง
ใช้สีของ W%R / Stoch เพื่อดู cycle
ใช้ MACD / RSI เพื่อยืนยันทิศทางแรงซื้อหรือแรงขาย
จุดเด่นของสคริปต์นี้
เป็นการรวม Momentum Indicators แบบมีเหตุผล ไม่ใช่การนำอินดี้หลายตัวมายำ
แสดงข้อมูลสำคัญทั้ง 4 ด้านในตารางเดียว
ออกแบบให้ “อ่านง่าย”, “ไม่รก chart”, “เข้าใจเร็ว”
เหมาะทั้ง Day trade, Swing และ Long-term

Multi-Timeframe Pivot ZonesThis indicator plots dynamic support and resistance levels from higher timeframes onto your current chart. It calculates the high, low, midpoint, and quartile (25%, 75%) levels from up to four different higher timeframes, projecting them forward as potential reaction zones.
🔍 **KEY FEATURES:**
• **Multi-Timeframe Analysis:** View key levels from 4 different timeframes simultaneously
• **Smart Visibility:** Levels only appear on timeframes equal to or lower than their source
• **Customizable Styles:** Choose colors, line widths, and styles (solid, dashed, dotted) for each timeframe
• **Projected Zones:** Levels extend into the future to show potential support/resistance areas
⚙ **HOW TO USE:**
1. Enable/disable timeframes in the settings
2. Set each timeframe to match your trading strategy (e.g., 1H, 4H, D, W)
3. Watch for price reactions at these levels for entry/exit signals
4. Use the quartile levels (25%, 75%) as secondary support/resistance areas
The indicator helps traders identify confluence areas where multiple timeframes align, increasing the significance of potential reversal or breakout points.

Multitime ATRMulti-Timeframe Supertrend (Multitime ATR) Indicator Description
This indicator, written in Pine Script v5, is a Multi-Timeframe (MTF) Supertrend tool. It provides a multi-faceted market analysis by simultaneously displaying the Supertrend lines from the current chart timeframe and three higher timeframes: the 1-Hour (1H), 4-Hour (4H), and 1-Day (1D).
📌 Key Features and Characteristics
Multi-Timeframe Display:
It overlays the Supertrend lines from the current timeframe, 1H, 4H, and 1D onto a single chart, totaling four timeframes.
By visualizing the higher timeframe trend lines (uptrends as support, downtrends as resistance), traders can determine where the price action on the current chart stands within the context of the larger, dominant trends.
Supertrend Logic:
The Supertrend calculation utilizes the Average True Range (ATR), based on a user-specified ATR Period and ATR Multiplier.
The Change ATR Calculation Method? input allows switching the ATR calculation between the standard ta.atr (EMA-based/smoothed) and ta.sma(ta.tr, Periods) (SMA-based) methods.
Visual Aids:
Trend Lines: Uptrend lines (support) and downtrend lines (resistance) for each timeframe are plotted with different colors and line weights (e.g., Main: Green/Red, 1H: Blue tones, 4H: Purple tones, 1D: Green/Dark Red tones).
Highlighter: A background coloring feature visually highlights the area between the price and the Supertrend lines according to the trend direction for each timeframe, making the trend immediately obvious. This can be controlled collectively by the Master Highlighter setting.
Trend Change Marks: Small circle plots (●) indicate the exact points of trend reversal for each higher timeframe, clearly signaling a shift.
Warning and Break Signals:
The indicator plots signal labels on the chart when the current price breaks (or nearly breaks) a higher timeframe trend line.
Warning (⚠️): Plotted when the price closes below an uptrend line.
Break (⚡): Plotted when the price closes above a downtrend line.
These signals are designed to reset after a certain period (coded as 3,600,000 milliseconds = 1 hour) to prevent continuous noise from repetitive breaks.
Alert Functionality:
In addition to the current timeframe's Buy/Sell signals, the indicator features robust alerts for the Warning/Break signals across the 1H, 4H, and 1D timeframes, ensuring that critical trend changes are not missed.
🛠️ Customization Options
The indicator's settings allow for detailed customization of the following parameters for each timeframe (Main, 1H, 4H, 1D) individually:
ATR Period (ATR Period)
ATR Multiplier (ATR Multiplier)
Visibility toggles for trend lines, signals, and highlighters.
Furthermore, the Master Control section enables simultaneous control over the display of the Highlighter, Signals, Up Trend Lines, and Down Trend Lines across all timeframes.
This indicator serves as a powerful tool for finding more reliable entry and exit points by integrating multi-timeframe trend analysis, which helps reduce false signals often encountered in single-timeframe trading.
Would you like me to elaborate on a specific section of the code, such as the request.security function or the signal logic?

X Trend ProOverview
X Trend Pro is a price-action–based study designed to help users observe potential trend shifts and breakout-related conditions on the chart.
The indicator analyzes market structure, volatility phases, and breakout behavior to highlight moments where momentum may be increasing in a specific direction.
This script does not generate trading signals or provide any financial advice.
Its purpose is strictly analytical and educational.
Core Concept
The indicator combines three main components:
Breakout Detection
Identifies price behavior when exiting consolidation zones or tight ranges.
Trend Alignment
Internal filters verify whether the breakout aligns with the broader directional bias.
Confirmation Logic
Multiple internal conditions must agree before a visual marker appears.
These include momentum shifts, volatility expansion, and structural validation.
All logic is built using TradingView’s internal data only.
Signal Markers
X Trend Pro may display Buy and Sell markers when the required internal conditions are met.
These markers represent technical observations, not trade entries or signals.
Markers appear when:
A breakout structure is detected
Trend filters support the direction
Additional confirmations validate the scenario
They are visual aids for studying price behavior.
Target Levels (Visual Only)
The script includes optional, visually displayed reference levels:
Reference Stop Level
Reference Target 1
Reference Target 2
Reference Target 3
These levels are derived from the breakout structure and can assist users in analyzing potential expansion areas.
They are not recommended targets or investment guidance.
Integrated Version
This version merges two previous confirmation modules into a unified tool in order to:
Reduce chart clutter
Improve clarity and consistency
Provide a cleaner visual presentation
Maintain efficiency across different markets and timeframes
This integration does not turn the script into a trading system.
Inputs
Users can customize various settings, including:
Breakout sensitivity
Trend filter adjustments
Marker visibility
Target-level visibility
Display and visual preferences
All input fields are optional and customizable.
How to Use
X Trend Pro can help users with:
Studying breakout conditions
Exploring trend continuation or reversal contexts
Observing momentum expansion
Enhancing general technical chart analysis
Entering trades when a breakout signal appears, using the indicator's Buy or Sell markers as potential entry points
It should always be combined with broader analysis and not used as a standalone decision tool.
Limitations
Breakouts behave differently across markets and timeframes
No confirmation system is fully accurate
Visual levels are approximations, not predictions
The script relies solely on TradingView’s available price data
Disclaimer
This script does not offer trading advice or guarantee any outcomes.
It is intended solely for technical study and educational purposes.

MTF Checklist DashboardMTF Checklist Dashboard
Overview
The MTF Checklist Dashboard is an advanced multi-timeframe analysis tool that provides traders with a comprehensive visual dashboard to analyze market conditions across six customizable timeframes simultaneously. This indicator combines multiple technical analysis methods, including Opening Range Breakouts (ORB), VWAP, EMAs, and daily price levels, to generate high-probability confluence-based trading signals.
Unlike traditional single-timeframe indicators, this dashboard displays all critical information in one organized table, allowing traders to instantly identify when multiple timeframes align for optimal entry and exit opportunities.
Key Features
Multi-Timeframe Analysis
Analyzes up to 6 timeframes simultaneously (default: 1m, 5m, 15m, 30m, 1h, 4h)
Fully customizable timeframe selection via comma-separated input
Color-coded cells for instant visual recognition (green=bullish, red=bearish, yellow=neutral)
Technical Indicators Tracked
Current and previous candle direction
Opening Range Breakout (ORB) positioning with custom period
VWAP relationship (above/below)
200 EMA positioning
Daily and previous day high/low proximity
EMA crossovers (9 vs 21, both vs 200)
Advanced Signal Filtering System
Confluence scoring: Requires multiple timeframes to align (3-6 timeframes)
Higher timeframe confirmation: Ensures 30m/1h/4h agreement
Volume filter: Confirms signals with above-average volume (1.5x default)
ATR volatility filter: Validates sufficient market movement
Session timing: Restricts signals to optimal trading hours (EST)
Momentum confirmation: Requires recent directional strength
Range positioning: Blocks signals near daily extremes
Candle strength: Validates strong directional candles (60%+ body ratio)
Visual Signals
Optional entry arrows (above/below bars)
Background color highlighting
Organized dashboard with real-time price levels
ORB range, current day, and previous day summary rows
Alert Conditions
JSON-formatted alerts for automated trading integration
Separate alerts for long entry, short entry, long exit, and short exit
Compatible with webhook automation systems
How To Use
Dashboard Interpretation
The dashboard displays a color-coded table with the following columns:
TF: Timeframe being analyzed
C: Current candle (Green=bullish, Red=bearish)
P: Previous candle (Green=bullish, Red=bearish)
ORB: Opening Range Breakout position (A=Above, B=Below, W=Within)
VWAP: Price vs VWAP (A=Above, B=Below)
E200: Price vs 200 EMA (A=Above, B=Below)
D Hi/Lo: Proximity to current day high/low (Hi/Lo/Mid)
PD Hi/Lo: Proximity to previous day high/low (Hi/Lo/Mid)
9 vs 21: EMA 9 vs EMA 21 relationship (A=9 above 21, B=9 below 21)
9&21 v200: Both EMAs vs 200 EMA (>>=both above, <<=both below, <>=mixed)
Signal Generation
Long Entry Signal triggers when:
Minimum number of timeframes show bullish alignment (default: 5 of 6)
Higher timeframes (30m/1h/4h) confirm direction (default: 2 of 3)
Price breaks above ORB high with sufficient distance
Volume exceeds average by specified multiplier
ATR shows adequate volatility
Trade occurs during optimal session hours
Recent momentum is upward
Price not too close to daily high
Strong bullish candle forms
Short Entry Signal uses opposite conditions
Exit Signals trigger when opposing timeframe confluence reaches threshold (default: 3 timeframes)
Recommended Workflow
Select your asset and primary trading timeframe
Observe the dashboard - Look for rows showing mostly green (bullish) or red (bearish)
Wait for alignment - The indicator will show arrows when confluence requirements are met
Check the bottom rows - Review ORB levels and daily ranges for context
Set alerts - Enable TradingView alerts using the built-in alert conditions
Manage risk - Use appropriate position sizing and stop losses based on ORB range or daily ATR
Settings Guide
Basic Settings
Timeframes: Enter comma-separated values (e.g., "1,5,15,30,60,240")
Show Header: Toggle column headers on/off
ORB Minutes: Set opening range period (default: 15 minutes)
Near % for daily highs/lows: Define proximity threshold (default: 0.20%)
Use close for comparisons: Compare using close vs current price
Dashboard Position: Choose from 9 screen positions
Confluence Filters
Minimum Timeframes Aligned: Set required confluence (3-6, default: 5)
Require Higher Timeframe Confirmation: Toggle HTF requirement on/off
Min Higher Timeframes: Specify HTF agreement needed (1-3, default: 2)
Volume Filter
Volume Confirmation: Enable/disable volume filtering
Volume vs Average: Set multiplier threshold (default: 1.5x)
Volume Average Length: Period for volume average (default: 20 bars)
Volatility Filter (ATR)
Volatility Filter: Enable/disable ATR confirmation
ATR Length: Calculation period (default: 14)
Min ATR vs Average: Required ATR level (default: 0.5x = 50%)
ORB Filters
ORB Breakout Distance Required: Toggle distance requirement
Min Breakout % Beyond ORB: Additional breakout threshold (default: 0.10%)
Session Filter
Trade Only During Best Hours: Enable time-based filtering
Session 1: First trading window (default: 0930-1130 EST)
Session 2: Second trading window (default: 1400-1530 EST)
Momentum Filter
Recent Momentum Required: Enable directional momentum check
Lookback Bars: Period for momentum comparison (default: 3 bars)
Daily Range Filter
Block Signals Near Daily Extremes: Prevent entries at extremes
Distance from High/Low %: Minimum distance required (default: 2.0%)
Candle Filter
Strong Directional Candle: Require candle strength
Min Candle Body %: Body-to-range ratio threshold (default: 60%)
Visual Signals
Show Entry Signals: Master toggle for visual signals
Show Arrows: Display entry arrows on chart
Background Color: Enable background highlighting
Best Practices
Start with default settings and adjust based on your trading style and asset volatility
Higher confluence requirements (5-6 timeframes) produce fewer but higher-quality signals
Enable all filters for conservative trading; disable some for more frequent signals
Use the dashboard as confirmation alongside your existing trading strategy
Backtest on your specific instruments before live trading
Consider market conditions—trending vs ranging markets may require different settings
Alerts
This indicator includes four alert conditions with JSON formatting for webhook integration:
Long Entry Signal: Triggers when all long conditions are met
Short Entry Signal: Triggers when all short conditions are met
Long Exit Signal: Triggers when opposing confluence reaches exit threshold
Short Exit Signal: Triggers when opposing confluence reaches exit threshold
Alert messages include ticker symbol, action (buy/sell), price, and quantity for automated trading systems.
Important Notes
This indicator works best on liquid instruments with clear price action
Highly volatile markets may require adjusted ATR and ORB distance settings
Session times are in EST timezone—adjust if trading non-US markets
The ORB calculation requires sufficient price history for the day
Signals are generated in real-time but should be confirmed at candle close
Limitations
Maximum of 6 timeframes can be analyzed due to TradingView's security call limits
ORB calculations may not work correctly on instruments with gaps or irregular sessions
The indicator is most effective during regular market hours when volume and volatility are adequate
Lower timeframes (1m, 5m) may produce more false signals in choppy conditions
License
Mozilla Public License 2.0 (MPL-2.0)
This indicator is licensed under the Mozilla Public License 2.0. You are free to use, modify, and distribute this code under the terms of the MPL-2.0. The full license text is available at mozilla.org
Key license provisions:
You may use this code commercially
You may modify and distribute modified versions
Modified versions must be released under the same license
You must include the original license notice in any distributions
No trademark rights are granted
Disclaimer
This indicator is provided for educational and informational purposes only. It is not financial advice, and past performance does not guarantee future results. Trading involves substantial risk of loss. Always:
Practice proper risk management
Test thoroughly on paper/demo accounts before live trading
Use appropriate position sizing
Never risk more than you can afford to lose
Consult with a financial advisor for personalized advice
The creator assumes no liability for trading losses incurred using this indicator.
Version: 2.0
Pine Script Version: v6
Author: © EliasVictor

Previous Day & Week Highs and Lows 1.3Overlay indicator that plots horizontal lines for the previous day’s and previous week’s highs and lows. Lines extend until the next period starts, so you can see these levels throughout the current day or week.
The indicator detects new daily and weekly sessions and draws lines at the previous period’s high and low. Daily levels use green (high) and red (low); weekly levels use blue (high) and magenta (low). You can toggle daily/weekly independently, customize colors, and adjust line width. It works on intraday timeframes and helps identify support/resistance and track breakouts relative to prior periods.

Dashboard EMAs + RSI Multi-Timeframe (6 TF)Multi-Timeframe EMA + RSI Dashboard (6 TF)
This indicator provides a unified dashboard that summarizes EMA cross signals and RSI conditions across six different timeframes. For each selected timeframe, the script calculates a fast EMA and a slow EMA independently, compares them, and classifies the trend as bullish, bearish, or neutral.
It also computes the RSI for each timeframe and identifies whether the oscillator is showing bullish strength, bearish pressure, or a neutral state based on configurable thresholds. All this information is organized into a compact on-chart table that displays symbols, descriptions, and RSI values, allowing traders to interpret multi-timeframe market conditions without switching charts.
At the bottom of the dashboard, the script includes an aggregated score that sums all bullish and bearish signals coming from the EMA trend and the RSI behavior. This final score provides a quick global reading of the overall market bias across the six analyzed timeframes.
The indicator is fully customizable, allowing users to change the selected timeframes, adjust EMA and RSI lengths, choose colors, enable or hide the panel, and set its position anywhere on the chart.

Daily 4H LevelsThis indicator will automatically demarcate the 4H openings for NQ1!. Please give me feedback if you find anything as its a work in progress.
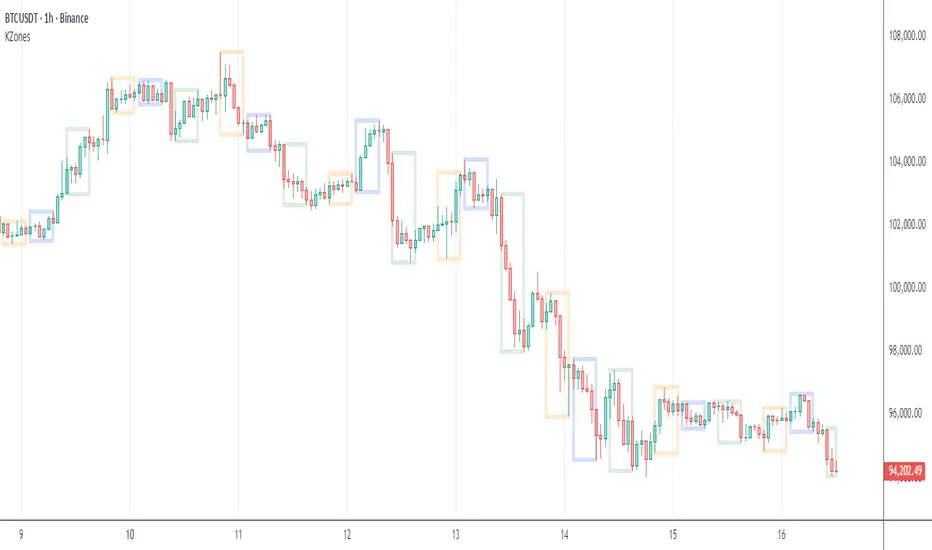
KZones Global Market Insight: Timezone moving marketsModern financial markets trade 24 hours a day, making it hard to track where the action is happening.
Do you wonder who is driving price action across Asia, Europe, and the Americas?
This indicator lets you visualize the trading activity of different geographic sessions.
For example, you can quickly see the recent move in Bitcoin was initiated by Americas selling down, represented by a large, downward-facing box. Asia and Europe followed through with more selling.
Start tracking the world's market movers today!
Note: This was inspired by ICT Killzones & Pivots