Wolfe Wave PatternHello All!
For a while now, some of my followers have been asking me to develop Wolfe Wave Pattern . Here it's at your service as open-source and public indicator.
How it works?
- On each bar/tick it checks zigzag waves by using base period and updates the array that is used to keep zigzag levels and locations. Base period in the settings is the minimum zigzag period
- Then it searches if there is new bullish/bearish Wolfe Wave pattern according to last wave direction
- Before searching the pattern it calculates all possible 1234 waves. So any wave in 12345 uses base period or higher. it means that it search all possible candidates. This algorithm is much better than using a few zigzag periods.
- After getting all possible candidates, it checks if any of the found candidates is suitable for Wolfe Wave pattern and keeps them in a matrix
- if there are suitable candidate(s) it shows the latest one and triggers the alert
- it also follows the targets and if the price hits any of the target it extends the line and trigger the alert
- it doesn't check if any of the patterns hits stop-loss.
Options:
Base Period: minimum period to create the zigzag
Error Rate: there are usually so few perfect patterns, so we better consider deviation. if error rate is low than it finds less pattern with more accuracy, if error rate is high than it finds more pattern with less accuracy
- The other options are used for coloring the patterns and lines
Some examples:
P.S. I didn't have enough time to test the indicator, so please drop a comment if you see any issue while using it
Enjoy!
Multizigzag

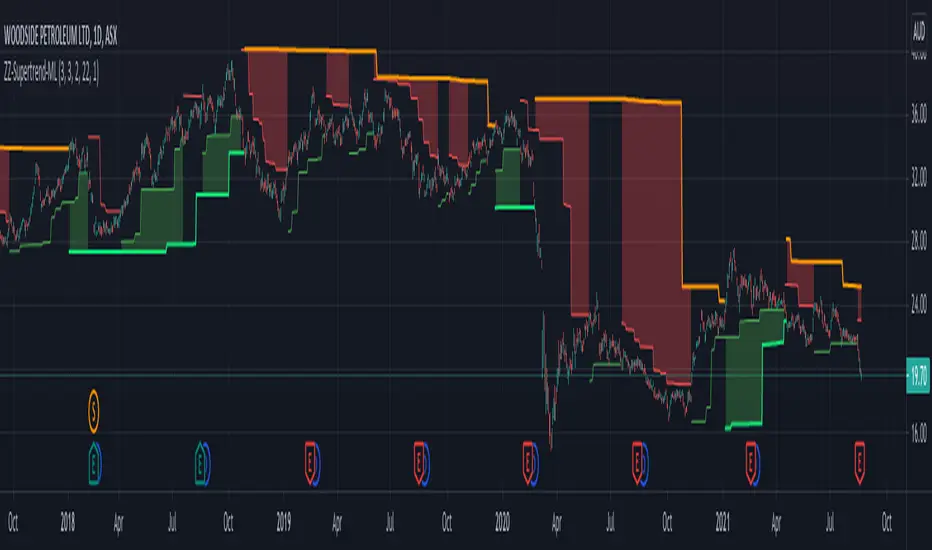
Multilevel ZigZag SupertrendVery much similar to :
I have slightly changed code to accommodate multiple zigzags. Also removed possibility of external source to keep it simple.
Indicator shows 2 Level zigzag based supertrends. Second zigzag used is multi level zigzag and hence, this acts as higher timeframe filter and can be considered as overall trend bias.
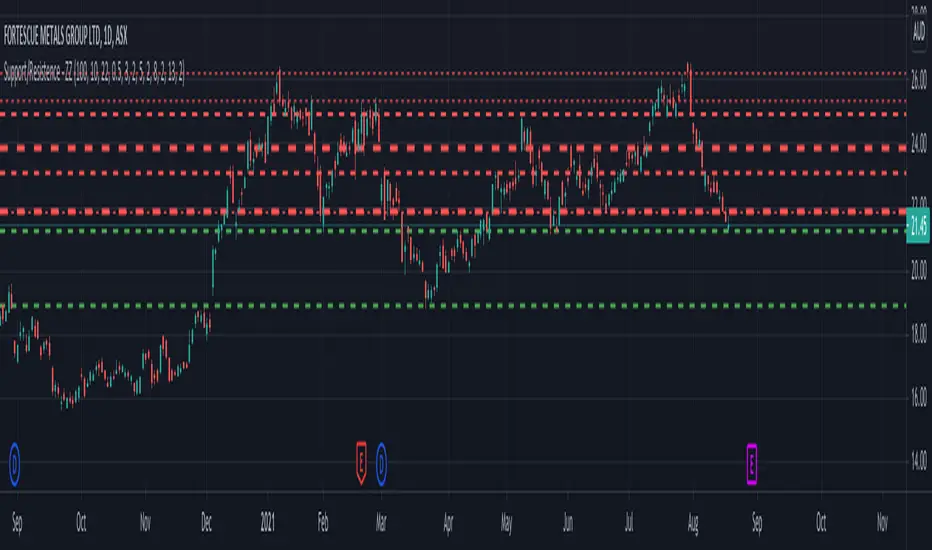
Multi ZZ - Support/ResistenceExperimental and probably can be improved further.
Method of deriving support/resistence is as follows:
Calculate Zigzags and start pushing them to SR array as and when they form
If any of the existing item is within the small distance - merge them. ATR is used to find if the prices are close by.
Whenever we merge two pivots, strength of support keeps increasing. This means, price has bounced off this point more time. Hence, keep track of number of pivots merged together.
Keep removing old pivots which are far away based on Loopback input
And that's all we got the full list of support and resistence points.
Now, to filter insignificant pivots, chose only those points which has been merged by more than Min Pivots input. Width of the support/resistence lines also will be thicker for the pivots which has more count. Hence thicker line imply strong support and resistence whereas the thinner ones are minor ones.