NIFTY Adv/Dec Live Count1) NIFTY Index Advance-Decline count
2) Each session, it reads the number of stock are +Ve or -Ve
3) Whichever the side +Ve or -Ve side moving stock is more than count will be plotted
4) at +/- 25 drawn a dotted line if Count is > = +/-25 Nifty is moving in a strong army
Eg:-
in the current session, 30 Stock is moving in +Ve direction & 10 are in -Ve direction
30 count will be plotted in the chart
NIFTY

Nifty Volumes by OHO TradingProudly Presenting the Volumes Chart of Nifty 50 Spot of Indian Market
Studies Used
We have used Exponential Moving Averages in this Chart
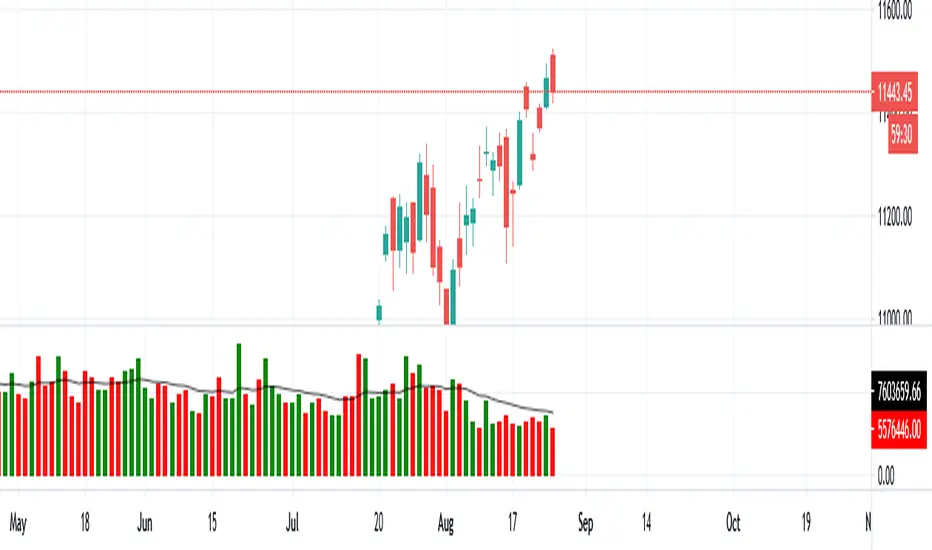
Nifty VolumeWhy this Script : Nifty 50 does not provide volume and some time it is really useful to understand the volume .
This is the pine script which calculate the nifty 50 volume .
Logic :
Take each stock contribute to nifty 50 and find it's volume .
Multiply the same with contribution percentage of the same on Nifty 50
Add up all of them and find the total volume .
There is a similar script by @daytraderph which is built for Bank Nifty (custom volume) . I took the same and built for Nfity.
Nifty has 50 stocks and you cant call security method more than 40 times from one Pine script, so this is the limitation of this script. It consider top 40 stocks and find the volume (which contribute pretty much around 95% of the volume) and convert the same to 100 %
SIMPLE MOVING AVG 10,20,50,100,200 with RESOLUTIONThis indicator is the best than all other sma indicators.Because in just one click you can change all the resolution /time frames for all the sma .
Multitime frame analysis can be done in just one click. just change the resolution to
15 min/30 min/1hr- if you intraday trader
1D- LONG TERM INVESTORS.
Multi-timeframe analysis (MTF) is a process in which traders can view the same ticker/indicator using a higher time frame than the chart’s, for example, displaying a daily moving average on a one-hour chart in just two clicks.
How to Use this to Buy Stocks ?
The technical indicator known as the Death cross occurs when the 50-day SMA crosses below the 200-day SMA => Bearish Signal.
An opposite indicator, known as the Golden cross, occurs when the 50-day SMA crosses above the 200-day SMA => Bullish Signal.
Crossovers are one of the main moving average strategies.
1st Strategy is the first type is a price crossover, which is when the price crosses above the sma => Buy signal
when the price crosses below the sma => Sell signal
2nd Strategy is to apply two moving averages to a chart: one longer and one shorter.
When the shorter-term MA (100) crosses above the longer-term MA (200), it's a buy signal, indicates trend is shifting up.
This is known as a "Golden cross."
Meanwhile, when the shorter-term MA (100) crosses below the longer-term MA (200), it's a sell signal, indicates trend is shifting down.
This is known as a "Dead/death cross."
The time frame or length you choose for a moving average, also called the "look back period," can play a big role in how effective it is.
An MA with a short time frame will react much quicker to price changes than an MA with a long look back period. In the figure below, the 20-day moving average more closely tracks the actual price than the 100-day moving average does.
A 20-day MA = more beneficial to a shorter-term trader, since it follows the price more closely.
A 100-day MA = more beneficial to a longer-term trader.
Moving averages work quite well in strong trending conditions but poorly in choppy or ranging conditions.
use this indicator along with Price action theory and not alone.
Moving average crossovers are a popular strategy for both entries and exits. MAs can also highlight areas of potential support or resistance
Happy Trading

IndianPivotBoss_ADRAverage Daily Range indicator
This indicator shows the average daily range. By default shows one day Daily Range. It can be customised upto 100 days. Strongly suggested to use 1-5 days only.
It also plots 4 lines which are by default 10 day average Daily Range (ADR) with 50% of ADR, 75% of ADR, 100% of ADR and 125% of ADR.
These are used to calculate potential daily targets.
However, the most important usage is on daily chart for the next day analysis for trading intraday. If DR is less than 50% of the ADR (BOTTOM MOST LINE), the color of the bar will be in red which indicates that there is heavy contraction which could possibly followed by expansion. This could possibly lead to a trending day and hence traders can prepare well in advance.

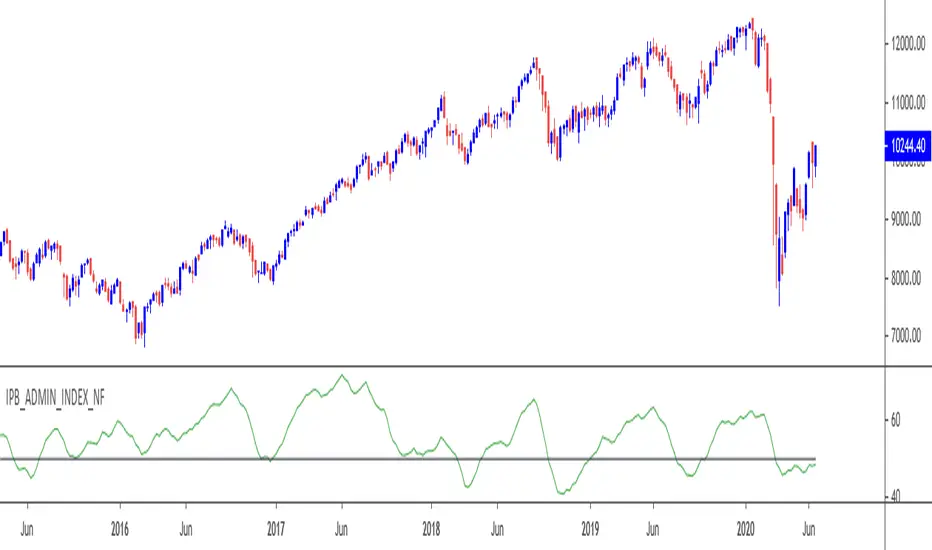
IndianPivotBoss_ADMIN_NIFTYThis is the Advance Decline Momentum Index for Top 18 stocks of Nifty 50 index.
This is similar to the ADMIN index for Bank Nifty Stocks that is already available for public use.
Top 18 stocks of Nifty contributes more than 70% of Nifty's movement.
The index has the following options :
1) Admin line (shorter momentum ) : By default this is enabled. If it crosses above 50, it indicates upward momentum with stock participation. If it crosses below 50 it indicates downward momentum. Divergence of this indicator Vs price is an excellent advance clue for a possible reversal.
2) Admin line (longer momentum) : This is to be used with respect to S.No. 1. If shorter momentum crosses longer momentum upside, it is an indication of stronger momentum and vice versa.
3) Admin MACD : Upward sloping indicates stronger momentum and downward sloping of histogram lines indicate weaker momentum. Divergence Vs price is an excellent advance clue for a possible reversal.
4) Advance decline line : This is the actual cumulative advance decline line.
5) Advance decline line 200 ema : This is the 200 ema of the advance decline line.
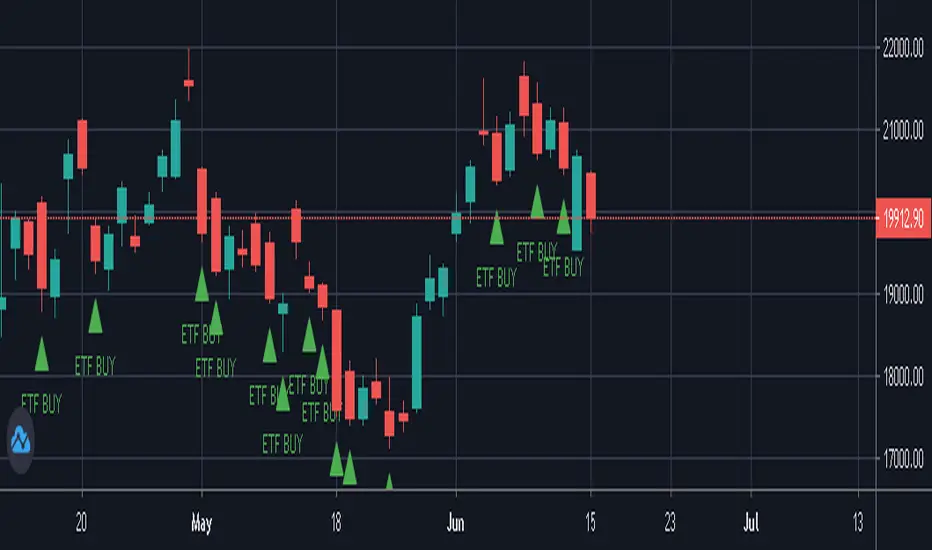
NIFTY / BANKNIFTY ETF SIP NOTIFIERNIFTY / BANKNIFTY - ETF SIP NOTIFIER
STUDY concept -
- As a market investor, one cannot time the market.
- Specailly, working professionals and job holders don't have time for market tracking.
- The idea of the script is - When Nifty closes below 2% previous day high, market has corrected and it's available at a discount w.r.t. previous day
- One can then invest in NIFTY / BANKNIFTY via ETF option on same or next day.
- If you like this idea, Save this script and add alert condition of this script in NIFTY / BANKNIFTY chart.
- One can get notification on TradingView mobile app or via email when the criteria is met.
- Logic can be applied to investing in INDEXES , NIFTY, BANKNIFTY.
Logic may be improved later.
NOTE - Investing is a serious and risky business. Profit / Loss from this investing idea is sole responsibility of the investor. This script is for education and learning purpose.
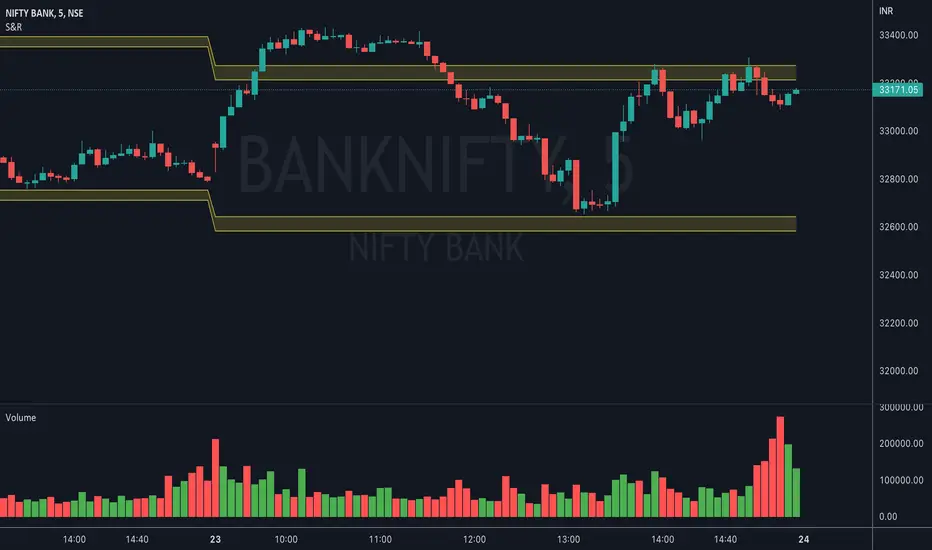
BNF VWAP & MAThe script picks up Bank nifty stocks with their current respective weights and plots a Volume Weighted Average Price ( VWAP ) line along with 2 EMAs of your choice and an alert when the EMAs cross over and also when price crosses VWAP .
You can customize the script for MA type and lengths and to remove alert. Basic utility of the script is to analyse volumes driving the Bank Nifty index.
Credits to @daytraderph and his script (Custom Volume ) who's code I used to build this script. Also thanks to my friend @Varun who helped me code it.

{INDYAN} Dual Supertrend#Always follow MAJOR trend, find MINOR trend as per Major trend and choose entry/exit accordingly .
Suppose major trend is blue so only go long while inside minor trend is green, when it turns RED exit from long but dont short in BLUE i.e. major uptrend and vice versa for downtrend i.e. major should be pink and minor should be red for short and when it turn green under pink just exit the sort.
By default major trend is set to 15 Minutes which is generally good for index, and 1 hour should be for stocks. You can change it through settings.
My recommendation for index is major should be 15 minutes and minor 5 and for stocks major should be 1 hour and minor 15 minutes.
It can be used with index,stocks and commodties.
Hope it will help my trader friends.
Happy Trading...
Love INDYAN

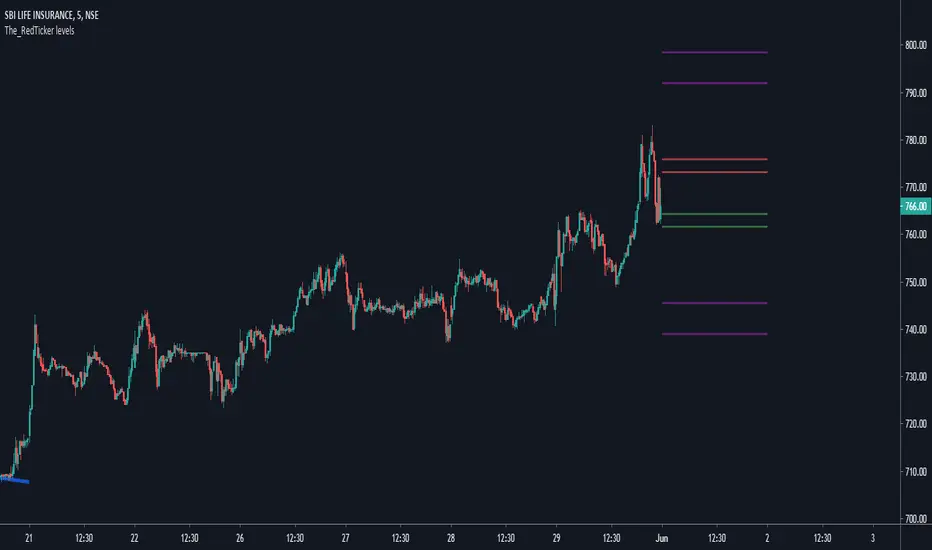
The_Redticker's Intraday IndicatorThis is a simplistic indicator capable of predicting Intraday Reversal regions for almost any chart on NSE/BSE (Indian Stock Exchanges)
Notes for Usage:
Best works when used on both indexes NIFTY and NIFTYBANK simultaneously in correlation. Its easy to understand that correlation, any one using it should spot it in a few days
Also, should only be used on 3 or 5 mins timeframe.
ENTRY:
The Inner regions marked by Red and Green lines are to be used for entries. Can look for both long and short reversal on either zones, can be teamed with other oscillators for better understanding.
Basically, when the CMP enters either Red or Green Zone, look for a long or short entry at the close outside the zone on 3 or 5 mins timeframe with the other side of the zone as stoploss trigger price.
While the Purple line on either side indicates the target zones.
P.s. If entering Short reversal at the Red Zone, then Green zone can also serve as first target and Purple zone as the final target depending on Market momentum. Vice-versa for entry at Long reversal at Green zone too.
Note: This indicator is most of the time absolutely correct, but needs to corrected every few months for VIX change. If and when that is done next will update it to show a NOTE on chart regarding that.
Look at any Index ideas on my profile to see live examples.
IndianPivotBoss_ADMINThis is a momentum index derived from the number of advances - number of declines of the stocks comprising the index.
This is called Advance Decline Momentum INdex (ADMIN).
It is a leading indicator to spot reversals.
This can be used in any time frames right from intraday to higher time frames.
By default it is configured for Bank Nifty (12 stocks).
Stocks can be changed with provision to have maximum of 12 stocks only.
How to use this while trading ?
The bars represent the 55 period ema of the momentum of difference between advances and declines
The line represent the 13 period ema of the momentum of difference between advances and declines.
If the bars are upward sloping, the color becomes blue and it becomes red if they are sloping downwards.
If the line crosses above the bars and moves past 50 with bars having blue color, it suggests a possible upward bias.
If the line crosses below the bars and moves below 50 with bars having red color, it suggests a possible downward bias.
Practice spotting in any time frames. I am confident this will form a major tool in your trading arsenal.
Respect Risk management. There is no holy grail.

Indian Market OutlookIndian Market Outlook provides an information Panel for Major Nifty Indices, Indicators and the status of your stock time frames 2,5,15,30,60 minutes in one window.
It provides Up/Down Trend of the NIFTY & Other Indices.

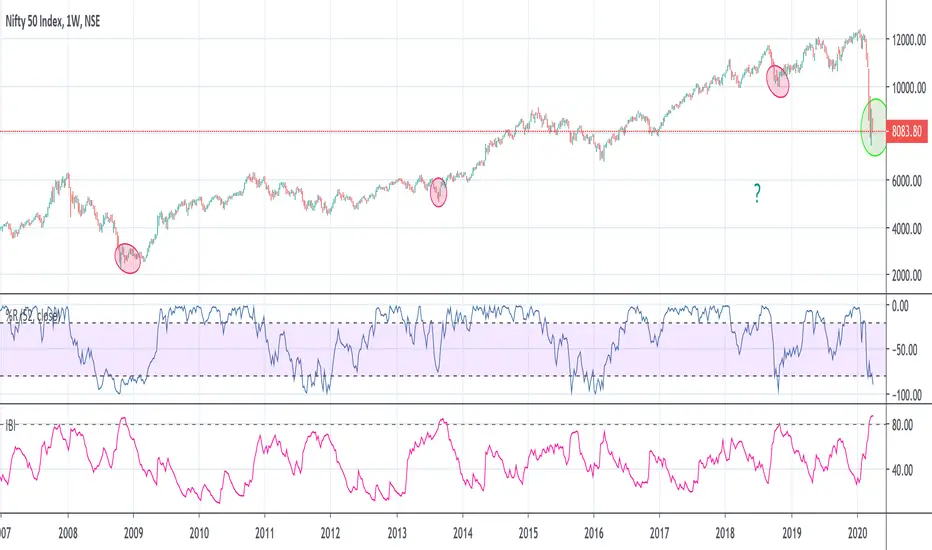
Investment Bottom IndicatorWant to know when the market has reached near bottom in selloff or bearish trend?
You now have a perfect indicator for that - "Investment Bottom Indicator"
How to use?
Chart Setup-
Step 1- Add your index symbol
Step 2- Change the time frame to weekly (candle sticks)
Step 3- Add William %R - settings: Period- 52, Close
Step 4- Add this indicator - Investment Bottom Indicator
Analysis-
When the William %R value is below -80 & Investment Bottom Indicator value is above 80 : this indicates that the market is near its bottom and if you have not yet started investing yet, this is the right time before the market flies off (in very few weeks/months) & you miss the bus!
RVC-Weekly-Pivots-GANN-LevelsPurpose:
Weekly - Fibonacci pivot levels and Gann levels calculation and marking on Chart automatically.
Mainly expected to use for trading on NIFTY and BankNifty
Kindly share your comments and suggestions to improve

DeltaMause it for identifing trend of nifty and banknifty, green for long red for short. below 0 must sell ...

JARVISJARVIS is a technical indicator primarily designed for Nifty Bank. But, it also works on other instruments like stocks for example. You may apply it on other instruments if you find it useful.
Once the indicator is plotted, it will have bars with 3 colours
1) Blue - It's watching
2) Green - It's bullish
3) Red - It's bearish
So, it's that easy to interpret.
Following are few examples on NSE:BANKNIFTY
September 20, 2019 - Indicator turned green and remained so till end of the day. If you would have followed this, you would have made more than 2000 points.
September 25, 2019 - Indicator turned red and remained so till end of the day. If you would have followed this, you would have made more than 100 points.
September 26, 2019 and September 27, 2019 - Indicator remained blue and you see that the market was just consolidating.
Above are just a few examples of what this is capable of. Apart from Nifty Bank, it also works well on popular stocks like Reliance, TCS, SBIN etc
Recommended time frame for this is 15 mins, but, you may experiment with other time frames as well. It's all about finding the right time frame for that particular instrument, for example it works best on 2H when applied on Nifty.
Should you have any doubts, feel free to DM me.

Puneet_9EMA_21_RSIThis is a reliable trend indicator system that used EMA over RSI, gives good Enter and Exit signals when applied on Nifty two hours chart.
Can be used for other financial instruments too.

MULTITIMEFRAME_VWAP_MANOJVWAP is a powerful concept.
It denotes the fair price that is traded in the market.
In other words, it represents a variance of POINT OF CONTROL (POC) which is a Market Profile / Volume Profile Concept.
It is a leading indicator as it is dependent on the price and volume .
Usually VWAP is used for intraday trades and Trading view as an in built indicator which works only for intraday.
This script plots daily vwap , monthly vwap , quarterly vwap and yearly vwap .
The suggested combination is :
intraday charts - daily vwap
daily charts - monthly and / or quarterly vwap
weekly charts - quarterly and / or yearly vwap

INSIDE BAR This indicator identifies Inside Bar.
Inside Bar is an indecisive setup where traders are not sure of the direction which is reflected in the bar range which is usually narrower.
The day following Inside Bar usually would be a decisive bar with wide range.
This decisive bar can be exploited if traded with discipline.
The steps to follow are :
At EOD :
1) Use daily charts for locating Inside Bar with this indicator on.
2) Ensure you keep the parameter prev range Vs inside bar as 0.25 irrespective of default value. This means that the previous bar range is greater than the inside bar range by 25%.
3) Try going through all FNO scrips to locate inside bar (as there is no scanner in Trading View).
4) Once an Inside Bar scrip is located, earmark them or send them to watchlist.
5) Now you will have a watchlist with around 5-6 scrips.
Next trading day at market opening:
5) When the market opens, wait till 9.45 am (first half an hour).
6) Mark the first half an hour high and low. These are opening range high and opening range low.
7) If price breaks out decisively on the upside above opening range high, buy with a stop of opening range low. Target can be based on super trend or ema or any other method. If price breaks out decisively on the downside below opening range low, short with a stop of opening range high.
8) Ensure you follow disciplined position sizing.
Good luck.

NIFTY Underlying Capitalized Weighted Advance DeclineNIFTY Underlying Capitalized Weighted Advance Decline
Market Internal tool used for trading Nifty Futures and Options
Calculation Method: Underlying stocks Free Float Market capitalization weightage has been used to calculate the outcome.
Data Taken from IISL

NIFTY Underlying Weighted Volume Advance and DeclineNIFTY Underlying Weighted Distribution of Volume Advance and Decline
Market Internal tool used for trading Nifty Futures and Options
Calculation Method: Underlying stocks Free Float Market capitalization weightage has been used to calculate the outcome.
Data Taken from IISL

