Dynamic Strike Selection Indicator [ARJO]Dynamic Strike Selection Indicator
OVERVIEW
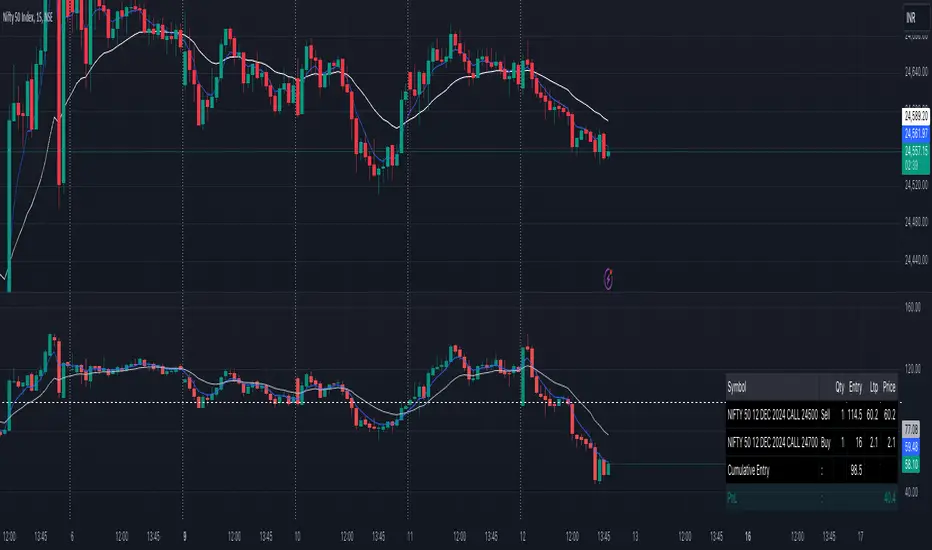
The Dynamic Strike Selection Indicator is a visual analysis tool designed for traders observing NSE (National Stock Exchange of India) instruments, particularly those interested in options. It displays a trend-based oscillator in the lower chart pane and automatically calculates option strike prices , presenting them in an easy-to-read table. The indicator helps users observe trend changes and understand how option strikes might be selected based on current market conditions.
IT has a dashboard that shows you:
Where the trend might be heading (through the oscillator)
What option strikes align with the current price level
When trend transitions occurred
CONCEPTS
This indicator combines several technical analysis concepts in a beginner-friendly format:
1. Trend Observation (Chandelier Exit)
The indicator uses a method called "Chandelier Exit" which observes price volatility to identify potential trend directions. When the indicator shows green, it suggests an upward trend pattern; red suggests a downward pattern. These are reference points, not predictions.
2. Smoothed Price Movement
Raw price data can be noisy. This indicator applies mathematical smoothing (called "Ehlers 2-Pole filter") to reduce short-term fluctuations, making it easier to observe the underlying trend direction.
3. Momentum Oscillator
The oscillator (displayed as bars and lines in the lower pane) shows the difference between smoothed price and its moving average. Positive values suggest upward momentum; negative values suggest downward momentum . This is similar to how MACD or LBR works.
4. Strike Price Calculation
For option traders , the indicator automatically calculates:
ATM (At-The-Money): The strike price closest to the current underlying price
OTM (Out-of-The-Money): Strike prices at a distance from ATM, based on your settings
These calculations use standard rounding methods based on each instrument's official strike interval.
FEATURES
Visual Components:
Color-Coded Oscillator: Green/teal for potential uptrend, purple/red for potential downtrend
Histogram Display: Visual bars showing momentum strength
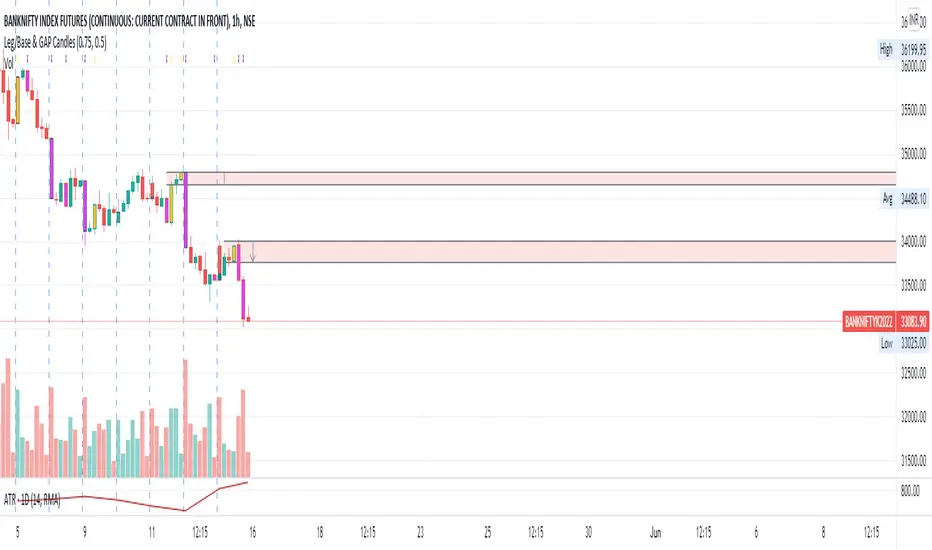
Chandelier Exit Lines: Plotted on the main price chart as reference levels
Information Table: Displays calculated strikes, timestamps, and optional tracking data
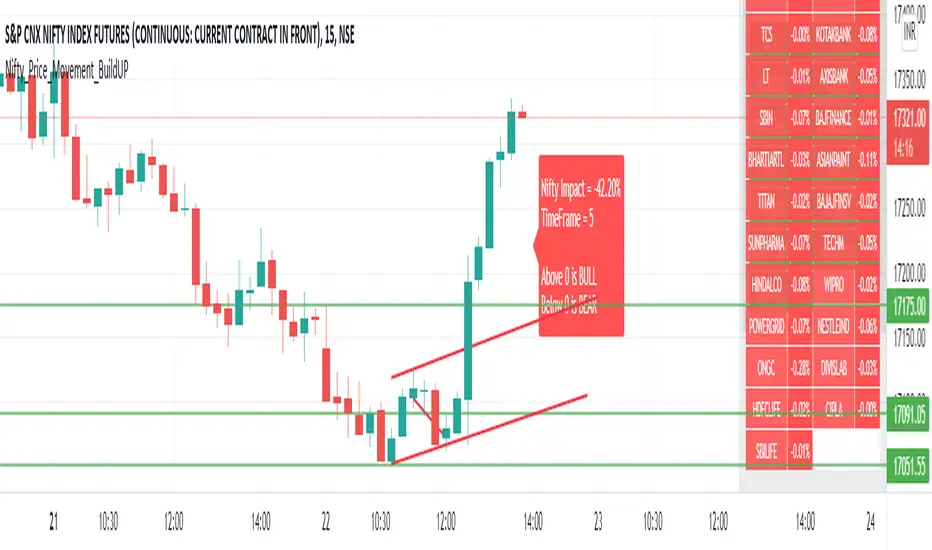
Supported Instruments:
Major indices: NIFTY, BANKNIFTY
Popular stocks: RELIANCE, HDFCBANK, ICICIBANK, INFY, TCS, SBIN, and more
Any NSE instrument (using manual strike interval setting)
Flexible Configuration:
Choose between "Sell Mode" and "Buy Mode" perspectives
Customize strike interval for any instrument
Adjust sensitivity of trend detection
Modify visual appearance (colors, table position, text size)
Track entry prices and observe P&L calculations (for reference only)
Features:
Automatic strike interval detection for predefined instruments
Manual override option for custom requirements
Real-time option premium fetching (where available)
Timestamp recording of trend transitions
Active trade highlighting based on current trend
HOW TO USE
Step 1: Adding the Indicator
Open your TradingView chart with an NSE instrument (e.g., NIFTY, BANKNIFTY, or any stock)
Search for " Dynamic Strike Selection Indicator " in the Indicators menu
Click to add it to your chart
You'll see an oscillator appear in a pane below your price chart and a table in the corner
Step 2: Basic Settings
Click the settings (gear icon) on the indicator. Here are the key settings to understand:
Symbol Settings:
Symbol Source: Keep it on " Use Chart Symbol " to analyze whatever instrument is on your chart
Custom Symbol: Only change if you want to analyze a different instrument while viewing another chart
Expiry Date:
Set the expiry date of the option contracts you're observing
Use the dropdown menus for Day, Month, and Year
Example: For 30th January 2025, select Day: 30, Month: 01, Year: 25
Trade Entry (Optional):
Trade Mode: Choose "Sell" or "Buy" based on your observation perspective
Lot Size: Enter your intended lot size for P&L calculation reference
PUT/CALL Entry Price: Manually enter prices if you want to track reference P&L
OTM Strike Distance:
Default is 4 (means 4 strikes away from ATM)
Increase for further OTM strikes, decrease for closer strikes
Step 3: Understanding the Display
The Oscillator (Lower Pane):
Green/Teal Bars: Suggest bullish momentum characteristics
Purple/Red Bars: Suggest bearish momentum characteristics
Zero Line: The reference point - above suggests strength, below suggests weakness
Color Change: When the oscillator changes from red to green (or vice versa), it indicates a potential trend transition
Active Row Highlighting:
In Sell Mode: Green background on PUT row during uptrend, Red background on CALL row during downtrend
In Buy Mode: Green background on PUT row during downtrend, Red background on CALL row during uptrend
This helps you observe which strike aligns with the current trend direction
Visual Customization:
Change oscillator colors under "Color Settings"
Adjust table position, size, and transparency under "Table Settings"
Modify table colors to match your chart theme
NOTES FOR BEGINNERS
Start Simple: Use default settings first. Don't change too many parameters initially.
Paper Trade First: Observe the indicator for several days before considering any real trades. Note how often trend transitions occur and how strikes align.
Understand Your Instrument: Know the strike interval for your chosen stock/index. NIFTY/BANKNIFTY use 100, most stocks use 10, 20, or 50.
Timeframe Matters: The indicator behaves differently on different timeframes. A 5-minute chart will show more transitions than a 1-hour chart.
Use with Other Analysis: This indicator is one tool among many. Combine with price action, support/resistance, and volume analysis.
Don't Chase: Just because a transition occurs doesn't mean you must act. Observe the quality of the move.
Backtest Observations: Use TradingView's replay feature to observe how the indicator performed historically.
CONCLUSION
The Dynamic Strike Selection Indicator serves as an educational tool for observing trend-based oscillator patterns and understanding how option strikes might be mathematically selected based on current market conditions. It combines visual trend analysis with structured strike price calculations, helping users study the relationship between momentum patterns and option strike references.
The indicator is designed to enhance chart interpretation skills and provide transparency into strike selection methodologies. It does not predict future price movements or guarantee any outcomes. Users are encouraged to use it as one component of a broader analytical approach, always conducting independent research and maintaining realistic expectations about market analysis tools.
DISCLAIMER
This indicator is strictly for educational and analytical observation purposes. It is NOT a trading system, signal generator, or financial advisory service.
What This Indicator Does NOT Do:
Does not predict future price movements with certainty
Does not guarantee profitable trades or outcomes
Does not constitute financial, investment, or trading advice
Does not replace the need for independent research and analysis
Does not eliminate trading risks or ensure success
What You Must Understand:
All calculated strikes, P&L values, and trend observations are informational references only
Option trading involves substantial risk and can result in complete loss of invested capital
Past indicator performance does not predict future results
Trend transitions shown are historical observations, not predictions
The "active" highlighting is a visual reference tool, not a trade recommendation
Conduct thorough independent research before taking any trading decision. and consult qualified, licensed financial professionals for personalized advice.
The creator of this indicator is not a registered investment advisor, broker, or financial planner. This tool is provided "as is" without warranties of any kind. By using this indicator, you acknowledge that you understand these risks and limitations, and you agree that all trading decisions and their consequences are solely your responsibility. If you do not fully understand these risks or are unsure about options trading, do not use this indicator for live trading .
Pine Script®指標