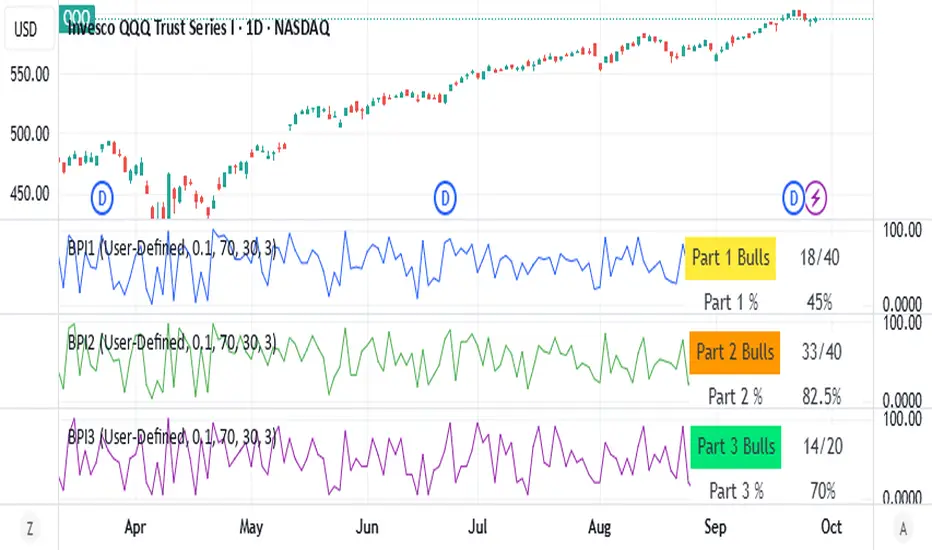
震盪指標
VWAP Momentum Oscillator How It Works
Core Calculation Method
The oscillator combines four key market measurements into a single, normalized reading:
1. Price-VWAP Deviation: `(Close - VWAP) / VWAP × 100`
2. VWAP-MA Momentum: `(VWAP - MovingAverage) / MovingAverage × 100`
3. Anchored VWAP Strength: Average of high/low anchor deviations from rolling VWAP
4. Range Position: `(Close - PeriodLow) / (PeriodHigh - PeriodLow) × 100 - 50`
Dynamic Signal Line
The signal line uses an EMA that automatically adjusts its length based on your chart timeframe:
- Futures: Always covers 23 hours of trading (1,380 minutes)
- Stocks: Always covers 6.5 hours of trading (390 minutes)
- Examples: 276 periods on 5-min futures chart, 1,380 periods on 1-min futures chart
Trading Signals
🟢 Buy Signals
- Condition: Main oscillator crosses above signal line while below zero
- Logic: Momentum turning bullish from oversold conditions
- Visual: Green "BUY" label below price action
🔴 Sell Signals
- Condition: Main oscillator crosses below signal line while above zero
- Logic: Momentum turning bearish from overbought conditions
- Visual: Red "SELL" label above price action
⚠️ Extreme Warnings
- Extreme Overbought: Red triangle when oscillator crosses above +4.0
- Extreme Oversold: Green triangle when oscillator crosses below -4.0
- Purpose: Risk management alerts, not entry/exit signals
Oscillator Zones
Interpretation Guide
- Above +2.0: Strong bullish momentum zone (green background)
- 0 to +2.0: Mild bullish territory
- 0 to -2.0: Mild bearish territory
- Below -2.0: Strong bearish momentum zone (red background)
- Above +4.0: Extreme overbought (caution advised)
- Below -4.0: Extreme oversold (potential reversal zone)
Customization Options
Moving Average Settings
- EMA/SMA Toggle: Choose between exponential or simple moving average
- Color Customization: Adjust MA line color and width
Visual Controls
- Bullish/Bearish Colors: Customize momentum zone colors
- Signal Line: Toggle visibility and adjust color
- Line Widths: Control thickness of all plot lines
Anchor Modes
- NY Session Only: Anchors reset at NY market open (9:30 AM ET)
- 24H NY Day: Anchors reset at NY calendar day change (midnight ET)
Best Practices
Timeframe Selection
- Scalping: 1-5 minute charts for quick momentum changes
- Day Trading: 5-15 minute charts for clearer trend signals
- Swing Trading: 1-4 hour charts for major momentum shifts
Signal Confirmation
- Wait for crossovers: Don't trade on oscillator position alone
- Respect extreme levels: Exercise caution above +4 or below -4
- Use with price action: Combine with support/resistance levels
Risk Management
- Extreme zones: Reduce position size when oscillator is extended
- Failed signals: Exit quickly if momentum doesn't follow through
- Market context: Consider overall trend direction and market volatility
Technical Specifications
Calculation Components
- Base Length: 1,380 periods (futures) / 390 periods (stocks)
- Signal Line: Dynamic EMA covering one full trading day
- Smoothing: 3-period SMA on raw oscillator (adjustable)
- Update Frequency: Real-time on every price tick
Performance Notes
- Resource Efficient: Optimized calculations minimize CPU usage
- Memory Friendly: Uses incremental VWAP calculations
- Fast Loading: Minimal historical data requirements
Version History & Development
This oscillator evolved from advanced VWAP overlay strategies, transforming complex multi-line analysis into a single, actionable momentum gauge. The indicator maintains the sophistication of institutional VWAP analysis while providing the clarity needed for retail trading decisions.
Core Philosophy
Traditional VWAP indicators show where price is relative to volume-weighted averages, but they don't quantify momentum or provide clear entry/exit signals. This oscillator solves that problem by normalizing all VWAP relationships into a single, bounded indicator that works consistently across all timeframes and asset classes.
---
Open Source License: This indicator is provided free for the TradingView community. Feel free to modify and enhance according to your trading needs.

GME Cycle Predictor# 🚀 GME Cycle Predictor - Advanced Technical Analysis Tool
**Comprehensive GameStop (GME) cycle tracking indicator based on historical patterns and market mechanics.**
## 📊 **What This Indicator Does:**
- Tracks **147-day quarterly cycles** from the January 28, 2021 squeeze
- Monitors the **1704-day major cycle** (the theoretical "big one")
- Identifies **T+35 FTD settlement periods** for forced buying pressure
- Marks **quarterly OPEX** and **swap roll dates**
- Provides **real-time buy/sell recommendations** based on cycle timing
## 🎯 **Key Features:**
### **Visual Cycle Markers:**
- 🔴 **Red Circles**: 147-day quarterly cycles
- 🟡 **Yellow Diamonds**: 1704-day major cycle (CRITICAL)
- 🟢 **Green Squares**: T+35 FTD settlement dates
- 🟠 **Orange Triangles**: Quarterly OPEX periods
- 🟣 **Purple X's**: Swap roll periods
### **Smart Trading Signals:**
- **🚀 MAJOR BUY**: 10+ days before 1704-day cycle
- **📈 BUY ZONE**: 5-10 days before 147-day cycle
- **💚 FTD BUY**: 2-5 days before T+35 settlement
- **📉 SELL ZONE**: Day of cycle completion
- **⏳ WAIT**: No active signals
## 📈 **How to Use:**
### **For Swing Trading:**
1. **BUY** when cheat sheet shows active buy signals
2. **SELL** on cycle completion days
3. **HODL** through the 1704-day major cycle
### **For Long-term Investors:**
- Monitor the **1704-day countdown** (major cycle theory)
- Accumulate during **confluence periods** (multiple cycles aligning)
- Use **147-day cycles** for entry/exit timing
## 🔧 **Technical Foundation:**
- Based on **Fail-to-Deliver (FTD)** settlement mechanics
- **Quarterly swap theory** and institutional obligations
- **Options expiration (OPEX)** pressure points
- **Historical pattern recognition** from 2021 squeeze
## ⚡ **Real-Time Features:**
- **Live countdown timers** to next major cycles
- **Dynamic trading recommendations**
- **Confluence detection** when multiple cycles align
- **Volume confirmation** for signal validation
- **Clean visual design** with minimal chart clutter
## 🎯 **Perfect For:**
- GME traders following cycle theory
- Technical analysts studying market mechanics
- Swing traders using institutional obligation cycles
- Anyone tracking the theoretical "MOASS" timing
## ⚠️ **Important Notes:**
- This indicator is based on **theoretical cycle patterns**
- Past performance does not guarantee future results
- Always use proper risk management
- The 1704-day cycle is **unproven theory** - trade responsibly
- Best used in conjunction with other technical analysis
## 🚀 **Special Feature:**
The **1704-day major cycle** countdown tracks the theoretical "Mother of All Short Squeezes" (MOASS) timing, calculated from the January 28, 2021 squeeze peak. This is the cycle many GME theorists believe will trigger the ultimate price movement.
---
**Perfect for both beginners and advanced traders who want to incorporate GME cycle theory into their technical analysis toolkit.**
*Disclaimer: This is a theoretical analysis tool based on community research. Not financial advice. Trade at your own risk.*

EMA Regime (9/20/50/100/200) — Stacked with 200 FilterEMA Regime (9/20/50/100/200) — Stacked Long/Short Box
Plots the 9, 20, 50, 100, and 200 EMAs on the chart.
Checks if price is above or below each EMA and whether the EMAs are stacked in order.
LONG signal: price above all selected EMAs and EMAs stacked 9 > 20 > 50 > 100 >(> 200 if strict mode on).
SHORT signal: price below all selected EMAs and EMAs stacked 9 < 20 < 50 < 100 (< 200 if strict mode on).
Shows a two-row table (LONGS / SHORTS) so you can quickly see which EMAs are aligned.
Optionally colors candles green/red when a full long/short regime is active.
Can show labels when a new LONG or SHORT condition appears.
Has alerts you can use for automated notifications when the regime flips.
“Use 200 EMA in the stack” lets you choose ultra-strict mode (9>20>50>100>200) or lighter mode (9>20>50>100 but price & 9 above 200).

Oversold & Overbought Signal with RSISimple RSI overbought/oversold signals. Signals overbought when RSI > 80 and oversold when RSI < 30.

RSI: alternative derivationMost traders accept the Relative Strength Index (RSI) as a standard tool for measuring momentum. But what if RSI is actually a position indicator?
This script introduces an alternative derivation of RSI, offering a fresh perspective on its true nature. Instead of relying on the traditional calculation of average gains and losses, this approach directly considers the price's position relative to its equilibrium (moving average), adjusted for volatility.
While the final value remains identical to the standard RSI, this alternative derivation offers a completely new understanding of the indicator.
Key components:
Price (Close)
Utilizes the closing price, consistent with the original RSI formula.
normalization factor
Transforms raw calculations into a fixed range between -1 and +1.
normalization_factor = 1 / (Length - 1)
EMA of Price
Applies Wilder’s Exponential Moving Average (EMA) to the price, serving as the anchor point for measuring price position, similar to the traditional RSI formula.
myEMA = ta.rma(close,Length)
EMA of close-to-close absolute changes (unit of volatility)
Adjusts for market differences by applying a Wilder’s EMA to absolute price changes (volatility), ensuring consistency across various assets.
CC_vol = ta.rma(math.abs(close - close ),Length)
Calculation Breakdown
DISTANCE:
Calculate the difference between the closing price and its Wilder's EMA. A positive value indicates the price is above the EMA; a negative value indicates it is below.
distance = close - myEMA
STANDARDIZED DISTANCE
Divide the distance by the unit of volatility to standardize the measurement across different markets.
S_distance = distance / CC_vol
NORMALIZED DISTANCE
Normalize the standardized distance using the normalization factor (n-1) to adjust for the lookback period.
N_distance = S_distance * normalization_factor
RSI
Finally, scale the normalized distance to fit within the standard RSI range of 0 to 100.
myRSI = 50 * (1 + N_distance)
The final equation:
RSI = 50 ×
What This Means for RSI
Same RSI Values, Different Interpretation
The standard RSI formula may obscure its true measurement, whereas this approach offers clarity.
RSI primarily indicates the price's position relative to its equilibrium, rather than directly measuring momentum.
RSI can still be used to analyze momentum, but in a more intuitive and well-informed way.

KDJ Divergence Indicator(Regular & Hidden)📌 中文介绍
KDJ 背离指标(副图版,支持 Regular & Hidden)
这是一个基于 KDJ 指标 的背离检测工具,可以在副图中直观显示 Regular 背离(顶背离/底背离) 和 Hidden 背离(隐藏顶/隐藏底)。
功能特点:
可选计算基线:支持以 J 值 或 K 值 作为背离判定依据。
多种背离类型:
Regular Bullish(底背离):价格创新低,但指标不创新低 → 可能反弹。
Regular Bearish(顶背离):价格创新高,但指标不创新高 → 可能回落。
Hidden Bullish(隐藏底背离):价格不创新低,但指标创新低 → 可能延续上涨。
Hidden Bearish(隐藏顶背离):价格不创新高,但指标创新高 → 可能延续下跌。
连线显示:在副图用线条连接前后两个背离点,帮助更直观地发现趋势变化。
自定义选项:
可选择是否显示 Regular / Hidden 背离。
可调整回溯范围(左侧/右侧/最大最小)。
可自定义颜色和信号样式。
报警提醒:背离出现时会触发报警。
适合:
波段交易者寻找趋势反转。
短线交易者捕捉关键拐点。
技术分析结合 KDJ 的交易策略。
📌 English Introduction
KDJ Divergence Indicator (Sub-Chart, Regular & Hidden Supported)
This is a KDJ-based divergence detection tool, plotted in a sub-window, that highlights Regular Divergences (Bullish/Bearish) and Hidden Divergences (Hidden Bullish/Hidden Bearish).
Key Features:
Selectable Oscillator Line: Choose between J or K line as the basis for divergence detection.
Divergence Types:
Regular Bullish: Price makes a lower low, but oscillator makes a higher low → potential rebound.
Regular Bearish: Price makes a higher high, but oscillator makes a lower high → potential drop.
Hidden Bullish: Price holds higher low, but oscillator makes a lower low → potential trend continuation upward.
Hidden Bearish: Price holds lower high, but oscillator makes a higher high → potential trend continuation downward.
Line Connections: Draws connecting lines between divergence points for better visual clarity.
Customizable Settings:
Enable/disable Regular & Hidden divergences.
Adjustable left/right lookback and range filters.
Custom colors and shapes for signals.
Alert Ready: Alerts trigger when divergences are detected.
Best for:
Swing traders spotting trend reversals.
Short-term traders catching turning points.
Technical analysts using KDJ-based strategies.

Oscillator Matrix [Alpha Extract]A comprehensive multi-oscillator system that combines volume-weighted money flow analysis with enhanced momentum detection, providing traders with a unified framework for identifying high-probability market opportunities across all timeframes. By integrating two powerful oscillators with advanced confluence analysis, this indicator delivers precise entry and exit signals while filtering out market noise through sophisticated threshold-based regime detection.
🔶 Volume-Weighted Money Flow Analysis
Utilizes an advanced money flow calculation that tracks volume-weighted price movements to identify institutional activity and smart money flow. This approach provides superior signal quality by emphasizing high-volume price movements while filtering out low-volume market noise.
// Volume-weighted flows
up_volume = price_up ? volume : 0
down_volume = price_down ? volume : 0
// Money Flow calculation
up_vol_sum = ta.sma(up_volume, mf_length)
down_vol_sum = ta.sma(down_volume, mf_length)
total_volume = up_vol_sum + down_vol_sum
money_flow_ratio = total_volume > 0 ? (up_vol_sum - down_vol_sum) / total_volume : 0
🔶 Enhanced Hyper Wave Oscillator
Features a sophisticated MACD-based momentum oscillator with advanced normalization techniques that adapt to different price ranges and market volatility. The system uses percentage-based calculations to ensure consistent performance across various instruments and timeframes.
// Enhanced MACD-based oscillator
fast_ma = ta.ema(src, hw_fast)
slow_ma = ta.ema(src, hw_slow)
macd_line = fast_ma - slow_ma
signal_line = ta.ema(macd_line, hw_signal)
// Proper normalization using percentage of price
price_base = ta.sma(close, 50)
macd_normalized = macd_line / price_base
hyper_wave = macd_range > 0 ? macd_normalized / macd_range : 0
🔶 Multi-Factor Confluence System
Implements an intelligent confluence scoring mechanism that combines signals from both oscillators to identify high-probability trading opportunities. The system assigns strength scores based on multiple confirmation factors, significantly reducing false signals.
🔶 Fixed Threshold Levels
Uses predefined threshold levels optimized for standard oscillator ranges to distinguish between normal market fluctuations and significant momentum shifts. The dual-threshold system provides clear visual cues for overbought/oversold conditions while maintaining consistent signal criteria across different market conditions.
🔶 Overflow Detection Technology
Advanced overflow indicators identify extreme market conditions that often precede major reversals or continuation patterns. These signals highlight moments when market momentum reaches critical levels, providing early warning for potential turning points.
🔶 Dual Oscillator Integration
The indicator simultaneously tracks volume-weighted money flow and momentum-based price action through two independent oscillators. This dual approach ensures comprehensive market analysis by capturing both institutional activity and technical momentum patterns.
// Multi-factor confluence scoring
confluence_bull = (mf_bullish ? 1 : 0) + (hw_bullish ? 1 : 0) +
(mf_overflow_bull ? 1 : 0) + (hw_overflow_bull ? 1 : 0)
confluence_bear = (mf_bearish ? 1 : 0) + (hw_bearish ? 1 : 0) +
(mf_overflow_bear ? 1 : 0) + (hw_overflow_bear ? 1 : 0)
confluence_strength = confluence_bull > confluence_bear ? confluence_bull / 4 : -confluence_bear / 4
🔶 Intelligent Signal Generation
The system generates two tiers of reversal signals: strong signals that require multiple confirmations across both oscillators, and weak signals that identify early momentum shifts. This hierarchical approach allows traders to adjust position sizing based on signal strength.
🔶 Visual Confluence Zones
Background coloring dynamically adjusts based on confluence strength, creating visual zones that immediately communicate market sentiment. The intensity of background shading corresponds to the strength of the confluent signals, making pattern recognition effortless.
🔶 Threshold Visualization
Color-coded threshold zones provide instant visual feedback about oscillator positions relative to key levels. The fill areas between thresholds create clear overbought and oversold regions with graduated color intensity.
🔶 Candle Color Integration
Optional candle coloring applies confluence-based color logic directly to price bars, creating a unified visual framework that helps traders correlate indicator signals with actual price movements for enhanced decision-making.
🔶 Overflow Alert System
Specialized circular markers highlight extreme overflow conditions on both oscillators, drawing attention to potential climax moves that often precede significant reversals or accelerated trend continuation.
🔶 Customizable Display Options
Comprehensive display controls allow traders to toggle individual components on or off, enabling focused analysis on specific aspects of the indicator. This modularity ensures the indicator adapts to different trading styles and analytical preferences.
1 Week
1 Day
15 Min
This indicator provides a complete analytical framework by combining volume analysis with momentum detection in a single, coherent system. By offering multiple confirmation layers and clear visual hierarchies, it empowers traders to identify high-probability opportunities while maintaining precise risk management across all market conditions and timeframes. The sophisticated confluence system ensures that signals are both timely and reliable, making it an essential tool for serious technical analysts.

Volume-Weighted RSI & Multi-Normalized MACD Overlay**Description**:
The "Volume-Weighted RSI & Multi-Normalized MACD Overlay" is a sophisticated indicator that plots a volume-weighted Relative Strength Index (VW-RSI) and a customizable Moving Average Convergence Divergence (MACD) directly on the price chart, enhancing momentum and trend analysis for traders. Designed for stocks, forex, crypto, and more, it supports multi-timeframe (MTF) analysis and offers flexible normalization and scaling options for precise visualization.
**Key Features**:
- **Volume-Weighted RSI**: A volume-sensitive RSI normalized to a configurable range (default: -50/+50), with optional smoothing (SMA, EMA, WMA, VWMA, SMMA, or Bollinger Bands). Overbought (+20) and oversold (-20) lines are plotted relative to a user-defined price source (default: ohlc4).
- **Multi-Normalized MACD**: Supports five bounded normalization methods: Min-Max, Volatility Min-Max, Hyperbolic Tangent, Arctangent, and Min-Max with Smoothing, scaled to the same range as RSI for unified analysis.
- **Price Chart Overlay**: Plots RSI, RSI MA, MACD, MACD Signal, zero-line, overbought (+20), and oversold (-20) lines, anchored to a customizable price source (e.g., ohlc4, hl2).
- **Flexible Scaling**: Choose between high/low range (default) or ATR-based scaling, with separate lookbacks for RSI and MACD (default: 128). Adjust offset and scale factor multipliers for fine-tuned visuals.
- **Customizable Display**: Toggles for RSI (with MA), MACD (with Signal), zero-line, overbought/oversold lines, and RSI background coloring (>20/< -20). Dynamic MACD colors (cyan/magenta) and transparency options enhance clarity.
**How to Use**:
1. Add to any chart (e.g., BTCUSD, SPY, 1H, 1D).
2. Configure settings:
- **General**: Set bounds (-50/+50), timeframe, scaling (high/low or ATR), zero-line source (e.g., ohlc4), and multipliers.
- **RSI**: Adjust price source, length (9), and smoothing options.
- **MACD**: Select price source, lengths (9/21/9), and normalization (e.g., Volatility Min-Max).
- **Display Options**: Toggle lines and background; adjust transparency.
3. Interpret signals: RSI > +20 (overbought), < -20 (oversold); MACD/Signal crosses for momentum; zero-line as reference.
4. Use with the companion "Volume-Weighted RSI & Multi-Normalized MACD" script for pane-based analysis if desired.
**Why Use It?**
Ideal for traders seeking a visually intuitive overlay of RSI and MACD on price action, with customizable scaling and MTF support. Perfect for trend-following, mean-reversion, and cross-market strategies.
**Notes**:
- Ensure a bounded normalization (e.g., Volatility Min-Max) is selected for MACD plotting.
- Adjust scaling multipliers for optimal visibility on volatile assets.
- Feedback welcome to enhance future versions!
**Author**: nepolix

Multi-Timeframe mybullandbearThis Multi-Timeframe RSI + Ultimate MA System combines RSI and customizable moving averages (SMA, EMA, WMA, HullMA, VWMA, RMA, TEMA) to generate powerful buy/sell signals across 5m, 15m, 1h, and 4h timeframes. Visualize signals with clear chart labels (BUY/SELL) and a multi-timeframe table showing RSI status, MA trends, and signal strength. Ideal for traders seeking trend confirmation and reversal signals.
Enable/disable RSI, MA cross, or combined signals, and adjust MA types/lengths. Use aligned signals across timeframes for stronger entries. Best with backtesting for your asset.
AI Trading Alerts v6 — SL/TP + Confidence + Panel (Fixed)Overview
This Pine Script is designed to identify high-probability trading opportunities in Forex, commodities, and crypto markets. It combines EMA trend filters, RSI, and Stochastic RSI, with automatic stop-loss (SL) & take-profit (TP) suggestions, and provides a confidence panel to quickly assess the trade setup strength.
It also includes TradingView alert conditions so you can set up notifications for Long/Short setups and EMA crosses.
⚙️ Features
EMA Trend Filter
Uses EMA 50, 100, 200 for trend confirmation.
Bull trend = EMA50 > EMA100 > EMA200
Bear trend = EMA50 < EMA100 < EMA200
RSI Filter
Bullish trades require RSI > 50
Bearish trades require RSI < 50
Stochastic RSI Filter
Prevents entries during overbought/oversold extremes.
Bullish entry only if %K and %D < 80
Bearish entry only if %K and %D > 20
EMA Proximity Check
Price must be near EMA50 (within ATR × adjustable multiplier).
Signals
Continuation Signals:
Long if all bullish conditions align.
Short if all bearish conditions align.
Cross Events:
Long Cross when price crosses above EMA50 in bull trend.
Short Cross when price crosses below EMA50 in bear trend.
Automatic SL/TP Suggestions
SL size adjusts depending on asset:
Gold/Silver (XAU/XAG): 5 pts
Bitcoin/Ethereum: 100 pts
FX pairs (default): 20 pts
TP = SL × Risk:Reward ratio (default 1:2).
Confidence Score (0–4)
Based on conditions met (trend, RSI, Stoch, EMA proximity).
Labels:
Strongest (4/4)
Strong (3/4)
Medium (2/4)
Low (1/4)
Visual Panel on Chart
Shows ✅/❌ for each condition (trend, RSI, Stoch, EMA proximity, signal now).
Confidence row with color-coded strength.
Alerts
Long Setup
Short Setup
Long Cross
Short Cross
🖥️ How to Use
1. Add the Script
Open TradingView → Pine Editor.
Paste the full script.
Click Add to chart.
Save as "AI Trading Alerts v6 — SL/TP + Confidence + Panel".
2. Configure Inputs
EMA Lengths: Default 50/100/200 (works well for swing trading).
RSI Length: 14 (standard).
Stochastic Length/K/D: Default 14/3/3.
Risk:Reward Ratio: Default 2.0 (can change to 1.5, 3.0, etc.).
EMA Proximity Threshold: Default 0.20 × ATR (adjust to be stricter/looser).
3. Read the Panel
Top-right of chart, you’ll see ✅ or ❌ for:
Trend → Are EMAs aligned?
RSI → Above 50 (bull) or below 50 (bear)?
Stoch OK → Not extreme?
Near EMA50 → Close enough to EMA50?
Above/Below OK → Price position vs. EMA50 matches trend?
Signal Now → Entry triggered?
Confidence row:
🟢 Green = Strongest
🟩 Light green = Strong
🟧 Orange = Medium
🟨 Yellow = Low
⬜ Gray = None
4. Alerts Setup
Go to TradingView Alerts (⏰ icon).
Choose the script under “Condition”.
Select alert type:
Long Setup
Short Setup
Long Cross
Short Cross
Set notification method (popup, sound, email, mobile).
Click Create.
Now TradingView will notify you automatically when signals appear.
5. Example Workflow
Wait for Confidence = Strong/Strongest.
Check if market session supports volatility (e.g., XAU in London/NY).
Review SL/TP suggestions:
Long → Entry: current price, SL: close - risk_pts, TP: close + risk_pts × RR.
Short → Entry: current price, SL: close + risk_pts, TP: close - risk_pts × RR.
Adjust based on your own price action analysis.
📊 Best Practices
Use on H1 + D1 combo → align higher timeframe bias with intraday entries.
Risk only 1–2% of account per trade (position sizing required).
Filter with market sessions (Asia, Europe, US).
Strongest signals work best with trending pairs (e.g., XAUUSD, USDJPY, BTCUSD).

Sols Day Trading Signals (5m / 10m)This indicator is designed for day trading on the 5-minute and 10-minute charts.
Includes:
EMA 9 & EMA 21 crossover signals
MACD momentum confirmation
RSI trend filter (50+)
Buy/Sell labels directly on the chart
💡 How to Use:
Go long when EMA 9 crosses above EMA 21, MACD is positive, and RSI is above 50
Go short when EMA 9 crosses below EMA 21, MACD is negative, and RSI is below 50
Best used with proper risk management (1-2% per trade)
⚠️ Disclaimer: This is for educational purposes only — always backtest and trade responsibly.

Stochastic [Paifc0de]Stochastic — clean stochastic oscillator with visual masking, neutral markers, and basic filters
What it does
This indicator plots a standard stochastic oscillator (%K with smoothing and %D) and adds practical quality-of-life features for lower timeframes: optional visual masking when %K hugs overbought/oversold, neutral K–D cross markers, session-gated edge triangles (K crossing 20/80), and simple filters (minimum %K slope, minimum |K–D| gap, optional %D slope agreement, mid-zone mute, and a cooldown between markers). Display values are clamped to 0–100 to keep the panel scale stable. The tool is for research/education and does not generate entries/exits or financial advice.
Default preset: 20 / 10 / 10
K Length = 20
Classic lookback used in many textbooks. On intraday charts it balances responsiveness and stability: short enough to react to momentum shifts, long enough to avoid constant whipsaws. In practice it captures ~the last 20 bars’ position of close within the high–low range.
K Smoothing = 10
A 10-period SMA applied to the raw %K moderates the “saw-tooth” effect that raw stochastic can exhibit in choppy phases. The smoothing reduces over-reaction to micro spikes while preserving the main rhythm of swings; visually, %K becomes a continuous path that is easier to read.
D Length = 10
%D is the moving average of smoothed %K. With 10, %D becomes a clearly slower guide line. The larger separation between %K(10-SMA) and %D(10-SMA of %K) produces cleaner crosses and fewer spurious toggles than micro settings (e.g., 3/3/3). On M5–M15 this pair often yields readable cross cycles without flooding the chart.
How the 20/10/10 trio behaves
In persistent trends, %K will spend more time near 20 or 80; the 10-period smoothing delays flips slightly and emphasizes only meaningful turn attempts.
In ranges, %K oscillates around mid-zone (40–60). With 10/10 smoothing, cross signals cluster less densely; combining with the |K–D| gap filter helps keep only decisive crosses.
If your symbol is unusually volatile or illiquid, reduce K Length (e.g., 14) or reduce K Smoothing (e.g., 7) to keep responsiveness. If crosses feel late, decrease D Length (e.g., 7). If noise is excessive, increase K Smoothing first, then consider raising D Length.
Visuals
OB/OS lines: default 80/20 reference levels and a midline at 50.
Masking near edges: %K can be temporarily hidden when it is pressing an edge, approaching it with low slope, or going nearly flat near the boundary. This keeps the panel readable during “stuck at the edge” phases.
Soft glow (optional): highlights %K’s active path; can be turned off.
Light/Dark palette: quick toggle to match your chart theme.
Scale safety: all plotted values (lines, fills, markers) are clamped to 0–100 to prevent the axis from expanding beyond the stochastic range.
Markers and filters
Neutral K–D cross markers: circles in the mid-zone when %K crosses %D.
Edge triangles: show when %K crosses 20 or 80; can be restricted to a session window (02:00–12:00 ET).
Filters (optional):
Min %K slope: require a minimum absolute slope so very flat crosses are ignored.
Min |K–D| gap: demand separation between lines at the cross moment.
%D slope agreement: keep crosses that align with %D’s direction.
Mid-zone mute: suppress crosses inside a user-defined 40–60 band (defaults).
Cooldown: minimum bars between successive markers.
Parameters (quick guide)
K Length / K Smoothing / D Length: core stochastic settings. Start with 20/10/10; tune K Smoothing first if you see too much jitter.
Overbought / Oversold (80/20): adjust for assets that tend to trend (raise to 85/15) or mean-revert (lower to 75/25).
Slope & gap filters: increase on very noisy symbols; reduce if you miss too many crosses.
Session window (triangles only): use if you want edge markers only during active hours.
Marker size and offset: cosmetic; they do not affect calculations.
Alerts
K–D Cross Up (filtered) and K–D Cross Down (filtered): fire when a cross passes your filters/cooldown.
Edge Up / Edge Down: fire when %K crosses the 20/80 levels.
All alerts confirm on bar close.
Notes & attribution
Original implementation and integration by Paifc0de; no third-party code is copied.
This indicator is for research/education and does not provide entries/exits or financial advice.

SZN - Altcoin OscillatorSZN Altcoin Oscillator – Identify Market Phases with Precision
What is the SZN Altcoin Oscillator?
The SZN Altcoin Oscillator is a multi-layered analysis indicator specifically developed for the altcoin market.
It combines different signal groups (trend, relative strength, volume, market environment, and overheating filters) into a unified oscillator in the 0–100 range.
--> The goal is to make major market movements visible while separating short-term fluctuations from broader trends.
Why not just use RSI or MACD?
Classic single indicators like RSI or MACD often react too sensitively to short-term fluctuations.
This leads to many false signals – especially during volatile altcoin phases.
--> The SZN Altcoin Oscillator solves this problem by combining and filtering multiple signal sources.
--> This smooths out overreactions and identifies true trend movements more reliably.
-----
How does it work?
The oscillator consists of five signal groups:
Price & Trend Momentum
checks the relative position of fast and slow moving averages
detects whether an altcoin is in a confirmed uptrend or downtrend
Relative Strength vs. Bitcoin & Ethereum
measures performance compared to the two market leaders
shows whether capital is rotating into altcoins or staying in majors
Volume and Breakout Filter
detects whether breakouts are confirmed by increased volume
prevents short “fakeouts” from appearing as buy signals
Market Environment (Regime Filter)
includes overall market data such as BTC dominance or TOTAL3
ensures that buy signals only trigger in suitable market phases
Overheating & Oversold Filter
marks statistically extreme zones
upward cross from oversold → buy signal
downward cross from overheated → sell signal
--> All results are displayed in a 0–100 oscillator.
Buy signal: upward cross from oversold zones
Sell signal: downward cross from overheated zones
-----
Variants (selection in the settings menu)
The indicator offers 5 preconfigured variants, optimized for different altcoin groups:
Default
The neutral standard configuration – balanced between sensitivity and stability. Suitable for a wide range of altcoins with medium to large market capitalization.
Large Caps
More conservative parameters with stronger smoothing. Designed for established projects (Top 20), where trends develop more slowly but with higher reliability.
Mid Caps
A balanced approach for mid-sized market caps. More sensitive than the Large-Cap variant, but filters more noise than the Small-Cap settings.
Small Caps
Higher sensitivity, optimized for more volatile coins (Top 100–200). Detects dynamic moves faster, but with higher risk of false signals.
Meme Coins
Adapted for highly speculative tokens. Accounts for extreme volatility and shorter cycles to better highlight overheating phases.
--> This allows each user to select the variant best suited to the asset category being analyzed.
-----
Recommended Usage
Timeframe: Daily chart (highest precision). For very new projects, the 8h chart can be used.
Asset selection: Coins with sufficient history (at least 200 trading days).
-----
Interpretation:
Oscillator rising from oversold → potential bottom / upward trend reversal
Oscillator falling from overheated → potential top / profit-taking zone
Movements in between indicate interim rallies or correction phases
The indicator is not a day-trading tool, but optimized for cyclical moves and swing trading.
-----
Notes:
The SZN Altcoin Oscillator is an additional analysis tool and does not replace independent trading decisions.
All signals are probabilistic; there is no guarantee of profits.
Effectiveness depends on the specific altcoin and the current market phase.
The indicator provides insights into broader market phases, not short-term price moves.

Enhanced Chande Momentum OscillatorEnhanced Chande Momentum Oscillator (Enh CMO)
📊 Description
The Enhanced Chande Momentum Oscillator is an advanced version of the classic Chande Momentum Oscillator with dynamic envelope boundaries that automatically adapt to market volatility. This indicator provides clear visual signals for potential price reversals and momentum shifts.
Key Features:
Original Chande Momentum Oscillator calculation
Dynamic upper and lower boundaries based on statistical analysis
Adaptive envelope that adjusts to market volatility
Visual fill area between boundaries for easy interpretation
Real-time values table with current readings
Built-in alert conditions for boundary touches
Customizable moving average types (SMA, EMA, WMA)
⚙️ Settings
CMO Settings:
CMO Length (9): Period for calculating the base Chande Momentum Oscillator
Source (close): Price source for calculations
Envelope Settings:
Envelope Length (20): Lookback period for calculating the moving average and standard deviation
Envelope Multiplier (1.5): Multiplier for standard deviation to create upper/lower bounds
Moving Average Type (EMA): Type of moving average for envelope calculation
📈 How to Use
Visual Elements
Lines:
White Line: Main Chande Momentum Oscillator
Red Line: Upper boundary (resistance level)
Green Line: Lower boundary (support level)
Yellow Line: Moving average of CMO (trend direction)
Purple Fill: Visual envelope between boundaries
Reference Lines:
Zero Line: Neutral momentum level
+50/-50 Lines: Traditional overbought/oversold levels
Trading Signals
🔴 Sell/Short Signals
CMO touches or crosses above upper boundary → Potential bearish reversal
CMO is above +50 and declining → Weakening bullish momentum
CMO crosses below yellow MA line while above zero → Momentum shift
🟢 Buy/Long Signals
CMO touches or crosses below lower boundary → Potential bullish reversal
CMO is below -50 and rising → Weakening bearish momentum
CMO crosses above yellow MA line while below zero → Momentum shift
⚡ Advanced Signals
Boundary contraction → Decreasing volatility, potential breakout coming
Boundary expansion → High volatility period, use wider stops
CMO hugging upper boundary → Strong uptrend continuation
CMO hugging lower boundary → Strong downtrend continuation
🎯 Trading Strategies
Strategy 1: Reversal Trading
Wait for CMO to touch extreme boundaries (red or green lines)
Look for divergence with price action
Enter counter-trend position when CMO starts moving back toward center
Set stop beyond the boundary breach point
Take profit near zero line or opposite boundary
Strategy 2: Momentum Confirmation
Use CMO direction to confirm trend
Enter positions when CMO crosses above/below yellow MA line
Hold positions while CMO remains on the correct side of MA
Exit when CMO crosses back through MA line
Strategy 3: Volatility Breakout
Monitor boundary width (envelope expansion/contraction)
When boundaries contract significantly, prepare for breakout
Enter in direction of CMO breakout from narrow range
Use boundary expansion as confirmation signal
⚠️ Important Notes
Best Timeframes
Scalping: 1m, 5m charts
Day Trading: 15m, 30m, 1H charts
Swing Trading: 4H, Daily charts
Market Conditions
Trending Markets: Focus on momentum confirmation signals
Ranging Markets: Focus on boundary reversal signals
High Volatility: Increase envelope multiplier (1.8-2.5)
Low Volatility: Decrease envelope multiplier (1.0-1.3)
Risk Management
Always use stop losses beyond boundary levels
Reduce position size during boundary expansion periods
Combine with price action and support/resistance levels
Monitor the real-time table for precise entry/exit levels
🔔 Alerts
The indicator includes built-in alert conditions:
"CMO Above Upper Bound": Potential reversal down signal
"CMO Below Lower Bound": Potential reversal up signal
Set these alerts to catch opportunities without constantly monitoring charts.
💡 Tips for Success
Combine with other indicators: Use with RSI, MACD, or volume indicators for confirmation
Watch for divergences: CMO making new highs/lows while price doesn't follow
Use multiple timeframes: Check higher timeframe CMO for overall trend context
Adjust settings for different assets: Crypto may need different settings than forex
Paper trade first: Test the indicator with your trading style before using real money
🎨 Customization Tips
Change colors in the Pine Script to match your chart theme
Adjust envelope length for faster (shorter) or slower (longer) signals
Modify envelope multiplier based on asset volatility
Hide the table if it obstructs your view by commenting out the table section
Complete trading solution: Pair with the Optimus Indicator (paid indicator) for multi-timeframe trend analysis and trend signals.
Together they create a powerful confluence system for professional trading setups.

Market Pressure Oscillator█ OVERVIEW
The Market Pressure Oscillator is an advanced technical indicator for TradingView, enabling traders to identify potential trend reversals and momentum shifts through candle-based pressure analysis and divergence detection. It combines a smoothed oscillator with moving average signals, overbought/oversold levels, and divergence visualization, enhanced by customizable gradients, dynamic band colors, and alerts for quick decision-making.
█ CONCEPT
The indicator measures buying or selling pressure based on candle body size (open-to-close difference) and direction, with optional smoothing for clarity and divergence detection between price action and the oscillator. It relies solely on candle data, offering insights into trend strength, overbought/oversold conditions, and potential reversals with a customizable visual presentation.
█ WHY USE IT?
- Divergence Detection: Identifies bullish and bearish divergences to reinforce signals, especially near overbought/oversold zones.
- Candle Pressure Analysis: Measures pressure based on candle body size, normalized to a ±100 scale.
- Signal Generation: Provides buy/sell signals via overbought/oversold crossovers, zero-line crossovers, moving average zero-line crossovers, and dynamic band color changes.
- Visual Clarity: Uses dynamic colors, gradients, and fill layers for intuitive chart analysis.
Flexibility: Extensive settings allow customization to individual trading preferences.
█ HOW IT WORKS?
- Candle Pressure Calculation: Computes candle body size as math.abs(close - open), normalized against the average body size over a lookback period (avgBody = ta.sma(body, len)). - Candle direction (bullish: +1, bearish: -1, neutral: 0) is multiplied by body weight to derive pressure.
- Cumulative Pressure: Sums pressure values over the lookback period (Lookback Length) and normalizes to ±100 relative to the maximum possible value.
- Smoothing: Optionally applies EMA (Smoothing Length) to normalized pressure.
- Moving Average: Calculates SMA (Moving Average Length) for trend confirmation (Moving Average (SMA)).
- Divergence Detection: Identifies bullish/bearish divergences by comparing price and oscillator pivot highs/lows within a specified range (Pivot Length). Divergence signals appear with a delay equal to the Pivot Length.
- Signals: Generates signals for:
Crossing oversold upward (buy) or overbought downward (sell).
Crossing the zero line by the oscillator or moving average (buy/sell).
Bullish/bearish divergences, marked with labels, enhancing signals, especially near overbought/oversold zones.
Dynamic band color changes when the moving average crosses MA overbought/oversold thresholds (green for oversold, red for overbought).
- Visualization: Plots the oscillator and moving average with dynamic colors, gradient fills, transparent bands, and labels, with customizable overbought/oversold levels.
Alerts: Built-in alerts for divergences, overbought/oversold crossovers, and zero-line crossovers (oscillator and moving average).
█ SETTINGS AND CUSTOMIZATION
- Lookback Length: Period for aggregating candle pressure (default: 14).
- Smoothing Length (EMA): EMA length for smoothing the oscillator (default: 1). Higher values smooth the signal but may reduce signal frequency; adjust overbought/oversold levels accordingly.
- Moving Average Length (SMA): SMA length for the moving average (default: 14, minval=1). Higher values make SMA a trend indicator, requiring adjusted MA overbought/oversold levels.
- Pivot Length (Left/Right): Candles for detecting pivot highs/lows in divergence calculations (default: 2, minval=1). Higher values reduce noise but add delay equal to the set value.
- Enable Divergence Detection: Enables divergence detection (default: true).
- Overbought/Oversold Levels: Thresholds for the oscillator (default: 30/-30) and moving average (default: 10/-10). For the moving average, no arrows appear; bands change color from gray to green (oversold) or red (overbought), reinforcing entry signals.
- Signal Type: Select signals to display: "None", "Overbought/Oversold", "Zero Line", "MA Zero Line", "All" (default: "Overbought/Oversold").
- Colors and Gradients: Customize colors for bullish/bearish oscillator, moving average, zero line, overbought/oversold levels, and divergence labels.
- Transparency: Adjust gradient fill transparency (default: 70, minval=0, maxval=100) and band/label transparency (default: 40, minval=0, maxval=100) for consistent visuals.
- Visualizations: Enable/disable moving average, gradients for zero/overbought/oversold levels, and gradient fills.
█ USAGE EXAMPLES
- Momentum Analysis: Observe the MPO Oscillator above 0 for bullish momentum or below 0 for bearish momentum. The SMA, being smoother, reacts slower and can confirm trend direction as a noise filter.
- Reversal Signals: Look for buy triangles when the oscillator crosses oversold upward, especially when the SMA is below the MA oversold threshold and the band turns green. Similarly, seek sell triangles when crossing overbought downward, with the SMA above the MA overbought threshold and the band turning red.
- Using Divergences: Treat bullish (green labels) and bearish (red labels) divergences as reinforcement for other signals, especially near overbought/oversold zones, indicating stronger potential trend reversals.
- Customization: Adjust lookback length, smoothing, and moving average length to specific instruments and timeframes to minimize false signals.
█ USER NOTES
Combine the indicator with tools like Fibonacci levels or pivot points to enhance accuracy.
Test different settings for lookback length, smoothing, and moving average length on your chosen instrument and timeframe to find optimal values.

Stochastic 6TF by jjuiiStochastic 6TF by J is a Multi-Timeframe (MTF) Stochastic indicator
that displays %K values from up to 6 different timeframes
in a single window. This helps traders analyze momentum
across short, medium, and long-term perspectives simultaneously.
Features:
- Supports 6 customizable timeframes (e.g., 5m, 15m, 1h, 4h, 1D, 1W)
- Option to show/hide each timeframe line
- Standard reference levels (20 / 50 / 80) with background shading
- Smoothed %K for clearer visualization
Best for:
- Cross-timeframe momentum analysis
- Spotting aligned Overbought / Oversold signals
- Confirming market trends and timing entries/exits
-------------------------------------------------------------
Stochastic 6TF by J คืออินดิเคเตอร์ Stochastic Multi Timeframe (MTF)
ที่สามารถแสดงค่า %K จากหลายกรอบเวลา (สูงสุด 6 TF)
ไว้ในหน้าต่างเดียว ช่วยให้นักเทรดมองเห็นโมเมนตัมของราคา
ทั้งระยะสั้น กลาง และยาว พร้อมกัน
คุณสมบัติ:
- เลือกกรอบเวลาได้ 6 ชุด (เช่น 5m, 15m, 1h, 4h, 1D, 1W)
- สามารถเปิด/ปิดการแสดงผลแต่ละ TF ได้
- มีเส้นแนวรับ/แนวต้านมาตรฐาน (20 / 50 / 80)
- ใช้เส้น %K ที่ถูกปรับค่าเฉลี่ยให้เรียบขึ้นเพื่ออ่านง่าย
เหมาะสำหรับ:
- การดูโมเมนตัมข้ามกรอบเวลา
- หาจังหวะ Overbought / Oversold ที่สอดคล้องกันหลาย TF
- ใช้ยืนยันแนวโน้มและหาจังหวะเข้า-ออกอย่างแม่นยำมากขึ้น
Multi-Timeframe Stochastic RSI Momentum MatrixThis indicator gives you a "bigger picture" view of a stock's momentum by showing you the Daily, Weekly, and Monthly Stoch RSI all in one place. It helps answer two key questions: "Where is the price going?" and "When might things change?". The results of this indicator are presented in a table for easy viewing.
What the Columns Mean:
Stoch RSI : The main momentum score. Red means "overbought" (momentum is high and might be getting tired), and green means "oversold" (momentum is low and might be ready to bounce).
Price for OB/OS : This shows you the approximate price the stock needs to hit to become overbought or oversold.
- (Hist) means the target is a real price that happened recently.
- (Pred) means the price has exceeded the historical momentum boundary at which was oversold or overbough so the indicator has to predict a new target instead of leveraging a historical target.
Key Anchor Reset In : Think of this as a simple countdown. It tells you how many bars (days, weeks, etc.) are left until a key old price is dropped from the indicator's memory. When this countdown hits zero, it can cause a sharp change in the momentum reading, giving you a "heads-up" for a potential shift.
If you're interested in more technical details, read below:
I have leveraged a quantitative framework for analyzing the temporal dynamics of the Stochastic RSI across multiple timeframes (Daily, Weekly, Monthly). It functions as a correlational matrix, designed to move beyond simple overbought/oversold signals by providing contextual and data-driven targets in both price and time.
The matrix computes two primary sets of forward-looking data points:
Price Targets : A hybrid model is employed to determine the price required to push the StochRSI oscillator into an extreme state.
- Historical Anchor (Hist) : This is the primary/default method. It identifies the
deterministic close price within the lookback period that corresponds to the highest (or
lowest) RSI value. This represents a concrete and historically-defined momentum boundary.
- Predictive Heuristic (Pred) : In instances where the current price has invalidated this
historical anchor (i.e., the market is in a state of momentum expansion), the model
switches to a predictive heuristic. It calculates the recent price-to-RSI volatility ratio and
extrapolates the approximate price movement required to achieve an overbought or
oversold state.
Temporal Targets ("Key Anchor Reset In") : This metric provides a temporal forecast. It identifies the highest and lowest RSI values currently anchoring the Stochastic calculation and determines the number of bars remaining until these key data points are excluded from the lookback window. The roll-off of these anchors can precede a significant, non-linear reset in the oscillator's value, thus serving as a leading indicator for a potential momentum state-shift.
Disclaimer : This tool is a derivative of historical price action and should be used for quantitative analysis of momentum states, not as an oracle. The "predictive" components are heuristic extrapolations based on recent volatility and momentum characteristics and they are probabilistic in nature and do not account for exogenous market variables or fundamental shifts. All outputs are contingent on the continuation of the ticker's current momentum profile.

Algorithmic Value Oscillator [CRYPTIK1]Algorithmic Value Oscillator
Introduction: What is the AVO? Welcome to the Algorithmic Value Oscillator (AVO), a powerful, modern momentum indicator that reframes the classic "overbought" and "oversold" concept. Instead of relying on a fixed lookback period like a standard RSI, the AVO measures the current price relative to a significant, higher-timeframe Value Zone .
This gives you a more contextual and structural understanding of price. The core question it answers is not just "Is the price moving up or down quickly?" but rather, " Where is the current price in relation to its recently established area of value? "
This allows traders to identify true "premium" (overbought) and "discount" (oversold) levels with greater accuracy, all presented with a clean, futuristic aesthetic designed for the modern trader.
The Core Concept: Price vs. Value The market is constantly trying to find equilibrium. The AVO is built on the principle that the high and low of a significant prior period (like the previous day or week) create a powerful area of perceived value.
The Value Zone: The range between the high and low of the selected higher timeframe.
Premium Territory (Distribution Zone): When the oscillator moves into the glowing pink/purple zone above +100, it is trading at a premium.
Discount Territory (Accumulation Zone): When the oscillator moves into the glowing teal/blue zone below -100, it is trading at a discount.
Key Features
1. Glowing Gradient Oscillator: The main oscillator line is a dynamic visual guide to momentum.
The line changes color smoothly from light blue to neon teal as bullish momentum increases.
It shifts from hot pink to bright purple as bearish momentum increases.
Multiple transparent layers create a professional "glow" effect, making the trend easy to see at a glance.
2. Dynamic Volatility Histogram: This histogram at the bottom of the indicator is a custom volatility meter. It has been engineered to be adaptive, ensuring that the visual differences between high and low volatility are always clear and dramatic, no matter your zoom level. It uses a multi-color gradient to visualize the intensity of market volatility.
3. Volatility Regime Dashboard: This simple on-screen table analyzes the histogram and provides a clear, one-word summary of the current market state: Compressing, Stable, or Expanding.
How to Use the AVO: Trading Strategies
1. Reversion Trading This is the most direct way to use the indicator.
Look for Buys: When the AVO line drops into the teal "Accumulation Zone" (below -100), the price is trading at a discount. Watch for the oscillator to form a bottom and start turning up as a signal that buying pressure is returning.
Look for Sells: When the AVO line moves into the pink "Distribution Zone" (above +100), the price is trading at a premium. Watch for the oscillator to form a peak and start turning down as a signal that selling pressure is increasing.
2. Best Practices & Settings
Timeframe Synergy: The AVO is most effective when your chart timeframe is lower than your selected "Value Zone Source." For example, if you trade on the 1-hour chart, set your Value Zone to "Previous Day."
Confirmation is Key: This indicator provides powerful context, but it should not be used in isolation. Always combine its readings with your primary analysis, such as market structure and support/resistance levels.

Premier Stochastic Oscillator [LazyBear, V2]This script builds on the well-known Premier Stochastic Oscillator (PSO) originally introduced by LazyBear, and adds a Z-Score extension to provide statistical interpretation of momentum extremes.
Features
Premier Stochastic Core: A smoothed stochastic calculation that highlights bullish and bearish momentum phases.
Z-Score Mapping: The PSO values are standardized into Z-Scores (from –3 to +3), quantifying the degree of momentum stretch.
Positive / Negative Z-Scores:
Positive Z values suggest momentum strength that can align with accumulation or favorable buying conditions.
Negative Z values indicate stronger bearish pressure, often aligning with selling or distribution conditions.
On-Chart Label: The current Z-Score is displayed on the latest bar for quick reference.
How to Use
Momentum Confirmation: Use the oscillator to confirm whether bullish or bearish momentum is intensifying.
Overextended Conditions: Extreme Z-Scores (±2 or beyond) highlight statistically stretched conditions, often preceding reversions.
Strategic Integration: Best applied in confluence with trend tools or higher-timeframe filters; not a standalone trading signal.
Originality
Unlike the standard PSO, this version:
Adds a Z-Score framework for objective statistical scaling.
Provides real-time labeling of Z values for clarity.
Extends the classic oscillator into a tool for both momentum detection and mean-reversion context.
