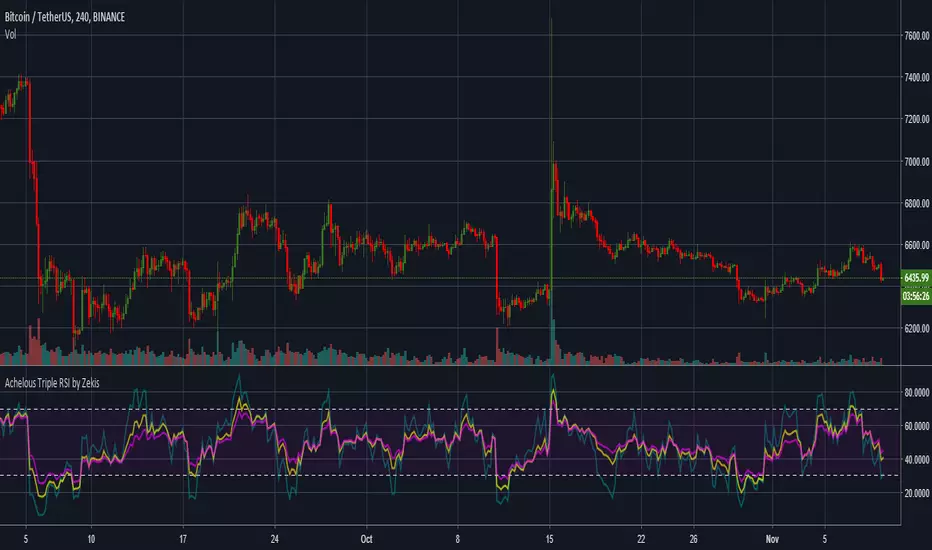
Achelous Triple RSI by ZekisTriple RSI (Relative Strength Index) in one script for a better view and a better analysis of the chart
Values and colors can be adjusted
Enjoy!
@ Zekis
Overbought-oversold
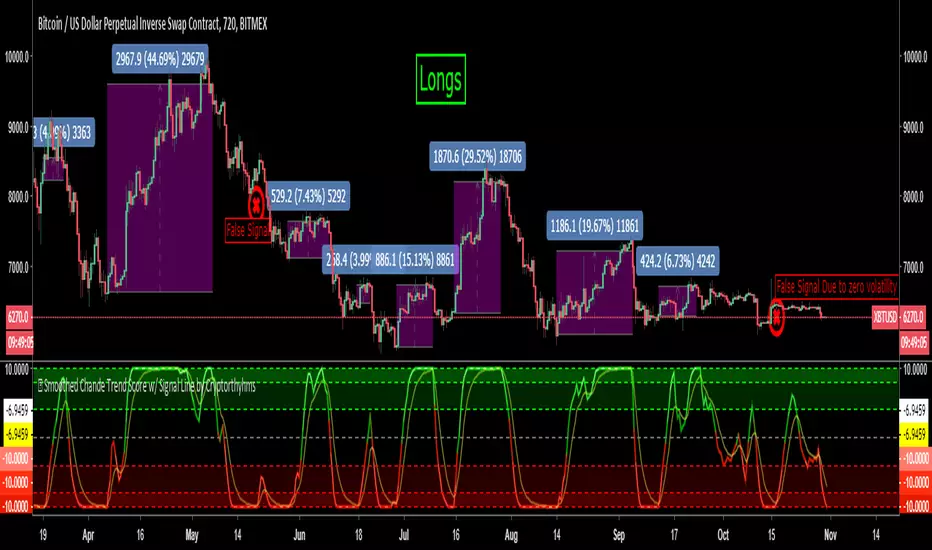
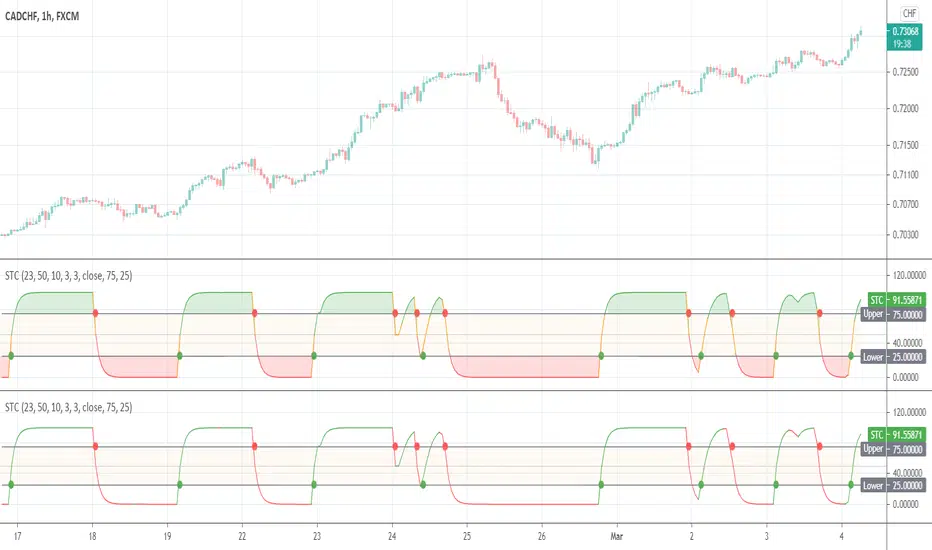
Smoothed Chande Trend Score w/ Signal Line by Cryptorhythms🆓 Smoothed Chande Trend Score w/ Signal Line by Cryptorhythms
👀Did not see this one in the public library yet, so here you go! I added an ema signal line that you can configure the length on. Also dressed it up a little with OB/OS zones and some purdy colors.
Here are long + short charts:
👍Enjoying this indicator or find it useful? Please give me a like and follow! I post crypto analysis, price action strategies and free indicators regularly.
💬Questions? Comments? Want to get access to an entire suite of proven trading indicators? Come visit us on telegram and chat, or just soak up some knowledge. We make timely posts about the market, news, and strategy everyday. Our community isnt open only to subscribers - everyone is welcome to join.
Description written by Chande...
As you may have noticed, a number of rather complicated indicators are available to measure trend strength. None of these indicators, unfortunately, is perfect. You could use J. Welles Wilder's average directional index (ADX) as an indicator of trend strength, or perhaps the r² value from linear regression analysis. Or you could even use the vertical horizontal filter (VHF) to help determine whether the market is trending.
Each of these indicators requires the user to determine how many days' data should be used in the calculations. As you vary the indicator length or number of days used in the calculation, however, the result of the calculation changes also. Thus, there is no unambiguous answer. If the market were about to enter or leave a trading range, you could get a different indication of trend strength every day — a frustrating set of circumstances.
RATING THE TREND
Here is my way of rating a trend, a method I call trendscore.
Add up the score for 10 comparisons; the score varies from + 10 to -10. If today's close is greater than all the previous closes, then the trend's score is +10; if today's close is less than all the previous closes, the score is -10. You can smooth the data by adding fewer than 10 days or more than 10 days. A positive score shows an upward trend bias. Similarly, a negative score shows a downward bias. A shorter time of comparison may be too volatile, producing frequent trend change signals, while a longer comparison time is slow to respond. During long trends, the trendscore remains at the outer limits, +10 or -10, for the duration of the trend. In sideways markets, the score doesn't remain at +10 or -10 for long, oscillating between these limits.
How to Use this Indicator
You could trade the trendscore many ways. You could use the zero crossing as an early signal. You would then buy when the trendscore becomes positive and sell when it becomes negative. Or you could wait one to three days after the trendscore reaches +10 or -10 before buying (+ 10) or selling (-10) . Or you could combine the trendscore with a moving average, trading an upward or downward cross over.
Another variation would be to go long after the trendscore crosses from -10 to above +5 and go short after the trendscore falls from +10 to below 5. The approach you choose depends on your trading style. You could also smooth the trendscore with more or fewer days than I used in my calculations. You could, for example, use fewer than 10 days for short-term and 20 to 30 days for intermediate-term trading. You could also combine trendscore with other indicators of trend strength. For example, if you combined it with the VHF indicator, trendscore would provide an indication of direction, while the VHF could provide additional information about the trend's strength. You could also substitute intraday data in the trendscore method for short-term trading, using hourly data to calculate a trend's score instead of daily data. Trendscore is a simple way to rate trend strength. It indicates both the direction and strength of the trend and can be easily combined with various trend-following strategies.
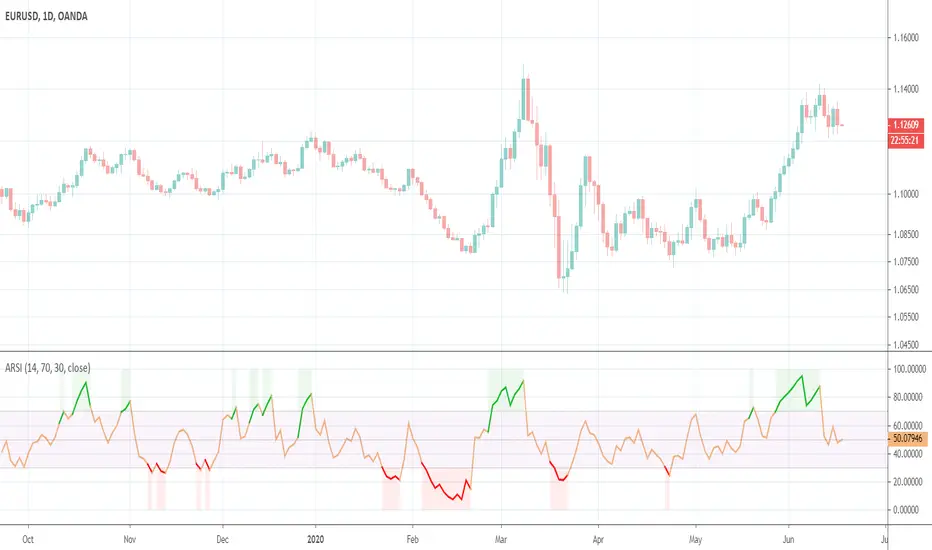
Asymmetrical RSIThis indicator was originally developed by Sylvain Vervoort (Stocks & Commodities, V.26:11 (October, 2008): "ARSI, The Asymmetrical RSI").
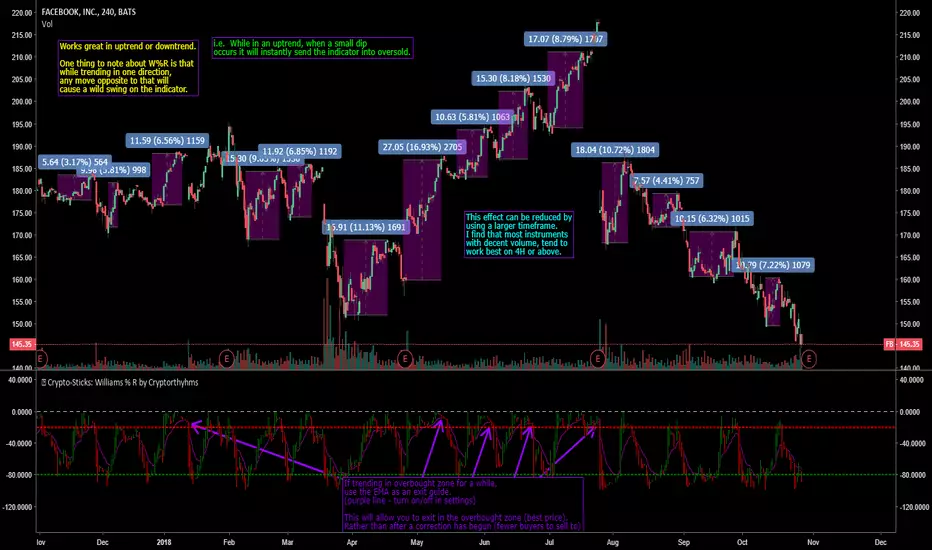
🥢Crypto-Sticks: Williams % R by Cryptorthyhms🥢 Crypto-Sticks™ Williams %R
A new series of indicators brought to you by Cryptorthyhms...giving you an alternate look at your trusted favorites! Follow me, there are still 2 dozen Crypto-Sticks indicators planned - all will be released in public library.
🚀 Indicator Specific Info
New in this indicator is an EMA of the average signal line output. Eventually I will go back and update the previous indicators with this feature as well!
⛔Please remember that you may have to adjust the overbought and oversold levels to suit the volatility of the instrument you are working with. In the future I will implement a feature that does this automatically, but for now its manual.
Heiken Ashi candles (default) adds some more clear trend changing points which can be executed at the second candle going in either direction. Other coins/charts will require their own strategy - you could potentially have to tweak that parameter. In this example you would enter on 2nd green, exit on 2nd red.
Volume weighting the HA candles adds a different dimension to the indicator which I have to explore more fully. With W%R I find it to be an interesting transformation of the output. The indicator tends to stay in overbought ranges longer, and only dips quickly to oversold. The opposite is also true in a downtrend. In this example I would personally increase the overbought zone and decrease the oversold zone to match up better with the historical results. An example of VW+HA:
Enjoying this indicator or find it useful? Please give me a like and follow! There are many more indicators to be released in this series, not to mention I post crypto analysis and other free indicators regularly.
Questions? Comments? Want to get access to an entire suite of proven trading indicators? Come visit us on telegram and chat, or just soak up some knowledge. We make timely posts about the market, news, and strategy everyday. Our community isn't open only to subscribers - everyone is welcome to join.
🥢Crypto-Sticks: True Strength Index 1.0 by Cryptorthyhms🥢 Crypto-Sticks™ True Strength Index
A new series of indicators brought to you by Cryptorthyhms...giving you an alternate look at your trusted favorites!
🚀 Indicator Specific Info
Signal Line can be configured in options, but I personally prefer heiken candles to the signal line.
⛔Please remember that you may have to adjust the overbought and oversold levels to suit the volatility of the instrument you are working with. In the future I will implement a feature that does this automatically, but for now its manual.
The OB/OS zones are given in two levels, because often you can find a line of best fit that will hit "small movements" and one that will hit "big movements." In this case I chose 25 and -25 for the small zones. For the bigger zones I chose 50 and -50.
Heiken Ashi candles adds some more clear trend changing points which can be executed at the second candle going in either direction. Other coins/charts will require their own strategy - you could potentially have to tweak that parameter. In this example you would enter on 2nd green, exit on 2nd red. Here is the Heiken Ashi example:
Volume weighting the HA candles adds a different dimension to the indicator which I have to explore more fully. On this particular indicator it adds alot -1.51% more noise, and I dont particularly care for it, but YMMV. Example of what I mean:
💭Please leave me any ideas or feedback you have!
🚫If you use volume weighting you should be on heiken candles.
🚀 Crypto-Sticks General Info
🚧This series isnt polished 100%, and I have some more options I will add in the future. But for now, I want to just release them, as I am not sure when I will have the time to put more work into them (many other big projects I am working on).
📊Its basically reinterpretations of all your favorite indicators. I calculate the values a little bit differently than normal, but the end result is creating a candlestick chart (for the indicator!). Then I added the option to plot them as Heiken Ashi candles to smooth out noise and make signaling easier. I recommend using the indicator on this setting.
🔊Lastly I implemented a Volume Weighting system for them all which simply integrates volume into the formulas for these indicators. For the most part this feature is experimental and doesn't provide huge utility (yet - I have other ways I want to try it as well - just no time). Though on some of the indicators it already shows great promise.
👍Enjoying this indicator or find it useful? Please give me a like and follow! There are many more indicators to be released in this series, not to mention I post crypto analysis and other free indicators regularly.
💬Questions? Comments? Want to get access to an entire suite of proven trading indicators? Come visit us on telegram and chat, or just soak up some knowledge. We make timely posts about the market, news, and strategy everyday. Our community isnt open only to subscribers - everyone is welcome to join.

Schaff Trend CycleThis indicator was originally developed by Doug Schaff in the 1990s (published in 2008).
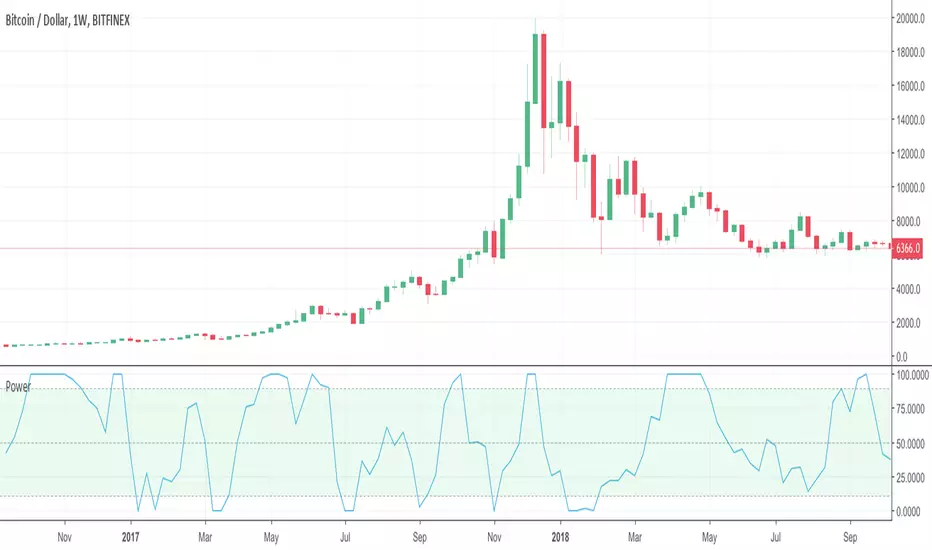
Power Oscillator by Atilla YurtsevenThis is the oscillator i have developed to find out the strength of the trends and the end of the pullbacks or the trends. Of course this is not the only way. Still needs more confirmations. You can chose RSI, Momentum, Price or DeMarker as Oscillator type.
Price type is one of the models i have developed. The others are calculated using RSI, Momentum and DeMarker.
Please remember to share your strategies, thoughts using Power oscillator and add some comments.
Disclaimer: This is not a financial advice. Shared for educational purposes only!
Happy trading
Atilla Yurtseven
MTF RSI by Emiliano MesaA MTF RSI . It shows you either the RSI is oversold or overbought in up to 4 different timeframes which are all fully customizable by the user. Furthermore it allows you to set the oversold and overbought levels.
Green : Overbought
Red : Oversold
Gray : Neither overbought or oversold
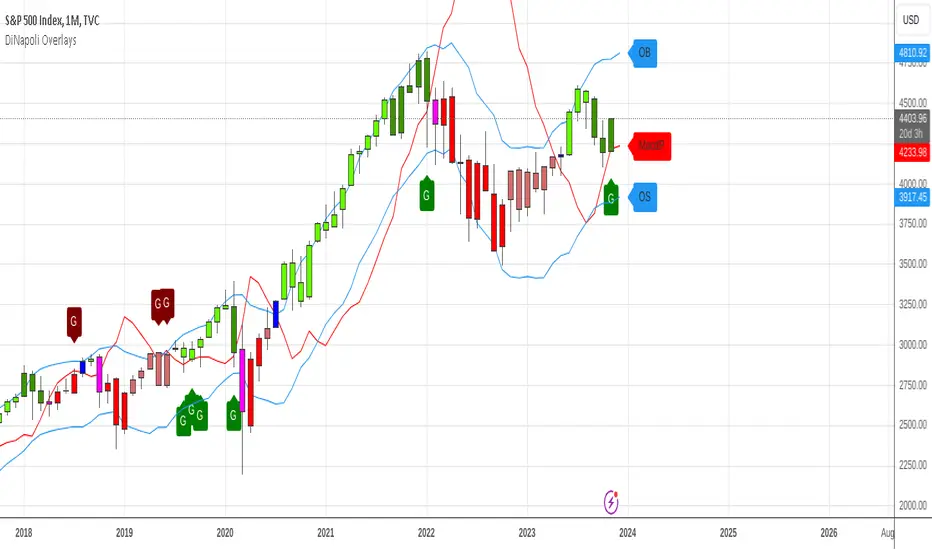
DiNapoli Bundle Overlay (4-in-1)DiNapoli Overlays 4-in-1 is a Bundle that includes the 4 studies used by DiNapoli in the price chart in just 1 single indicator :
DiNapoli Color Candles
DiNapoli MACD Predictor (MacdP)
DiNapoli Oscillator Predictor (OscP)
DiNapoli DMAs
This Bundle version includes the following features :
Ability to select multiple Overlay Studies to be plotted: Colored Candles, MacdP, OscP, DMAs
Show/Hide each indicator
Show/Hide each DMA
Plot Stop Grabbers
Set OB/OS Oscillation Period
Set OB/OS Factor Ratio to each Market
Show OB/OS Levels
Show Preceding OB/OS Cloud
For convenience it also includes Custom Alerts . Now it is possible to get alerts on:
Signal DiNapoli Cycle Shift
New DiNapoli Bull Cycle
New DiNapoli Bear Cycle
Signal DiNapoli Cycle Strength
DiNapoli Bull Cycle Strength
DiNapoli Bear Cycle Strength
Signal DiNapoli Cycle Weakness
DiNapoli Bull Cycle Weakness
DiNapoli Bear Cycle Weakness
MACDP Cross
MACDP Bullish Cross
MACDP Bearish Cross
Stop Grabber
Bullish Stop Grabber
Bearish Stop Grabber
OverBought Condition
Entering OverBought Condition
Exiting OverBought Condition
OverSold Condition
Entering OverSold Condition
Exiting OverSold Condition
DMA Cross
Bullish DMA Cross
Bearish DMA Cross
This indicator is meant to be used by professional traders.
If you would like to subscribe , please send me a private message.
DiNapoli Bundle Oscillators 3-in-1DiNapoli Oscillators 3-in-1 is a Bundle that includes the 3 oscillators used by DiNapoli in just 1 single indicator :
DiNapoli MACD (Dema)
DiNapoli Preferred Stochastic
DiNapoli Detrended Oscillator (DOSC)
This Bundle version includes the following features :
Ability to select which Oscillator to plot: MACD, Stochastic or Detrended
Show/Hide the Oscillation Lines
Show Crosses with Signal Line
Add a label to each oscillator for ease of identification
Adapt OB/OS Factor Ratio to each Market
Show OB/OS Levels
Show Preceding OB/OS Cloud
Show Divergences (experimental)
For convenience it also includes Custom Alerts . Now it is possible to get alerts on:
Oscillator Cross
Bullish Oscillator Cross
Bearish Oscillator Cross
OverBought Condition
Entering OverBought Condition
Exiting OverBought Condition
OverSold Condition
Entering OverSold Condition
Exiting OverSold Condition
Possible Regular Divergence
Possible Regular Bullish Divergence
Possible Regular Bearish Divergence
This indicator is meant to be used by professional traders.
If you would like to subscribe , please send me a private message.

DiNapoli Detrended Oscillator (DOSC)DiNapoli Detrended Oscillator (DOSC) is a custom indicator used for identifying OverBought (OB) and OverSold (OS) condition in markets.
This version of the indicator includes the following features :
Show/Hide the Oscillation Lines
Set Custom Oscillation Periods
Adapt OB/OS Factor Ratio to each Market
Show OB/OS Levels
Show Preceding OB/OS Cloud
Highlight OB/OS Condition in the Line
Show the Zero Line
Show Divergences (experimental)
For convenience it also includes Custom Alerts . Now it is possible to get alerts on:
OverBought Condition
Entering OverBought Condition
Exiting OverBought Condition
OverSold Condition
Entering OverSold Condition
Exiting OverSold Condition
Oscillator Cross
Bullish DOSC Strength
Bearish DOSC Strength
Possible Regular Divergence
Possible Regular Bullish Divergence
Possible Regular Bearish Divergence
This indicator is meant to be used by professional traders.
If you would like to subscribe , please send me a private message.

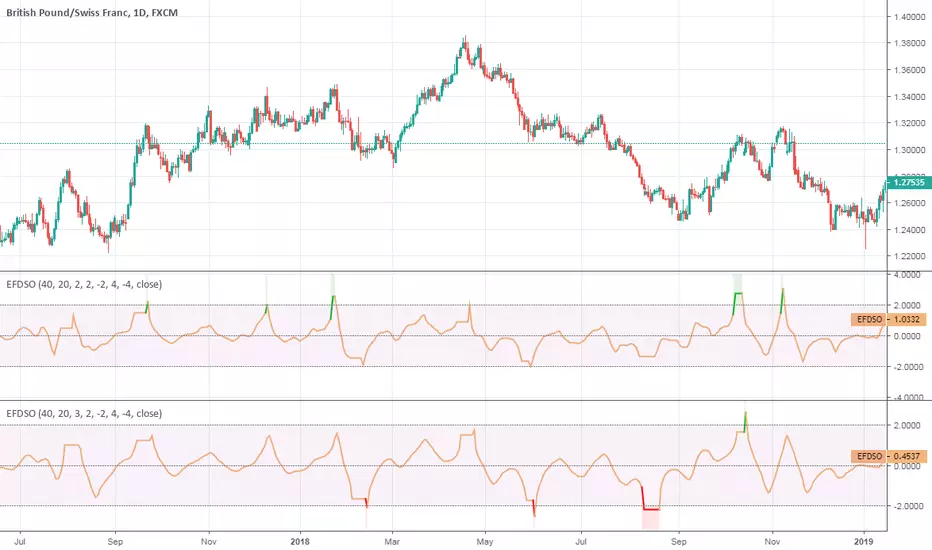
Ehlers Fisherized Deviation-Scaled OscillatorEhlers Fisherized Deviation-Scaled Oscillator script.
This indicator was originally developed by John F. Ehlers (Stocks & Commodities V. 36:11: Probability - Probably A Good Thing To Know).
RSI or MFI %BPlots where RSI or MFI is inside its Bollinger Bands. Various strategies: good to see the trend (above/below average), overbought/oversold conditions (you could work a strategy around RSI getting out of overbought/oversold conditions as shown in the screenshot), divergences, etc...
I will also publish a Bollinger Bands width of RSI to identify areas of squeeze in volatility
Enjoy!

Distance From 200-day moving averagePlot of the distance from the 200ma. Helpful to identify areas where max distance from the 200ma caused a drop down or jump up to the mean

RSI Swing Signal - ChartThis indicator is the chart version intended to accompany my custom RSI oscillator:
CLICK HERE TO SEE BASE INDICATOR
CLICK HERE TO SEE BASE INDICATOR

FofT - 1h, 4h, and Daily RSI in any time intervalView multiple-timeframe RSIs in a single interval. All RSI lines stay the same no matter your preference to trade in 15m, 1h, 3h…. etc.
Default RSI length is 7 (can be changed in the format settings)
All RSIs are smoothed out in default (can be changed in the format settings)
Line colors
5m RSI - white (disabled in default)
15m RSI - Lime (disabled in default)
1h RSI - Yellow
4h RSI - Red
D RSI - Blue
Overbought and Oversold threshold colors
>70 (grey) - overbought
>80 (orange) - highly overbought
>90 (pink) - extremely overbought
=50 (black dotted lines) - equilibrium
<30 (grey) - oversold
<20 (orange) - highly oversold
<10 (pink) - extremely oversold
How to add to chart
* Click on "Add to Favorite scripts" in the bottom right
* While in chart view click on "/" button on your keyboard or click on the Indicators button on the top tool bar
* Go to Favorites Tab and click on this indicator
Other interval RSIs will be added based on request. Feel free to leave any questions or requests in the comment section below.
If you find this script useful, please like and share.

Rsi/Cci Overbought Oversold CandlesThis indicator will allow you to see overbought and oversold areas of the rsi or the cci, you must set yourself the upper and lower band of the rsi (70-30) or cci (100, -100). By default, it's Rsi
I have already posted the same indicator but only with the Rsi, I wanted to posted a more complete that offers the 2.
On the chart, it is the overbought / oversold area of the Cci that is displayed

DBT MoMo v2DBT MoMo v2 uses everything in the MoMo v1 and more. The MoMo finds areas of extension, to the downside and upside. These areas create good opportunities for long and short positions. It consist of a 3 candle back MoMo line and 24 candle back MoMo line. When both lines are above 10 this shows the bulls are very extended and a pullback or trend reversal is imminent, this will be signified as a gold background on the MoMo. When both MoMo lines are below -10 this shows the bears are very extended and a pullback or trend reversal to the upside is imminent, this will be signified as a purple background on the MoMo. When both MoMo lines are correlating and moving in the same direction the trend is strong. If they are showing inverse signals or the 3 MoMo is rapidly moving while the 24 MoMo is flat this means the trend is choppy or weak. When both MoMos are below -10 or above +10 and the 3 momo rapidly moves to +10 or -10, but the 24 momo remains flat this typically shows a trap is being played and you want to be careful taking a trade in the direction of the 3 MoMo. The midline is a trend line that shows trend direction, green for up red for down and white for sideways.
Use at your own risk. This is not financial advise and this indicator is not guaranteed to make you profits. Please message me if you have any questions or feedback. Enjoy.
This is the Official release of the DBT MoMo. It will be available on my website upon launch. Please do not ask for access. If you would like access please go to my website once it releases, Thank You.

Overbought Oversold CandlesA simple script that indicates the overbought and oversold area of the rsi by coloring the candlesticks

Volume/Rsi Overbought/oversoldI present you my last indicator. A volume indicator that indicates overbought and oversold based on the rsi, I chose the rsi because the most used surment, this indicator allows you to identify the overbought and oversold areas of the rsi with the colors blue (oversold) and orange (overbought ) on the volume indicator! Hoping that you are useful
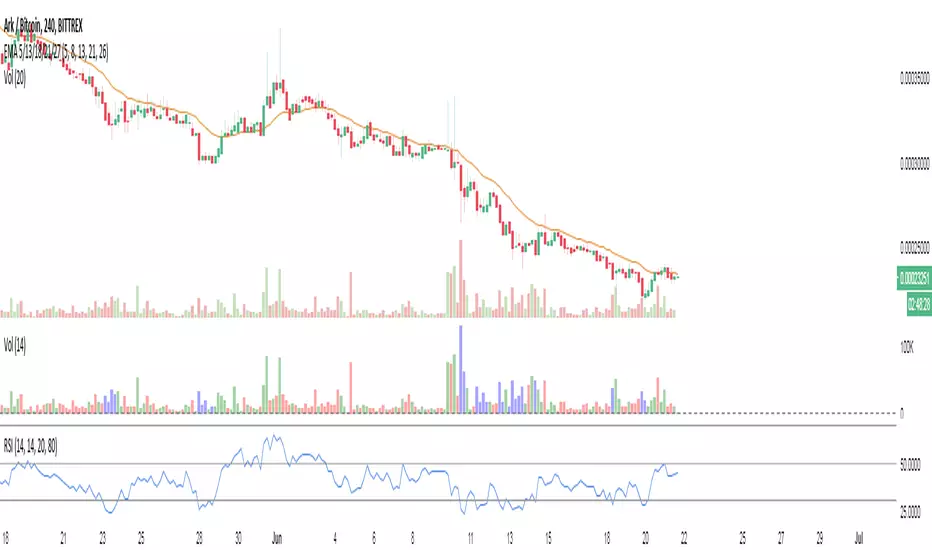
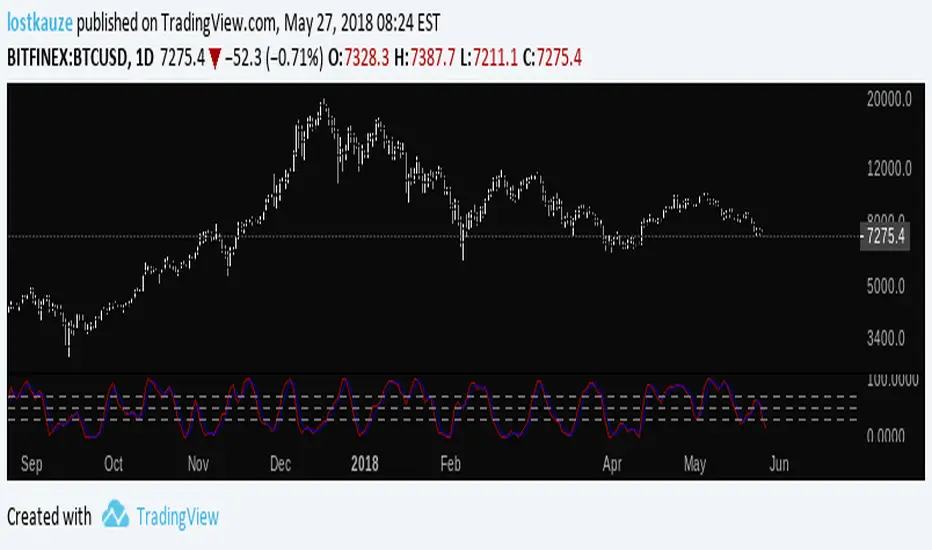
Stoch BitfinexSimilar to RSI Bitfinex , but Stoch version.
It applies Stochastic Oscillator to BTC longs/shorts ratio on Bitfinex. You can use the oscillator as you'd use Stoch:
- Divergences
- Oversold/overbought signals
- R/S on the indicator
- Trend indication
- etc
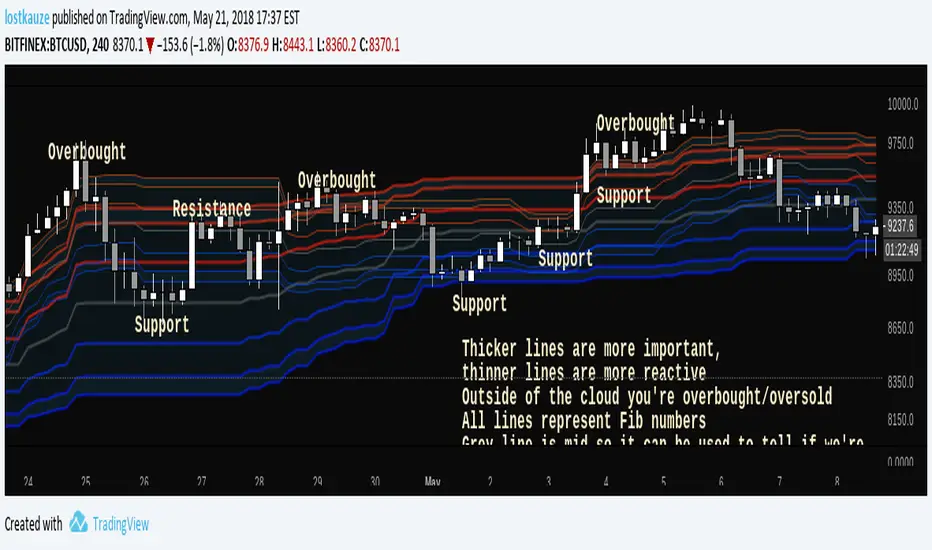
Fibonacci CloudInspired by Ichimoku Fibonacci Hybrid , this indicator is for those who don't mind a lot of lines. All lines represent Fib ratios: thicker lines are fibs for a longer period, while thinner lines are fibs for a shorter period.
- Dynamic S/R
- Overbought/Oversold zones
- Trend indicator
- Customisable periods
- Fast/Slow crossovers
See what works for you!
Ichimoku Fibonacci HybridHey guys, this is a variation of Ichimoku using Fibonacci principles.
Overview
As you may know, Ichimoku uses in its calculations (high + low)/2 to calculate Tenkan-sen (Conversion line) and Kijun-sen (Base line) for different periods: Tenkan is a shorter period, so it reacts faster to reversals, while Kijun is slower, so it reacts slower, and it is contextually more reliable due to how conservative it is.
Why does the Ichimoku Cloud works? My theory that inspired this indicator is that it works because it looks at 50% retracements from highest point to the lowest point. In other words, Tenkan plots the 50% line between the peak and the trough from the recent period, which has proven to often be a good estimation for retracements. Similarly, Kijun applies the same, but for a longer period*.
However, if we look at Fibonacci retracement, it is often the case that price retracts to those magical percentages: 23.6%, 38.2%, 50%, 61.8%, and sometimes even 88.6% and 78.6%. Why this happens is largely unknown to the academic community, but, empirically, it often seems that these numbers just work.
Therefore, I wanted to apply this principle to Ichimoku calculations, and instead of calculating (high + low)/2, I calculated both (high + low) * 0.382 and (high + low) * 0.618. These lines should provide pessimistic/bearish estimations, and optimistic/bullish estimations, respectively. Naturally, these results in 4 extra lines: a bearish Tenkan/Kijun pair and a bullish Tenkan/Kijun pair.
Therefore, applying this indicator will crowd the chart quite a bit: you have 6 lines on the chart among which 2 of them are the original Tenkan and Kijun lines, and the other 4 are Fib-inspired Tenkan/Kijun lines.
Usage
As with most indicators, usage is subjective to the user and relative to the chart. However, some ways in which this indicator can be used are as follows:
In a strong uptrend, price is typically above both Ichi Kijun and Tenkan. In this case, you can use this indicator to provide you with a new pair of bullish Kijun/Tenkan that provide the same usage as before. Similarly, in a downtrend, the bearish Kijun/Tenkan apply.
Using the new lines, one can apply R/S levels, crossover signals, overbought/oversold areas, price channels, retracement levels, and trend indications.
One may simply use it out of convenience, as it automatically computes potential areas of interest without having to perform manual work.
Please note that because the indicator was so full, I did not keep the Cloud, nor did I keep the Chikou span (Lagging span.) These can be easily implemented, but it would crowd the chart to an extent that it would be difficult to gauge much information. However, I did consider adding them as optional indicators that are disabled by default, and I may potentially do so in the future. For reference, this would help by simply disabling everything else besides the "bullish Ichi" in an uptrend.
Footnotes
* I have heard people referring to Ichimoku Cloud as "a glorified average mean," but, mathematically, I don't believe there is much relationship between MAs and Ichimoku Cloud. However, I acknowledge the visual similarity between the two and the potential to use both in a similar fashion, so one may interpret this indicator as such if they please.
