Quantum Edge Scalper - Adaptive Precision Trading [KedArc Quant]Strategy Overview
Quantum Edge Scalper is a multi-regime intraday strategy engineered for adaptability across equities. It fuses EMA trend & slope, RSI sanity checks, ATR-based volatility gating, and candle-shape filters. Regime detection (ATR%% z-score) tunes thresholds on-the-fly, while an optional OSS — Oversold Short Override captures late-session breakdowns. Robust day-level controls include trade caps, cooldowns, and loss-streak stops. A compact panel summarizes live session stats.
Key Features
• Preset modes: Aggressive / Aggressive+ / Conservative / Hybrid / Custom.
• EMA Fast/Slow trend filter + EMA-separation slope gate.
• ATR volatility floor (percent-of-price) to avoid dead markets.
• Candle-shape and wick-ratio filters to curb false breakouts.
• Regime adaptation using ATR% z-score (HIGH / LOW / NEUTRAL).
• Hybrid+ LOW-regime extras: tighter SL, adaptive TP, mid-session pause, loss-streak blocker.
• OSS (Oversold Short Override): validators for micro-pullback, range expansion, structure break, and time window.
• Daily caps & loss-streak protection; cooldown management post wins/losses.
• Clean summary labels + compare panel; optional debug labels.
指標和策略

Ultra-Precise Scalper with OB, W/M & Liquidity Sweepsupport and resistance with order block detection and M and W PATTERNS

VWAP TrendGuard [KedarArc Quant]Strategy Overview: A non-repainting intraday strategy that pairs VWAP entries with an EMA-based trend gate on the entry timeframe. Entries come from VWAP Cross or Cross+Retest, with an optional Momentum exception. Exits use either an ATR emergency stop or a structural TrendBreak. The Today Panel summarizes Net-R, Win%, and PF for the current session.
Non-repainting: all higher-timeframe requests use lookahead_off (no peeking).
Works across intraday frames; keep the HTF filter your chart timeframe.
Signals & Exits
Trend gate (entry timeframe): trendUp if EMA(fast) > EMA(slow); trendDown otherwise.
Volume gate: volume SMA(volume, volLen) × volMult.
Long (Base): trendUp & volOK AND (cross above VWAP OR (Cross+Retest AND recent low VWAP
within lookback)).
Short (Base): trendDown & volOK AND (cross below VWAP OR (Cross+Retest AND recent high VWAP within lookback)).
Momentum exception (optional): body momBodyPct AND volume SMA × momVolMult allows fast
entry.
TrendBreak exit: Long closes when price < VWAP AND EMA(fast) < EMA(slow); Short closes on the
opposite.
ATR emergency stop: strategy.exit at entry with stop = close ± ATR(atrLen) × atrMult.

Day Range Breakout Strategy + Trend Structure Filter🚀 Enhanced Strategy for Breaking Previous Day’s Extremes with Market Structure-Based Trend
The strategy focuses on breakouts of previous day’s highs and lows, filtered by trend direction based on market structure.
🔑 Key Improvements
1️⃣ Solved the repainting issue.
There are similar strategies in the community, but the historical results of those algorithms do not correspond to the results of real backtesting.
2️⃣ Added a trend filter.
In most cases, this makes it possible to achieve higher profitability. It works as follows:
The script determines market structure based on a defined number of previous candles.
If there are higher highs and higher lows, this is considered an uptrend structure.
If there are lower highs and lower lows, this is considered a downtrend structure.
The trend filter is adjusted using the Lookback Period setting.
3️⃣ Choice of entry principle.
Implemented the ability to choose whether trades are opened based on closing prices or by high/low breakout, which allows finding the optimal settings for a specific instrument.
4️⃣ Improved entry/exit logic.
When an opposite signal appears, before entering a trade, the script first closes the previous position.
✅ This makes the strategy fully ready for algorithmic trading via webhook on any exchange that supports this function.
5️⃣ Better visualization.
🟥 Red and 🟩 green backgrounds indicate the trend direction.
⚙️ How It Works
The principle of the strategy as follows:
Wait for the breakout of the previous day’s high or low.
Enter long on a breakout of the high, or short on a breakout of the low in the market structure trend direction.
Exit occurs on the breakout of the opposite extreme.
📈 This allows capturing long trends.
⚠️ But, like all similar strategies, in a sideways market it produces losing trades.
⚙️ Default Settings
Breakout Confirmation:
The breakout is determined by the candle close.
You can also choose high/low, but this often gives more false signals. However, on some assets, it may show higher profitability in backtesting.
Trend Structure Period:
The default value is 15.
This means the script analyzes the last 15 candles on the selected timeframe to determine market structure as described above.
Position Size:
Fixed at $1,000, which is 1% of the initial capital of $100,000 to keep risks under control.
Commission:
Set to 0.1%, which is sufficient for most cryptocurrency exchanges.
Slippage:
Configured at 1 tick.
Funding Note:
Keep in mind that funding is not included in this strategy.
It’s impossible to predict whether it will be positive or negative, and it can vary significantly across exchanges, so it is not part of the default settings.
🕒 Recommended Settings
Timeframe: 1H and higher
On lower timeframes → significant discrepancies may occur between historical and real backtesting data.
On higher timeframes → minor differences are possible, related to slippage, sharp moves, and other unpredictable situations.
⚠️ Important Notes
Always remember: Strategy results may not repeat in the future.
The market constantly changes, so:
✅ Monitor the situation
✅ Backtest regularly
✅ Adjust settings for each asset
Also remember about possible bugs in any algorithmic trading strategy.
Even if a script is well-tested, no one knows what unpredictable events the market may bring tomorrow.
⚠️ Risk Management:
Do not risk more than 1% of your deposit per trade, otherwise you may lose your account balance, since this strategy works without stop losses.
⚠️ Disclaimer
The author of the strategy does not encourage anyone to use this algorithm and bears no responsibility for any possible financial losses resulting from its application!
Any decision to use this strategy is made personally by the owners of TradingView accounts and cryptocurrency exchange accounts.
📝 Final Notes
This is not the final version. I already have ideas on how to improve it further, so follow me to not miss updates.
🐞 Bug Reports
If you notice any bugs or inconsistencies in my algorithm,
please let me know — I will try to fix them as quickly as possible.
💬 Feedback & Suggestions
If you have any ideas on how this or any of my other strategies can be improved, feel free to write to me. I will try to implement your suggestions in the script.
Wishing everyone good luck and stable profits! 🚀💰

Candle Power Pro – Engulfing + RSI Smart Strategy📌 Candle Power Pro – Engulfing + RSI Smart Strategy
Candle Power Pro is a high-performance trading strategy that combines the strength of engulfing candlestick patterns, RSI filters, and candle stability analysis to deliver accurate BUY & SELL signals.
🔥 Why traders love it:
✅ Detects bullish & bearish engulfing setups with RSI confirmation
✅ Built-in Stop Loss & Take Profit (customizable %)
✅ Prevents overtrading with anti-repeat signal filter
✅ Works on any market & timeframe (Forex, Crypto, Stocks, Indices)
✅ Backtest-ready with full PnL, Winrate, and Risk/Reward stats
🚦 How it works:
A BUY signal triggers when a bullish engulfing candle forms with RSI confirmation in a downtrend.
A SELL signal triggers when a bearish engulfing candle forms with RSI confirmation in an uptrend.
Labels show exact entry points on the chart for clarity.
⚡ Perfect for:
Swing traders, scalpers, and algorithmic enthusiasts
Traders who want rule-based entries & exits
Anyone looking to backtest and refine their trading strategy
👉 Just add it to your chart, adjust your Stop Loss & Take Profit, and start testing smarter trades!

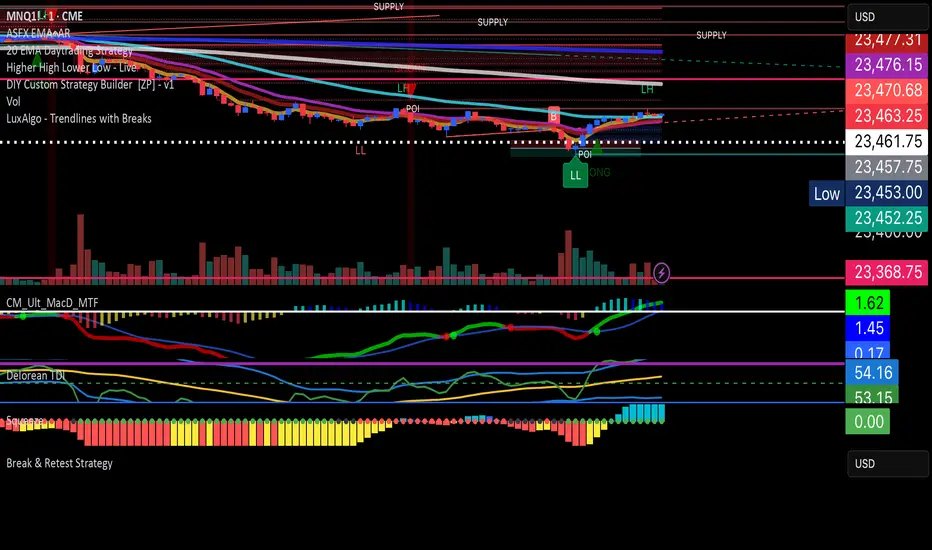
MuLegend's Break & Retest StrategyThis strategy was produced to help traders who trade NQ: win! try it out on a demo, see how you like and happy trading!! Works well if you are a break & retest trader!!!
MuMu
@atltime2shine on IG
VWAP Pullback StrategyWhat this does:
Only trades stocks up >10% on the day.
Buys on first cross back over VWAP.
Sets stop loss at –2% and take profit at +5%.

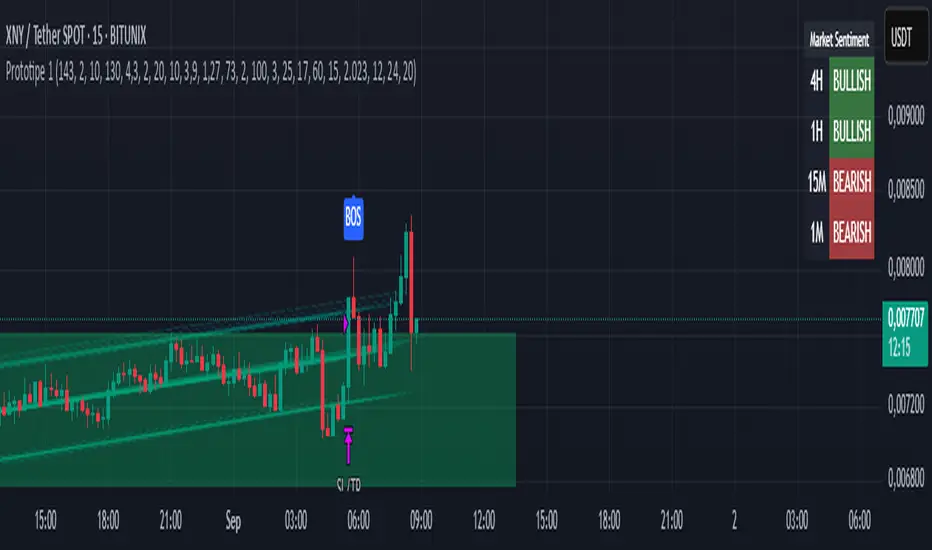
Prototipe Strategi (DCMS)Gunakan Indikar ini Secara Bebas.
Nanti akan di Buatkan Untuk Indikator yang lainnya
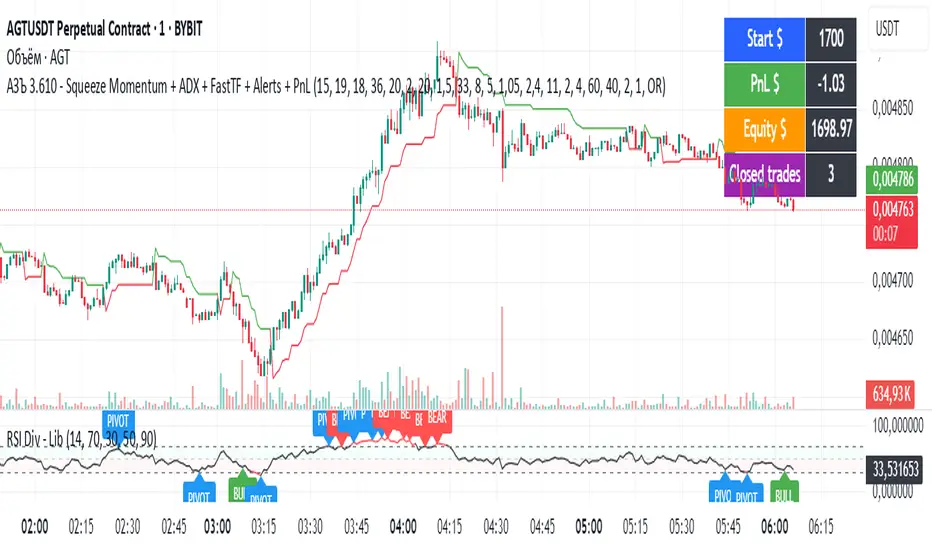
АЗЪ 3.610 - Squeeze Momentum + ADX + FastTF + Alerts + PnLStrata genius squeeze momentum + tester + adx +fast tf
EMA inFusion Pro - Multiple SourcesEMA Fusion Pro: Dynamic Trend & Momentum Strategy with Three Exit Modes
EMA Fusion Pro is a highly customizable, multi-exit trend-following strategy designed for traders who value both precision and flexibility. By leveraging exponential moving averages (EMA), average directional index (ADX), and volume analysis, this strategy aims to capture trending market moves while offering three distinct exit modes for optimal risk management across varying market conditions.
Strategy Overview
This strategy systematically identifies potential entry points using a moving average crossover with highly configurable data sources (including price, volume, rate of change, or their Heikin Ashi versions) and filters signal quality with ADX trend strength and volume spikes. Each trade is managed with one of three advanced exit methodologies—reverse signal, ATR-based stop/take profit, or fixed percentage—giving you the control to adapt your risk profile to different market regimes.
Key Features
Customizable EMA Source: Calculate the core trend-filtering EMA from price (default), volume, rate of change, or their Heikin Ashi counterparts for unique market perspectives.
Trend Filter with ADX: Confirm entries only when the trend is strong, as measured by the user-adjustable ADX threshold.
Volume Spike Confirmation: Optional filter to only take trades with above-average volume activity, reducing false signals.
Three Exit Modes:
Reverse Signal: Exit trades when a new, opposite entry signal occurs.
ATR-Based Stop/Take Profit: Dynamic risk management using multiples of the average true range (ATR) for both take profit and stop loss.
Percent-Based Stop/Take Profit: Fixed-percentage risk management with user-defined thresholds.
Visual Annotations: Signal markers, EMA line color-coded by source, trend background coloring, and optional ATR/percent-based TP/SL levels.
Info Panel: Real-time display of all core indicators, current trading mode, exit parameters, and position status for quick oversight.
How It Works
Entry Logic: A crossover signal (above/below the EMA) triggers a new entry, but only if both ADX trend strength and (optionally) volume spike conditions are met.
Exit Logic: Three selectable modes allow you to exit trades on reverse signals, at a dynamic ATR-based profit or loss, or at a fixed percentage gain/loss.
Flexible Data Analysis: The EMA source can be chosen from six options—standard price, volume, rate of change, or their Heikin Ashi variants—allowing experimentation with different market dimensions.
Risk Management: All exits are precisely controlled, either by the next opposing signal, by volatility-adjusted levels, or by fixed risk/reward ratios.
Backtest & Optimization: The strategy is fully backtestable within TradingView’s Strategy Tester, with adjustable parameters for optimization.
Customization & Usage
Indicator Source: Select your preferred data type for EMA calculation, opening the door to creative strategy variations (e.g., volume momentum, pure price trend, rate of change divergence).
Filter Toggles: Enable/disable ADX and volume filters as desired—useful for different market environments.
Exit Mode Selection: Switch between reverse, ATR, or percent-based exits with a single parameter—ideal for adapting to ranging vs. trending markets.
Visual Clarity: The EMA line color reflects its underlying source, and the info panel summarizes all critical values for easy monitoring.
Who Should Use This Strategy?
Trend Followers seeking to ride strong moves with multiple exit options.
Experienced Traders who want to experiment with different data types (volume, momentum, Heikin Ashi) for trend analysis.
Algorithmic Traders looking for a robust, flexible base to build upon with their own ideas.
Getting Started
Apply the script to your chart and review default settings.
Customize parameters—EMA length, ADX threshold, volume settings, exit type—as desired.
Backtest on multiple instruments and timeframes to evaluate performance.
Optimize filters, exit rules, and risk parameters for your preferred trading style.
Monitor with the real-time info panel and trade alerts.
Disclaimer
This script is for educational and entertainment purposes only. It is not financial advice. Past performance is not indicative of future results. Always conduct thorough testing and consider your risk tolerance before trading real capital.
— Happy Trading —
Feel free to adapt, share, and contribute to this open-source strategy!

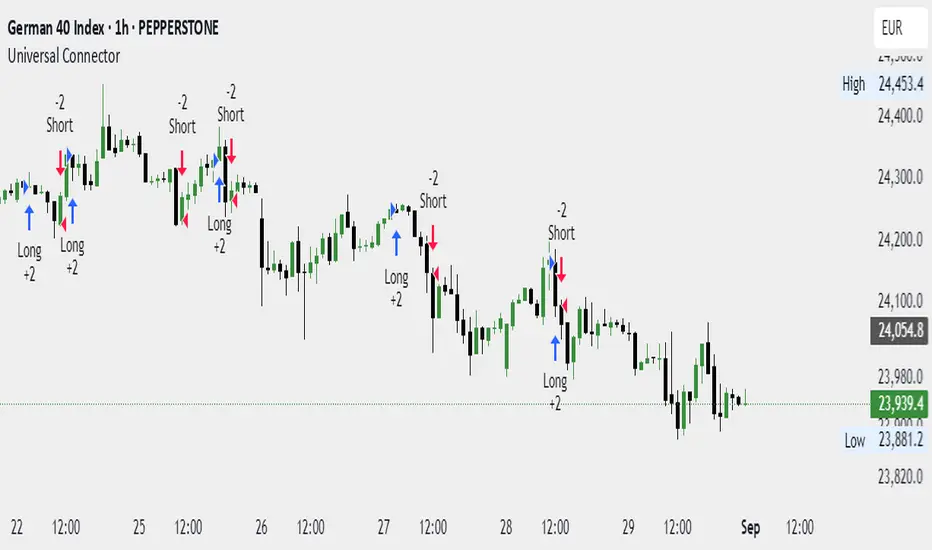
Universal Webhook Connector Demo.This strategy demonstrates how to generate JSON alerts from TradingView for multiple trading platforms.
Users can select platform_name (MT5, TradeLocker, DxTrade, cTrader, etc).
Alerts are constructed in JSON format for webhook execution.
J12Matic Builder by galgoomA flexible Renko/tick strategy that lets you choose between two entry engines (Multi-Source 3-way or QBand+Moneyball), with a unified trailing/TP exit engine, NY-time trading windows with auto-flatten, daily profit/loss and trade-count limits (HALT mode), and clean webhook routing using {{strategy.order.alert_message}}.
Highlights
Two entry engines
Multi-Source (3): up to three long/short sources with Single / Dual / Triple logic and optional lookback.
QBand + Moneyball: Gate → Trigger workflow with timing windows, OR/AND trigger modes, per-window caps, optional same-bar fire.
Unified exit engine: Trailing by Bricks or Ticks, plus optional static TP/SL.
Session control (NY time): Evening / Overnight / NY Session windows; auto-flatten at end of any enabled window.
Day controls: Profit/Loss (USD) and Trade-count limits. When hit, strategy HALTS new entries, shows an on-chart label/background.
Alert routing designed for webhooks: Every order sets alert_message= so you can run alerts with:
Condition: this strategy
Notify on: Order fills only
Message: {{strategy.order.alert_message}}
Default JSONs or Custom payloads: If a Custom field is blank, a sensible default JSON is sent. Fill a field to override.
How to set up alerts (the 15-second version)
Create a TradingView alert with this strategy as Condition.
Notify on: Order fills only.
Message: {{strategy.order.alert_message}} (exactly).
If you want your own payloads, paste them into Inputs → 08) Custom Alert Payloads.
Leave blank → the strategy sends a default JSON.
Fill in → your text is sent as-is.
Note: Anything you type into the alert dialog’s Message box is ignored except the {{strategy.order.alert_message}} token, which forwards the payload supplied by the strategy at order time.
Publishing notes / best practices
Renko users: Make sure “Renko Brick Size” in Inputs matches your chart’s brick size exactly.
Ticks vs Bricks: Exit distances switch instantly when you toggle Exit Units.
Same-bar flips: If enabled, a new opposite signal will first close the open trade (with its exit payload), then enter the new side.
HALT mode: When day profit/loss limit or trade-count limit triggers, new entries are blocked for the rest of the session day. You’ll see a label and a soft background tint.
Session end flatten: Auto-closes positions at window ends; these exits use the “End of Session Window Exit” payload.
Bar magnifier: Strategy is configured for on-close execution; you can enable Bar Magnifier in Properties if needed.
Default JSONs (used when a Custom field is empty)
Open: {"event":"open","side":"long|short","symbol":""}
Close: {"event":"close","side":"long|short|flat","reason":"tp|sl|flip|session|limit_profit|limit_loss","symbol":""}
You can paste any text/JSON into the Custom fields; it will be forwarded as-is when that event occurs.
Input sections — user guide
01) Entries & Signals
Entry Logic: Choose Multi-Source (3) or QBand + Moneyball (pick one).
Enable Long/Short Signals: Master on/off switches for entering long/short.
Flip on opposite signal: If enabled, a new opposite signal will close the current position first, then open the other side.
Signal Logic (Multi-Source):
Single: any 1 of the 3 sources > 0
Dual: Source1 AND Source2 > 0
Triple (default): 1 AND 2 AND 3 > 0
Long/Short Signal Sources 1–3: Provide up to three series (often indicators). A positive value (> 0) is treated as a “pulse”.
Use Lookback: Keeps a source “true” for N bars after it pulses (helps catch late triggers).
Long/Short Lookback (bars): How many bars to remember that pulse.
01b) QBands + Moneyball (Gate -> Trigger)
Allow same-bar Gate->Trigger: If ON, a trigger can fire on the same bar as the gate pulse.
Trigger must fire within N bars after Gate: Size of the gate window (in bars).
Max signals per window (0 = unlimited): Cap the number of entries allowed while a gate window is open.
Buy/Sell Source 1 – Gate: Gate pulse sources that open the buy/sell window (often a regime/zone, e.g., QBands bull/bear).
Trigger Pulse Mode (Buy/Sell): How to detect a trigger pulse from the trigger sources (Change / Appear / Rise>0 / Fall<0).
Trigger A/B sources + Extend Bars: Primary/secondary triggers plus optional extension to persist their pulse for N bars.
Trigger Mode: Pick S2 only, S3 only, S2 OR S3, or S2 AND S3. AND mode remembers both pulses inside the window before firing.
02) Exit Units (Trailing/TP)
Exit Units: Choose Bricks (Renko) or Ticks. All distances below switch accordingly.
03) Tick-based Trailing / Stops (active when Exit Units = Ticks)
Initial SL (ticks): Starting stop distance from entry.
Start Trailing After (ticks): Start trailing once price moves this far in your favor.
Trailing Distance (ticks): Offset of the trailing stop from peak/trough once trailing begins.
Take Profit (ticks): Optional static TP distance.
Stop Loss (ticks): Optional static SL distance (overrides trailing if enabled).
04) Brick-based Trailing / Stops (active when Exit Units = Bricks)
Renko Brick Size: Must match your chart’s brick size.
Initial SL / Start Trailing After / Trailing Distance (bricks): Same definitions as tick mode, measured in bricks.
Take Profit / Stop Loss (bricks): Optional static distances.
05) TP / SL Switch
Enable Static Take Profit: If ON, closes the trade at the fixed TP distance.
Enable Static Stop Loss (Overrides Trailing): If ON, trailing is disabled and a fixed SL is used.
06) Trading Windows (NY time)
Use Trading Windows: Master toggle for all windows.
Evening / Overnight / NY Session: Define each session in NY time.
Flatten at End of : Auto-close any open position when a window ends (sends the Session Exit payload).
07) Day Controls & Limits
Enable Profit Limits / Profit Limit (Dollars): When daily net PnL ≥ limit → auto-flatten and HALT.
Enable Loss Limits / Loss Limit (Dollars): When daily net PnL ≤ −limit → auto-flatten and HALT.
Enable Trade Count Limits / Number of Trades Allowed: After N entries, HALT new entries (does not auto-flatten).
On-chart HUD: A label and soft background tint appear when HALTED; a compact status table shows Day PnL, trade count, and mode.
08) Custom Alert Payloads (used as strategy.order.alert_message)
Long/Short Entry: Payload sent on entries (if blank, a default open JSON is sent).
Regular Long/Short Exit: Payload sent on closes from SL/TP/flip (if blank, a default close JSON is sent).
End of Session Window Exit: Payload sent when any enabled window ends and positions are flattened.
Profit/Loss/Trade Limit Close: Payload sent when daily profit/loss limit causes auto-flatten.
Tip: Any tokens you include here are forwarded “as is”. If your downstream expects variables, do the substitution on the receiver side.
Known limitations
No bracket orders from Pine: This strategy doesn’t create OCO/attached brackets on the broker; it simulates exits with strategy logic and forwards your payloads for external automation.
alert_message is per order only: Alerts fire on order events. General status pings aren’t sent unless you wire a separate indicator/alert.
Renko specifics: Backtests on synthetic Renko can differ from live execution. Always forward-test on your instrument and settings.
Quick checklist before you publish
✅ Brick size in Inputs matches your Renko chart
✅ Exit Units set to Bricks or Ticks as you intend
✅ Day limits/Windows toggled as you want
✅ Custom payloads filled (or leave blank to use defaults)
✅ Your alert uses Order fills only + {{strategy.order.alert_message}}

Auto Fibonacci Extension Pro Strategy – Smart Risk/Reward✨ Auto Fibonacci Extension Pro Strategy is a next-generation trading system that combines automatic Fibonacci extensions with professional risk management and backtesting features.
This strategy is designed for traders who want to trade with precision using Fibonacci levels without manually drawing them every time.
🔑 Key Features:
✅ Automatic Fibonacci Extension Mapping (0.618, 1.0, 1.272, 1.618, 2.618).
✅ Pro Entry & Exit Signals at golden zones.
✅ Dynamic Position Sizing based on risk percentage.
✅ Stop Loss & Take Profit levels with custom Risk/Reward ratio.
✅ Long & Short Trade Signals with chart markers.
✅ Backtesting Ready – optimize settings for any market (Forex, Crypto, Stocks, Indices).
✅ Clean Visuals with auto-plotted fib levels.
📊 How It Works:
Detects swing highs & lows automatically.
Draws Fibonacci extensions forward.
Generates buy/sell signals when price confirms at fib levels.
Places SL at last swing and TP at fib extension target.
Applies risk-based position sizing to protect your account.
⚡ Best Use Cases:
Works on all timeframes (scalping to swing trading).
Effective for Forex, Crypto, Stocks & Indices.
Use alongside trend filters (MA, RSI, Volume) for extra confirmation.
📢 Pro Tip: Backtest on multiple markets & timeframes, then fine-tune your Swing Length and Risk/Reward Ratio for maximum performance.
🔥 Shared Success, Trusted Growth – This strategy is built for traders who want to combine discipline, automation, and professional risk management into one powerful trading tool.

Gaussian Channel Strategy – GC + Kijun + VAPI Gate Gaussian Channel Strategy – Description
This strategy combines multiple technical tools into a rules-based trading system designed for crypto and other volatile markets. The main components are:
- **Gaussian Channel (GC):** Acts as the core trend filter. When price is above the Gaussian filter, conditions favor longs; when below, shorts are favored. The channel bands (high/low) also provide visual guidance of volatility and dynamic support/resistance.
- **Kijun-Sen (Ichimoku baseline, period 120):** Serves as a secondary trend filter. Long trades are only considered if price is above the Kijun-Sen, shorts only if price is below.
- **VAPI (Volume Accumulation Percentage Indicator):** Adds a volume confirmation layer. Long setups require positive accumulation, while short setups require negative accumulation. This helps to filter out low-volume and false signals.
- **Risk Management (ATR):** Stop-losses are set at 3× the ATR distance from entry, dynamically adjusting to volatility. Position sizing is calculated as a percentage of account equity at risk per trade.
- **Take Profit & Trailing Exit:** Positions are split into two legs. Leg A (30% of size) takes fixed profit at 0.75× the stop-loss distance (RR 0.75). Leg B (70% of size) uses a trailing stop that follows price with an ATR-based buffer, aiming to capture extended moves.
- **Trade Management:** Long and short entries are triggered only when all three conditions (GC, Kijun, VAPI) align. Exits are handled automatically through fixed TP, SL, and trailing stops.
Overall, the strategy seeks to balance safety and trend-following by combining a smooth Gaussian filter with trend/volume confirmation and adaptive risk management.

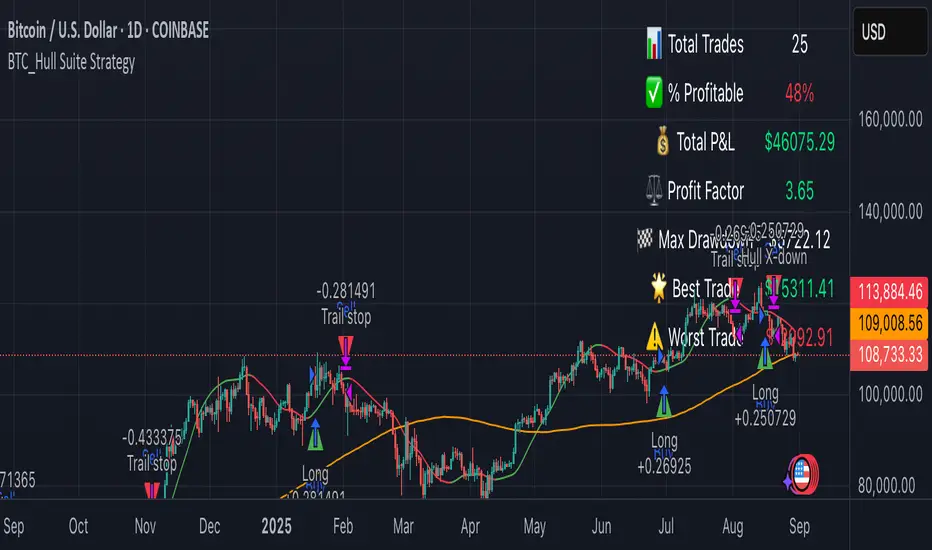
BTC_Hull Suite StrategyOverview
BTC_Hull Suite Strategy is a trend-following system designed to keep drawdowns modest while staying exposed during genuine uptrends. It uses the Hull Moving Average (HMA) for fast, low-lag trend turns, a long-term SMA filter to avoid chop, and a percentage trailing stop to protect gains.
🔧 What the strategy includes
- Hull Moving Average (HMA) with configurable length (default 55)
- SMA filter (default 130) to trade only with higher-timeframe bias
- Trailing stop in percent (default 5%) based on the running peak of close
- Execution model: signals are evaluated on the previous bar and entries are placed at the next bar’s open (TradingView default)
📈 How it works:
✅ Entry (Long):
Detects a bullish Hull turn by comparing the current HMA to its value 3 bars ago:
h > h3 and h <= h3 → HMA just turned up on the prior bar
The SMA filter must confirm: close > sma
If both are true (and within the date window), a long is opened next bar at the open
❌ Exit:
Hull turn down: h < h3 and h >= h3 , or
Trailing stop: price closes below peak * (1 – trailingPct)
Either condition closes the position at the current bar’s close
Notes:
pyramiding = 1 → allows one add-on (maximum two concurrent long positions)
Position sizing defaults to 20% of equity per entry (adjustable in Properties)
Who is this for?
This strategy is tailored for Bitcoin traders (spot or perpetuals) who want a rules-based, low-lag trend system with built-in drawdown protection.
It works best on Daily or 4H charts, but parameters can be adapted for other timeframes.
⚠️ Disclaimer
This strategy is provided for educational and research purposes only.
It is not financial advice. Markets are risky — always test on your own data, include realistic fees/slippage, and forward-test before using real capital.
OPTIMAL super trend tripple confirm for leverage. Ai implemented for higher r:r still a work in progresss
Maiko Range Scalper (Sideways BB + RSI) – v4 cleanPurpose
It’s a range scalping strategy for crypto. It tries to take small, repeatable trades inside a sideways market: buy near the bottom of the range, sell near the middle/top (and the reverse for shorts).
Core idea (two timeframes)
Define the trading range on a higher timeframe (HTF)
You choose the HTF (e.g., 15m or 1h).
The script finds the highest high and lowest low over a lookback window (e.g., last 96 HTF candles) → these become HTF Resistance and HTF Support.
It also calculates the midline (average of support/resistance).
Trade signals on your lower timeframe (LTF)
You run the strategy on a fast chart (e.g., 1m or 5m).
Entries are only allowed inside the HTF range.
Entry logic (mean reversion)
Indicators on the LTF:
Bollinger Bands (length & std dev configurable).
RSI (length & thresholds configurable).
Optional VWAP proximity filter (price must be within X% of VWAP).
Long setup:
Price touches/under-cuts the lower Bollinger band AND RSI ≤ threshold (default 30) AND price is inside the HTF range (and passes VWAP filter if enabled).
Short setup:
Price touches/exceeds the upper Bollinger band AND RSI ≥ threshold (default 70) AND price is inside the HTF range (and passes VWAP filter if enabled).
Exits and risk
Stop-loss: placed just outside the HTF range with a configurable buffer %:
Long SL = HTF Support × (1 − buffer).
Short SL = HTF Resistance × (1 + buffer).
Take-profit (selectable):
Mid band (the Bollinger basis) → conservative, faster exits.
Opposite band / HTF boundary → more aggressive, higher RR but more give-backs.
Position sizing
A simple cap: maximum position size = percent of account equity (e.g., 20%).
The script calculates quantity from that cap and current price.
Plots you’ll see on the chart
HTF Resistance (red) and HTF Support (green) via plot().
HTF Midline (gray dashed) drawn with a line.new() object (because plot() cannot do dashed).
Bollinger basis/upper/lower on the LTF.
Optional VWAP line (only shown if you enable the filter).
Signal markers (green triangle up for Long setups, red triangle down for Short setups).
Alerts
Two alertconditions:
“Long Setup” – when a long entry condition appears.
“Short Setup” – when a short entry condition appears.
Create alerts from these to get notified in real time.
How to use it (quick start)
Add to a 1m or 5m chart of a liquid coin (BTC, ETH, SOL).
Set HTF timeframe (start with 1h) and lookback (e.g., 96 = ~4 days on 1h).
Keep default Bollinger/RSI first; tune later.
Choose TP mode:
“Mid band” for quick scalps.
“Opposite band/Range” if the range is very clean and you want bigger targets.
Set SL buffer (0.15–0.30% is common; adjust for volatility).
Set Max position % to control size (e.g., 20%).
(Optional) Enable VWAP filter to skip stretched moves.
When it works best
Clearly sideways markets with visible support/resistance on the HTF.
High-liquidity pairs where spreads/fees are small relative to your scalp target.
Limitations & safety notes
True breakouts will invalidate mean-reversion logic—your SL outside the range is there to cut losses fast.
Fees can eat into small scalps—prefer limit orders, rebates, and liquid pairs.
Backtest results vary by exchange data; always forward-test on small size.
If you want, I can:
Add an ATR-based stop/target option.
Provide a study-only version (signals/alerts, no trading engine).
Pre-set risk to your €5,000 plan (e.g., ~0.5% max loss/trade) with calculated qty.

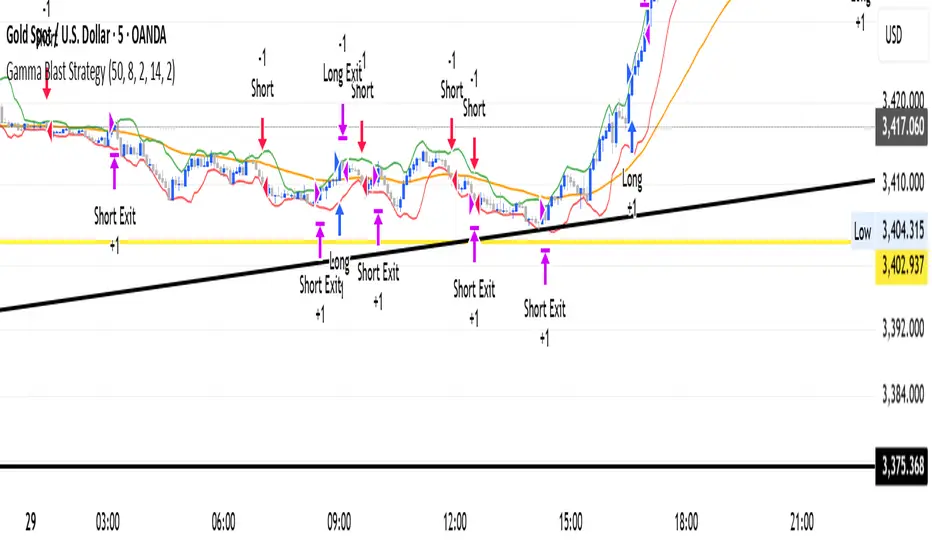
Gamma Blast StrategyGamma Blast Strategy used for quick 2-5 ticks on Buys, but on a sideways market can get up to 15-20 ticks.
MA Cross with TP/SL by GMETrade on cross when trading in same direction. use daily on session open for best sucess. use volume, macd for accurate entries along side this stratergy. mark highs and lows of previous sessions. if signals are close to support or resistance lines they are viewed as more valid

Amazin Strat [Crak + Crossback Entry/Exit]Concept based off my favorite exit models, while using 50vma and 200sma as entries
Past day high and past day low

VWMA-KNN Supertrend Nifty 50VWMA-KNN Supertrend
The strategy essentially bridges traditional technical analysis with modern data science techniques, making it a hybrid quantitative approach to market timing and trend identification. combining traditional technical indicators with predictive algorithms.
Why This Specific Combination?
Complementary Strengths:
1. VWMA → Filters noise, focuses on significant moves
2. Supertrend → Provides clear trend framework and stop-loss levels
3. KNN → Adds predictive intelligence and pattern recognition
4. Volume → Ensures all signals are backed by real market participation
Problem-Solution Mapping:
• Problem: Traditional Supertrend has lag and false signals
• Solution: VWMA reduces noise, KNN anticipates changes
• Problem: Pure ML can be unstable and overfitted
• Solution: Supertrend provides robust trend framework
• Problem: Many indicators ignore volume
• Solution: VWMA integration throughout
Synergistic Effects:
• Volume validation + Trend following + Pattern recognition = More reliable signals
• Each component covers weaknesses of the others
• Creates a multi-dimensional view: price, volume, volatility, and historical patterns
This combination attempts to create a "smart trend follower" that learns from history while staying grounded in proven technical analysis principles.
Trading Logic Flow
1. Enter initial positions based on signals
2. Monitor trend - force exit opposing positions if trend changes
3. If position moves against you by 120 points AND trend is still favorable, double down
4. Exit when profit targets are hit (targets decrease with position size)
5. Reset all tracking variables on exit
This strategy attempts to profit from mean reversion while respecting the overall trend direction, using martingale sizing to potentially recover from initial losses.

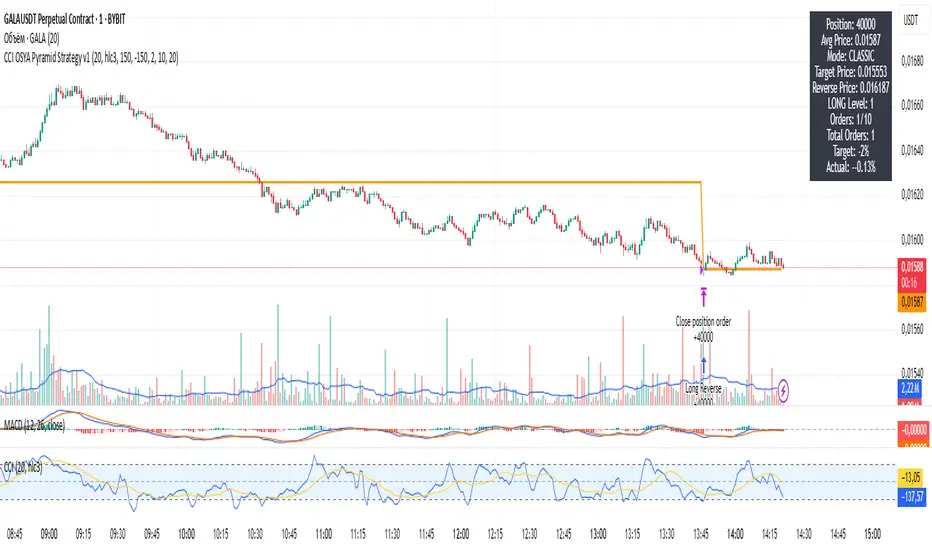
CCI OSYA Pyramid Strategy v1CCI OSYA Pyramid Strategy v1
📈 Strategy Description
**CCI OSYA Pyramid Strategy v1** is an advanced trading strategy that uses the CCI (Commodity Channel Index) indicator combined with an innovative pyramiding system. The strategy is designed for trending markets and maximizes profit by gradually increasing position size as the market moves in the trader's favor.
🎯 Key Features
- CCI-based signals: Uses overbought/oversold levels for entry
- Pyramiding system: Gradual position adding at target prices
- Reverse mechanics: Ability to flip positions when trend changes
- Flexible settings: Fully customizable for different trading styles
- Risk management: Controls position size and adding levels
⚙️ Recommended Settings
CCI Indicator
-CCI Length: 20
- Source: HLC3 (average of High, Low, Close)
- Upper Zone: 150
- Lower Zone: -150
Pyramiding Parameters
- Pyramiding Step: 2.0%
- Orders per Level: 10
- Max Levels: 20
- Position Size: 10% of capital in contracts
Signals
- Default Mode: Classic
- Commission: 0.1%
💡 Strategy Advantages
- Risk management: Gradual position building reduces risk
- Trend efficiency: Excellent in strong trends
- Flexibility: Adaptable to various instruments and timeframes
- Transparency: Clear entry and exit rules
- Automation: Fully automated trading process
📋 Suitable Instruments
- Forex pairs (EUR/USD, GBP/USD, USD/JPY)
- Cryptocurrencies (BTC/USD, ETH/USD)
- Indices (S&P 500, NASDAQ)
- Commodities (Gold, Oil)
⏰ Recommended Timeframes
- 1m (1 minute) - optimal balance
⚠️ Risks and Limitations
- Effective in trending conditions
- May draw down in sideways movements
- Requires sufficient deposit for pyramiding
- Historical data testing recommended
🚀 Getting Started
1. Add strategy to chart
2. Set recommended settings
3. Test on historical data
4. Start with demo account
5. Gradually move to real account
Author: OSYA
Version: 1.0
Updated: 2025
*Always test the strategy before using real funds. Trading financial markets involves the risk of capital loss.*
趋势Scalping(多时间框架动能策略)策略概述
本策略是一个基于多时间框架动能的短线交易策略,通过结合短期与长期趋势指标、RSI超买超卖判断以及时间过滤机制,在趋势明确时入场,并在特定条件或时间点退出交易。策略适用于股票、期货、加密货币等高频波动的市场。
输入参数说明
数据源(Source)
默认使用 hl2(最高最低价的平均值),也可选择其他价格数据。
短期趋势周期(Short Term Trend)
默认值为5,用于计算短期RSI,捕捉近期价格动量的变化。
长期趋势周期(Long Term Trend)
默认值为60,用于计算随机指标(Stochastic)的周期,判断中长期趋势方向。
长期趋势平滑周期(Smooth Long Term Trend)
默认值为13,对长期随机指标进行平滑处理,减少噪音。
近期回调检测周期(Clear Short Term Pullback Appears Recently)
默认值为15,用于检测短期是否出现明显回调。
RSI超卖阈值(Threshold of Short Term Pullback Clear)
默认值为35.0,RSI低于该值视为短期超卖,可能出现反弹。
RSI回调结束阈值(Threshold of Short Term Pullback End)
默认值为50.0,RSI回升至此表示短期回调结束。
条件失效时退出(Exit if Reason Over)
若启用,当入场条件不再成立时自动平仓。
交易时间范围
可设置策略运行的开始与结束时间(以小时和分钟为单位),仅在指定时间段内交易。
策略逻辑
指标计算:
随机指标(Stochastic):基于长期周期计算,反映价格在近期区间内的位置。
平滑随机值(y_k):对随机指标进行移动平均平滑处理。
RSI指标:基于短期周期计算,反映近期价格动量的强弱。
多空判断:
多头信号(y_upper):
当平滑随机值高于50、RSI高于结束阈值,且近期出现明显超卖回调时,触发做多信号。
空头信号(y_lower):
当平滑随机值低于50、RSI低于结束阈值,且近期出现明显超买回调时,触发做空信号。
时间过滤:
策略仅在用户设定的时间范围内(例如7:00至15:10)运行,避免在波动性较低或非主力交易时段操作。
强制平仓机制:
每天下午16:10(或指定时间区间)强制平仓所有头寸,避免隔夜风险或尾盘波动。
图表显示
策略在副图中绘制以下三条线:
随机指标(红色)
平滑随机值(蓝色)
RSI指标(黄色)
水平线50:作为多空分界线参考。
使用建议
本策略适合在流动性高、波动性强的市场中运行。
建议配合止损机制使用,以控制单笔交易风险。
用户可根据不同品种调整参数周期和阈值,优化入场时机。
Strategy Overview
This is a short-term trading strategy designed to capitalize on momentum shifts within a broader trend. It combines multiple technical indicators across different timeframes—including Stochastic, RSI, and custom trend logic—to generate entry and exit signals. The strategy incorporates a time filter to operate only during specified high-liquidity hours and includes a mandatory end-of-session close-out to avoid overnight risk. It is suitable for volatile markets like equities, futures, and cryptocurrencies.
Input Parameters
Source
The price data used for calculations. Default is hl2 (the average of high and low prices).
Short Term Trend (x_len_a)
The period for the short-term RSI calculation. Default is 5. Used to capture recent price momentum.
Long Term Trend (x_len_b)
The period for the Stochastic Oscillator calculation. Default is 60. Defines the medium-to-long-term trend context.
Smooth Long Term Trend (x_k_b)
The smoothing period applied to the Stochastic value (K). Default is 13. Reduces noise for a clearer trend signal.
Clear Short Term Pullback Appears Recently (x_changk)
The lookback period to identify a recent significant pullback. Default is 15.
Threshold of Short Term Pullback Clear (x_rsi_ct)
The RSI level indicating an oversold (for longs) or overbought (for shorts) condition. Default is 35.0.
Threshold of Short Term Pullback End (x_rsi_ft)
The RSI level signaling that the short-term pullback has concluded and momentum is reversing. Default is 50.0.
Exit if Reason Over (x_exit_if_reason_over)
A boolean switch. If enabled, the strategy will automatically close a position if the original entry condition is no longer valid.
Time Filter (Start/End Hour & Minute)
Defines the specific intraday window during which the strategy is active (e.g., 7:00 to 15:10). All trades are initiated and managed only within this window.
Strategy Logic
Indicator Calculation:
y_stoch: The raw Stochastic Oscillator value calculated over the x_len_b period.
y_k: A smoothed version of the Stochastic (y_stoch) using a Simple Moving Average with period x_k_b.
y_rsi: The Relative Strength Index calculated on the Source price over the short-term period x_len_a.
Entry & Exit Conditions:
The core logic generates a composite signal (y_upper for long, y_lower for short) based on three components:
The deviation of the smoothed Stochastic (y_k) from its midpoint (50).
The deviation of the RSI (y_rsi) from its pullback-end threshold (x_rsi_ft).
The extremity of the recent RSI move compared to the pullback-clear threshold (x_rsi_ct) over the x_changk period.
Long Entry (LE): Triggered when the composite signal y_upper is greater than 0 AND the current time is within the allowed trading window.
Short Entry (SE): Triggered when the composite signal y_lower is less than 0 AND the current time is within the allowed trading window.
Conditional Exit: If x_exit_if_reason_over is true, long positions are closed if y_upper <= 0, and short positions are closed if y_lower >= 0.
Time-Based Filter:
The strategy only evaluates entries and exits if the current bar's time falls within the user-defined start_time and end_time range.
Mandatory Close-Out:
A critical risk management feature: All open positions are automatically closed at 16:10 (4:10 PM) based on the chart's timezone, ensuring no positions are held overnight or into the late session.
Plotting
The strategy plots three key series in the indicator pane:
Stochastic (y_stoch): Red line.
Smoothed Stochastic (y_k): Blue line.
RSI (y_rsi): Yellow line.
A hline at 50 serves as a visual midpoint reference for both Stochastic and RSI.
Usage Recommendations
This strategy performs best in markets with high volatility and strong trending characteristics.
It is highly recommended to use this script with a brokerage account that supports and enforces stop-loss orders on the strategy's behalf, as the script itself does not calculate stop-loss levels.
Parameters, especially periods and thresholds, should be optimized for the specific asset and timeframe being traded.
Always conduct rigorous backtesting and forward testing before deploying capital.
