指標和策略

Tamil | Trend Signal Dashboard for trading“Tamil | Trend Signal in Dashboard” is a multi-confirmation trend and signal tool that combines Supertrend, RSI/ADX trend strength, and dual QQE into one clean dashboard on the chart. It only prints STRONG BUY / STRONG SELL when all components align, and it also gives clear, rule-based exit signals.
⸻
What it uses
• RSI + ADX + ATR trend block
• ADX (with custom length & threshold) to measure trend strength
• +DI / –DI to define bullish or bearish direction
• Optional session filter so signals only appear in your trading window
• Custom Supertrend
• ATR-based bands with adjustable period & multiplier
• Plots trend line on chart and shows Buy/Sell flip labels when Supertrend reverses
• Dual QQE MOD engine
• Two QQE/RSI streams (primary & secondary)
• Bollinger bands around QQE line to confirm true momentum breakouts
• Defines QQE Bullish / Bearish states
• Secondary RSI Histogram logic
• Tracks RSI distance from the 50 line
• Detects “peak & decline” on the histogram for momentum-based exits
⸻
Signals & Exits
• Entry
• Strong Buy: Supertrend bullish + strong ADX + DI bullish + QQE bullish
• Strong Sell: Supertrend bearish + strong ADX + DI bearish + QQE bearish
• Background is softly colored green/red while alignment is active
• Exit (configurable)
• Alignment lost (trend components no longer agree), and/or
• First peak-and-decline in the secondary RSI histogram
• Shows Exit Buy / Exit Sell markers and fires dedicated alerts
⸻
Dashboard & Alerts
A compact table in the top-right shows live status of:
• Supertrend
• ADX value & strength check
• Direction from DI
• QQE state
• Secondary RSI histogram slope
• Overall Alignment and current Signal (Hold / Strong Buy / Strong Sell / Exit)

FlowTrinity — Crypto Dominance Rotation IndexFlowTrinity — Crypto Dominance Rotation Index
(Tracks BTC / Stablecoin / Altcoin dominance flows with standardized oscillators)
⚪ Overview
FlowTrinity decomposes total crypto market structure into three capital-flow regimes — BTC dominance, Stablecoin dominance, and Altcoin dominance — each normalized into oscillator form. Additionally, a fourth histogram tracks Total Market Cap expansion/contraction relative to BTC+Stable capital, revealing underlying rotation pressure not visible in raw dominance charts.
Each component is standardized through SMA/STD normalization, producing smoothed 0–100 style oscillations that highlight overbought/oversold rotation extremes, risk-on/risk-off transitions, and capital cycle inflection zones.
⚪ Flow Components
Stablecoin Dominance Oscillator —White line
Measures the combined USDT + USDC share of market dominance.
High values indicate increased hedging behavior or sidelined capital.
Low values coincide with renewed risk appetite and capital deployment into crypto assets.
Altcoin Dominance Oscillator — Orange Line
Tracks the share of liquidity rotating into altcoins (Total – BTC – Stable).
Rising values indicate broad market expansion and speculative activity.
Falling values reflect flight-to-safety or concentration back into majors.
BTC Dominance Oscillator — Purple line(off by default
Normalized BTC dominance revealing transitions between Bitcoin-led markets and altcoin-led cycles. Useful for identifying BTC absorption phases vs. altcoins dispersion regimes.
Total–BTC–Stable MarketCap Difference Histogram — histogram
A normalized histogram of total market cap change minus BTC+Stable market cap change.
• Positive → altcoin segment expanding
• Negative → capital retreating into BTC or stables
Acts as a structural layer confirming or contradicting dominance-based signals.
Normalization Logic
All flows use SMA + standard deviation scaling (lookback 7 / smoothing 7), enabling consistent comparison across unrelated dominance and market-cap metrics.
⚪ Use Cases
• Identify shifts between BTC-led and alt-led markets
• Detect early signs of liquidity rotation
• If Stablecoin OSC is oversold, liquidity may soon rotate to BTC or Altcoins, signaling potential price moves.
• If Stablecoin OSC is overbought and Altcoin OSC is oversold, it can indicate an early buying opportunity in Altcoins.
• Watching these oscillator positions helps spot early market rotations and plan entries or exits.
snapshot
Disclaimer
This indicator is for educational and informational purposes only and does not constitute financial advice or investment guidance. Cryptocurrency trading involves significant risk; you are solely responsible for your trading decisions, based on your financial objectives and risk tolerance. The author assumes no liability for any losses arising from the use of this tool.

ATR ZigZag BreakoutATR ZigZag Breakout
This strategy uses my ATR ZigZag indicator (powered by the ZigZagCore library) to scalp breakouts at volatility-filtered highs and lows.
Everyone knows stops cluster around clear swing highs and lows. Breakout traders often pile in there, too. These levels are predictable areas where aggressive orders hit the tape. The idea here is simple:
→ Let ATR ZigZag define clean, volatility-filtered pivots
→ Arm a stop market order at those pivots
→ Join the breakout when the crowd hits the level
The key to greater success in this simple strategy lies in the ZigZag. Because the pivots are filtered by ATR instead of fixed bar counts or fractals, the levels tend to be more meaningful and less noisy.
This approach is especially suited for intraday trading on volatile instruments (e.g., NQ, GC, liquid crypto pairs).
How It Works
1. Pivot detection
The ATR ZigZag uses an ATR-based threshold to confirm swing highs and lows. Only when price has moved far enough in the opposite direction does a pivot become “official.”
2. Candidate breakout level
When a new swing direction is detected and the most recent high/low has not yet been broken in the current leg, the strategy arms a stop market order at that pivot.
• Long candidate → most recent swing high
• Short candidate → most recent swing low
These “candidate trades” are shown as dotted lines.
3. Entry, SL, and TP
If price breaks through the level, the stop order is filled and a bracket is placed:
• Stop loss = ATR × SL multiplier
• Take profit = SL distance × RR multiplier
Once a level has traded, it is not reused in the same swing leg.
4. Cancel & rotate
If the market reverses and forms a new swing in the opposite direction before the level is hit, the pending order is cancelled and a new candidate is considered in the new direction.
Additional Features
• Optional session filter for backtesting specific trading hours

RSI AND CHARTSTORYRsi value on chart with 4 levels 20,40,60,80 and also rsi value and price with current candle. All are plot on chart so one can find easy divergence on chart.

ICT Order Block Identifier [Eˣ]📦 Order Block Identifier
Overview
The Order Block Identifier automatically detects and displays institutional order blocks on your charts - zones where banks, hedge funds, and market makers place their orders. This indicator helps identify where institutions are likely to defend their positions and where price often finds support or resistance, based on ICT (Inner Circle Trader) concepts.
━━━━━━━━━━━━━━━━━━━━━━━━━━━━
🎯 What This Indicator Does
Detects Order Blocks:
• 🟢 Bullish Order Blocks (OB+) - Last bearish candle before strong bullish move
• 🔴 Bearish Order Blocks (OB-) - Last bullish candle before strong bearish move
• Automatically identifies institutional buying/selling zones
• Tracks up to 30 order blocks simultaneously
• Works on all timeframes and instruments
Smart Features:
• Auto-Timeframe Adjustment - Optimizes detection for 1min to Weekly charts
• Active Block Highlighting - Shows which OB price is approaching
• Touch Tracking - Knows when blocks are tested
• ATR-Based Detection - Adapts to each instrument's volatility
• Strength Filtering - Choose Low/Medium/High to control sensitivity
━━━━━━━━━━━━━━━━━━━━━━━━━━━━
📚 Understanding Order Blocks
What Are Order Blocks?
Order blocks are the "footprints" left behind by institutional traders (banks, hedge funds, market makers) when they enter large positions. Because institutions can't fill massive orders at once without moving the market, they:
1. Place orders gradually over time
2. Leave zones where their buy/sell orders are concentrated
3. Defend these zones when price returns
4. Create reliable support and resistance levels
The ICT Concept:
Developed by Michael Huddleston (Inner Circle Trader), order block theory states that:
• The last opposite-colored candle before a strong move contains institutional orders
• Price often returns to test these zones before continuing
• These zones act as strong support (bullish OB) or resistance (bearish OB)
• Smart money defends their positions at these levels
Why Order Blocks Work:
• Unfilled Orders: Institutions may still have pending orders in the block
• Position Defense: They protect their entries by adding to positions
• Stop Placement: Retail stops cluster near these zones (liquidity for institutions)
• Market Structure: Price respects these levels due to order flow dynamics
━━━━━━━━━━━━━━━━━━━━━━━━━━━━
🟢 Bullish Order Blocks Explained
How They Form:
1. Price is consolidating or declining
2. Institutions begin accumulating (buying)
3. A strong bullish move erupts
4. The last bearish candle before this move = Bullish Order Block
5. This candle represents where institutions were buying aggressively
Why The Last Bearish Candle?
• Institutions absorbed all selling pressure at this level
• Their buy orders filled as price was declining
• When price returns, they defend this zone with more buying
• It becomes a demand zone / support level
Trading Bullish Order Blocks:
Setup:
• Wait for price to retrace back to bullish OB (green box)
• Look for rejection/reversal pattern (pin bar, engulfing, etc.)
• Enter long when price bounces from the OB zone
• Stop loss: Below the order block
• Target: Recent high or opposite order block
Best Scenarios:
• OB aligns with other support (trendline, fibonacci, round number)
• First touch of OB (unmitigated) has highest probability
• Occurs during high-volume sessions (London/NY)
• Trend is bullish on higher timeframe
Example Trade:
• Bullish OB forms at $50,000 (last red candle before rally)
• Price rallies to $52,000 then retraces
• Price drops back to $50,100 (touching OB)
• Bullish pin bar forms on the OB
• Enter long at $50,200, stop at $49,800
• Target: $52,000+ (previous high)
━━━━━━━━━━━━━━━━━━━━━━━━━━━━
🔴 Bearish Order Blocks Explained
How They Form:
1. Price is consolidating or rising
2. Institutions begin distributing (selling)
3. A strong bearish move erupts
4. The last bullish candle before this move = Bearish Order Block
5. This candle represents where institutions were selling aggressively
Why The Last Bullish Candle?
• Institutions absorbed all buying pressure at this level
• Their sell orders filled as price was rising
• When price returns, they defend this zone with more selling
• It becomes a supply zone / resistance level
Trading Bearish Order Blocks:
Setup:
• Wait for price to retrace back to bearish OB (red box)
• Look for rejection/reversal pattern (shooting star, bearish engulfing)
• Enter short when price rejects from the OB zone
• Stop loss: Above the order block
• Target: Recent low or opposite order block
Best Scenarios:
• OB aligns with other resistance (trendline, fibonacci, round number)
• First touch of OB (unmitigated) has highest probability
• Occurs during high-volume sessions (London/NY)
• Trend is bearish on higher timeframe
Example Trade:
• Bearish OB forms at $48,000 (last green candle before drop)
• Price drops to $46,000 then retraces
• Price rallies back to $47,900 (touching OB)
• Bearish engulfing forms at the OB
• Enter short at $47,800, stop at $48,200
• Target: $46,000- (previous low)
━━━━━━━━━━━━━━━━━━━━━━━━━━━━
📊 How To Use This Indicator
Strategy 1: Order Block Retest (Classic)
Best For: Swing trading, capturing reversals
Timeframes: 15min, 1H, 4H, Daily
Win Rate: 60-70% (first touch)
Entry Rules:
1. Identify unmitigated order block (bright color, not gray)
2. Wait for price to return to the OB zone
3. Look for price action confirmation:
• Bullish OB: Pin bar, bullish engulfing, hammer
• Bearish OB: Shooting star, bearish engulfing, doji
4. Enter in the direction of the OB
5. Stop loss: Beyond the opposite side of OB (20-30 pips)
6. Target: 2-3R or opposite OB
Example:
• Bullish OB at $100-$102
• Price drops to $101.50 (enters OB)
• Bullish pin bar forms with low at $100.80
• Enter long at $102 (OB high), stop at $99.50
• Risk: $2.50, Target: $107.50 (3R)
Strategy 2: Break & Retest
Best For: Trend trading, breakout confirmation
Timeframes: 5min, 15min, 1H
Win Rate: 65-75%
Entry Rules:
1. Price breaks through an order block
2. Wait for pullback to the broken OB
3. The OB now acts as support (if broken up) or resistance (if broken down)
4. Enter when price respects the flipped OB
5. Stop: Inside the OB zone
6. Target: Next OB or structure level
Why It Works: Broken OBs flip polarity - support becomes resistance and vice versa
Strategy 3: Multi-Timeframe Confirmation
Best For: High-probability setups
Timeframes: Combine 1H + 4H or 15min + 1H
Win Rate: 70-80%
Entry Rules:
1. Identify order block on higher timeframe (4H or Daily)
2. Switch to lower timeframe (1H or 15min)
3. Wait for lower TF order block to form within higher TF OB
4. Trade the lower TF OB in direction of higher TF OB
5. Stop: Below lower TF OB
6. Target: Edge of higher TF OB or beyond
Why It Works: Alignment across timeframes = institutional consensus
Strategy 4: Order Block to Order Block
Best For: Range trading, swing entries
Timeframes: 1H, 4H
Win Rate: 55-65%
Entry Rules:
1. Identify both bullish OB below and bearish OB above
2. Price is ranging between these OBs
3. Enter long at bullish OB, target bearish OB
4. Enter short at bearish OB, target bullish OB
5. Stop: Beyond the trading OB
6. Exit at opposite OB
Why It Works: Price moves from one institutional zone to another
Strategy 5: Mitigation Fade
Best For: Aggressive scalping
Timeframes: 5min, 15min
Win Rate: 50-60% (higher risk)
Entry Rules:
1. Price approaches an order block
2. Instead of bouncing, price breaks through (mitigates it)
3. Enter immediately in direction of breakout
4. Stop: Back inside the mitigated OB
5. Quick target: 1-1.5R
Why It Works: When OB fails, it often leads to strong continuation
━━━━━━━━━━━━━━━━━━━━━━━━━━━━
⚙️ Settings Explained
Core Settings
Auto-Adjust for Timeframe (Default: ON)
• Automatically optimizes detection for current chart timeframe
• 1min: 3 bars lookback
• 5min: 4 bars lookback
• 15min: 5 bars lookback
• 1H: 6 bars lookback
• 4H: 8 bars lookback
• Daily+: 10-12 bars lookback
• Recommended: Keep ON for best results
Manual Detection Length (Default: 5)
• Only used when Auto-Adjust is OFF
• Number of bars to look back for the "last opposite candle"
• Lower (2-4): More sensitive, more blocks, more noise
• Higher (6-10): Less sensitive, fewer blocks, higher quality
• Recommended: Use Auto-Adjust instead
Display Settings
Show Bullish/Bearish Order Blocks
• Toggle each type on/off independently
• Customize colors for each OB type
• Tip: Match colors to your chart theme
Max Order Blocks to Display (Default: 10)
• Limits how many OBs are shown at once
• Lower (5-8): Cleaner chart, only recent blocks
• Higher (15-30): More historical context
• Recommended: 8-12 for most trading
Show Order Block Labels (Default: ON)
• Displays "OB+" and "OB-" text on blocks
• Shows 🎯 on active (nearest) block
• Turn OFF for minimal chart appearance
• Recommended: Keep ON for clarity
Extend Blocks (bars) (Default: 50)
• How far to extend OB boxes to the right
• Lower (20-30): Shorter boxes, less clutter
• Higher (100+): Longer boxes, easier to see
• Blocks auto-extend until mitigated or limit reached
• Recommended: 40-60 bars
Filters
Block Strength Filter (Default: Medium)
• Controls how strong a move must be to create an OB
• Low: 0.5x ATR move required - Many blocks, more noise
• Medium: 1x ATR move required - Balanced quality/quantity
• High: 1.5x ATR move required - Only strongest institutional moves
• Recommended for beginners: High
• Recommended for experienced: Medium
• Recommended for scalpers: Low
Min Block Size % (Default: 0.1)
• Minimum size of OB as percentage of price
• Filters out tiny, insignificant blocks
• Crypto: 0.1-0.3%
• Forex: 0.05-0.15%
• Stocks: 0.1-0.5%
• Adjust based on instrument volatility
Advanced Settings
Show Mitigated Blocks (Default: OFF)
• When ON: Shows gray boxes for "used" order blocks
• When OFF: Blocks disappear after mitigation
• Use ON: For learning and analysis
• Use OFF: For clean, active trading
Highlight Active Block (Default: ON)
• Highlights the nearest order block to current price
• Active block shown with 🎯 emoji and brighter color
• Helps focus on most relevant trading opportunity
• Recommended: Keep ON
━━━━━━━━━━━━━━━━━━━━━━━━━━━━
📱 Info Panel Guide
Bullish OB Count
• Number of active (unmitigated) bullish order blocks
• Higher number = More support zones below price
• Multiple bullish OBs = Strong demand structure
Bearish OB Count
• Number of active (unmitigated) bearish order blocks
• Higher number = More resistance zones above price
• Multiple bearish OBs = Strong supply structure
Bias Indicator
• ⬆ Bullish: More bullish OBs than bearish (demand > supply)
• ⬇ Bearish: More bearish OBs than bullish (supply > demand)
• ↔ Neutral: Equal OBs on both sides
• Trade in direction of bias for higher probability
Near Indicator
• Shows which OB price is closest to
• Displays distance as percentage
• Example: "Bull OB 0.85%" = Bullish OB is 0.85% below current price
• Watch for "Near" alerts to time entries
━━━━━━━━━━━━━━━━━━━━━━━━━━━━
📱 Alert Setup
This indicator includes 4 alert types:
1. Price Entering Bullish OB
• Fires when price touches a bullish order block
• Action: Watch for bounce/reversal pattern
• High-probability long setup developing
2. Price Entering Bearish OB
• Fires when price touches a bearish order block
• Action: Watch for rejection/reversal pattern
• High-probability short setup developing
3. New Bullish OB Detected
• Fires when a new bullish order block forms
• Action: Mark the zone for future retest
• New demand zone identified
4. New Bearish OB Detected
• Fires when a new bearish order block forms
• Action: Mark the zone for future retest
• New supply zone identified
To Set Up Alerts:
1. Click "Alert" button (clock icon)
2. Select "Order Block Identifier"
3. Choose your alert condition
4. Configure notification method
5. Click "Create"
Pro Tip: Set "Price Entering" alerts to catch trading opportunities in real-time
━━━━━━━━━━━━━━━━━━━━━━━━━━━━
💎 Pro Tips & Best Practices
✅ DO:
• First touch is best - Unmitigated OBs have highest win rate (60-70%)
• Wait for confirmation - Don't buy/sell just because price touched OB
• Use multiple timeframes - Higher TF OBs are stronger than lower TF
• Combine with structure - OB + trendline/support = high probability
• Trade with the bias - More bullish OBs = favor longs
• Respect mitigation - Once OB is mitigated, it's less reliable
• Use proper stop loss - Always place stops beyond the OB zone
• Consider session timing - OBs work best during London/NY sessions
⚠️ DON'T:
• Don't blindly buy/sell at OBs - Wait for confirmation
• Don't ignore mitigation - Gray blocks are much weaker
• Don't trade every OB - Quality over quantity
• Don't fight strong trends - OBs can be run through in strong momentum
• Don't use alone - Combine with price action, support/resistance
• Don't expect 100% win rate - Even best OBs fail sometimes (30-40% of time)
• Don't overtrade - Wait for A+ setups with confluence
🎯 Best Timeframes By Trading Style:
• Scalpers: 1min, 5min (quick OB touches)
• Day Traders: 5min, 15min, 1H (balanced view)
• Swing Traders: 1H, 4H, Daily (major institutional zones)
• Position Traders: 4H, Daily, Weekly (strongest OBs)
🔥 Best Instruments:
• Excellent: Forex major pairs (EUR/USD, GBP/USD), BTC, ETH, ES, NQ
• Good: Gold, Oil, Major indices, Large-cap stocks
• Moderate: Altcoins, small-cap stocks (more noise)
• Avoid: Very low liquidity instruments (OBs less reliable)
⏰ Best Times To Trade OBs:
• London Session (03:00-12:00 EST): Highest OB respect rate
• NY Session (08:00-17:00 EST): Strong OB reactions
• London-NY Overlap (08:00-12:00 EST): Best probability
• Asian Session: Lower probability, wait for London
━━━━━━━━━━━━━━━━━━━━━━━━━━━━
🎓 Advanced Order Block Concepts
Order Block Flips (Polarity Change)
When price breaks through an OB and closes beyond it:
• Bullish OB that's broken becomes bearish (support becomes resistance)
• Bearish OB that's broken becomes bullish (resistance becomes support)
• Trading: Watch for retest of broken OB from opposite side
Order Block Refinement
When multiple OBs form at similar level:
• Later OB "refines" or "replaces" the earlier one
• Use the most recent OB as the active zone
• Older OBs become less relevant
Order Block Clusters
Multiple OBs stacked close together:
• Creates a "super zone" of institutional interest
• Higher probability of reversal
• Wider zone for entries (more room for confirmation)
Fair Value Gaps + Order Blocks
When OB aligns with Fair Value Gap:
• Extremely high probability setup
• Price is drawn to fill the gap AND test the OB
• Double confluence = institutional magnet
Order Block Mitigation Types
• Full Mitigation: Price fully enters and closes inside OB
• Partial Mitigation: Price wicks into OB but closes outside
• False Mitigation: Quick touch then immediate rejection
• Partial/false mitigation = OB still somewhat valid
━━━━━━━━━━━━━━━━━━━━━━━━━━━━
📈 Common Order Block Patterns
Pattern 1: The Perfect Retest
• OB forms during strong move
• Price continues 100-200+ pips
• Price retraces back to OB
• Clean bounce with confirmation candle
• Highest probability pattern
Pattern 2: The Double Tap
• Price tests OB, bounces weakly
• Price tests same OB again
• Second test produces stronger reaction
• Second touch often better entry
Pattern 3: The Fake-Out
• Price breaks through OB
• Immediately reverses back
• "Stop hunt" or liquidity grab
• Enter after price reclaims OB
Pattern 4: The Ladder
• Multiple OBs stacked like stairs
• Price steps from one OB to next
• Each OB provides support/resistance
• Trade OB-to-OB movements
Pattern 5: The Failed OB
• Price crashes through OB without pause
• OB completely invalidated
• Often signals strong momentum
• Don't fight it, trade the breakout
━━━━━━━━━━━━━━━━━━━━━━━━━━━━
🚀 What Makes This Different?
Unlike basic support/resistance indicators, Order Block Identifier:
• ICT Methodology - Based on proven institutional concepts
• Auto-Timeframe Optimization - Works perfectly on all timeframes
• ATR-Based Detection - Adapts to each instrument's volatility
• Mitigation Tracking - Knows when blocks are no longer valid
• Active Block Highlighting - Shows most relevant opportunity
• Smart Filtering - Only shows high-quality institutional zones
• Visual Clarity - Clean, professional appearance
• Real-Time Updates - Blocks update as price action develops
Based On Professional Concepts:
• ICT Smart Money Concepts (SMC)
• Institutional order flow analysis
• Market maker behavior patterns
• Supply and demand zone theory
━━━━━━━━━━━━━━━━━━━━━━━━━━━━
🙏 If You Find This Helpful
• ⭐ Leave your feedback
• 💬 Share your experience in the comments
• 🔔 Follow for updates and new tools
Questions about Order Blocks? Feel free to ask in the comments.
━━━━━━━━━━━━━━━━━━━━━━━━━━━━
Version History
• v1.0 - Initial release with auto-timeframe detection and ATR-based strength filtering

UT Bot Pro Max (Maks Edition)Script v2.0
UT Bot Pro Max is an advanced, high-precision evolution of the well-known UT Bot indicator.
This version is fully rebuilt into a complete decision-making system that evaluates trend structure, volatility conditions, momentum signals, and entry quality.
It is designed for traders who want clear, structured signals supported by objective filters and transparent reasoning.
1. Core Engine: ATR-Based Trailing Logic
At the heart of the system is an ATR dynamic trailing stop.
It is responsible for:
detecting trend reversals
identifying breakout conditions
switching between long and short bias
determining signal strength
Unlike simple ATR lines, this engine adapts to momentum expansion and contraction, forming the backbone for every signal.
2. Three-Tier Signal Structure
Each signal is classified into one of three levels based on the number of confirmations:
Strong Signals
ATR breakout
trend filter (price relative to EMA200)
RSI filter (oversold/overbought context)
This is the highest-quality confirmation and is suitable for full-size entries.
Medium Signals
ATR breakout
trend filter
(no RSI filter)
This represents a valid trend continuation but with slightly reduced confirmation.
Weak Signals
ATR breakout only
(no trend filter, no RSI filter)
This is an early-stage impulse which can evolve into a stronger move.
The multi-level classification allows the trader to size positions rationally and avoid over-committing during uncertain market conditions.
3. Move-Since-Entry Tracking
When a new long or short position is detected, the indicator records the entry price and automatically tracks the percentage movement from that point.
This offers:
real-time monitoring of open trade performance
objective context for managing exits
clear visualization of progress since entry
4. Smart State-Change Alerts
Instead of simple “BUY” or “SELL” messages, the script sends highly structured alerts whenever the internal state changes.
Each alert includes:
the symbol and timeframe
signal direction and strength
recommended position size based on signal tier
ATR values
RSI value and its state
trend context (bullish, bearish, neutral)
distance from ATR trailing stop
movement since entry
previous state reference (optional)
This makes it ideal for automated systems, algorithmic routing, or Telegram-based signal delivery.
5. Professional On-Chart Status Table
The indicator displays a refined information panel containing:
current signal state (Strong / Medium / Weak / Hold)
ATR signal direction
trend filter result
RSI value and condition
distance to trailing stop (percentage)
current position (long / short / flat)
entry recommendation based on signal strength
ATR value and additional context in expanded mode
There is also a compact mode optimized specifically for mobile trading.
6. Optional Heikin Ashi Mode
The indicator can operate using Heikin Ashi close values for traders who prefer smooth, noise-reduced visualizations.
The internal logic is recalculated automatically.
7. Trend-Colored Candles
An optional feature allows candle coloring based on price position relative to the ATR stop line, highlighting bullish and bearish phases directly on the chart.
What This Indicator Provides
Accurate, context-aware entry signals
Scalable position sizing through multi-tier structure
Objective trend confirmation
Breakout detection with volatility adaptation
Continuous tracking of open position performance
Detailed real-time explanations through alerts
A complete visual dashboard consolidating all key metrics
UT Bot Pro Max (Maks Edition) is built as a practical tool for daily trading.
It is suitable for scalping, day trading, swing trading, automated alerts, and mobile workflows.

Triple ATR Adaptive MAs + VWAP Option + Clouds + Candle Trend V2Another one of my experiences ... combining things...
📘 Indicator Description – Triple ATR Adaptive Moving Averages with VWAP Influence
This indicator plots three adaptive moving averages whose behavior changes dynamically based on market volatility (ATR) and optionally VWAP deviation.
Because they adapt in real time to both volatility and VWAP pressure, their movement, slope, and reaction speed differ significantly from traditional moving averages.
🔶 1. ATR-Adaptive Moving Averages
Each of the three MAs uses a custom adaptive formula:
ATR (Average True Range) is measured over a chosen period.
Higher ATR → more volatility → the MA becomes more reactive and moves closer to price.
Lower ATR → stable market → the MA becomes smoother and slower.
This creates a volatility-aware smoothing factor, making the MA expand, contract, and respond to market conditions in ways a classic SMA, EMA, or HMA cannot.
🔷 2. Optional VWAP Influence
Each MA has an independent toggle allowing it to be influenced by VWAP.
When enabled:
The MA is gently “pulled” toward VWAP.
The strength of this attraction is determined by the VWAP Influence parameter (0–1).
This causes the moving averages to behave differently from normal MAs:
In trending markets, the ATR and price push the MA away from VWAP.
In mean-reverting or balanced conditions, VWAP pulls the MA back toward fair value.
The result is an MA that reflects both trend pressure and fair-value pressure.
🔶 3. Visual Behavior: Non-Traditional Movement
Because each MA is simultaneously influenced by volatility, trend magnitude, and VWAP deviation, their shape is often very distinct from normal moving averages.
They may:
Respond faster during high volatility
Flatten out earlier during consolidation
Curve toward VWAP when price becomes extended
Separate or compress depending on ATR strength
This is intentional and essential, since the goal is to show:
✔ Volatility expansion
✔ Trend exhaustion
✔ Overextended price relative to VWAP
✔ Dynamic trend confirmation
Rather than simply smoothing past price.
🔷 4. Three Independent Adaptive Lines
Each of the three moving averages has:
Its own ATR length
Its own sensitivity multiplier
Its own optional VWAP influence
Its own color and trail
This allows the user to combine:
a fast volatility-adaptive trend line
a mid-range adaptive baseline
a slow adaptive long-trend MA
All adapting independently to volatility and VWAP conditions.
🔶 5. Optional Candle Coloring
The indicator can color candles according to trend strength derived from the fast/slow MAs.
Stronger trends produce more vivid colors. Neutral or conflicting trends produce softer colors.
This adds a visual layer to identify:
Trend direction
Trend strength
Volatility state
Market compression
at a glance.
📌 Summary
This indicator does not behave like standard SMAs or EMAs because each line dynamically adapts to:
🔸 ATR (volatility)
🔸 VWAP (fair value)
This makes the indicator extremely responsive to market conditions while still reducing noise during stable phases.
It provides a more realistic, context-aware, and intelligent representation of price behavior compared to traditional moving averages.

SMC N-Gram Probability Matrix [PhenLabs]📊 SMC N-Gram Probability Matrix
Version: PineScript™ v6
📌 Description
The SMC N-Gram Probability Matrix applies computational linguistics methodology to Smart Money Concepts trading. By treating SMC patterns as a discrete “alphabet” and analyzing their sequential relationships through N-gram modeling, this indicator calculates the statistical probability of which pattern will appear next based on historical transitions.
Traditional SMC analysis is reactive—traders identify patterns after they form and then anticipate the next move. This indicator inverts that approach by building a transition probability matrix from up to 5,000 bars of pattern history, enabling traders to see which SMC formations most frequently follow their current market sequence.
The indicator detects and classifies 11 distinct SMC patterns including Fair Value Gaps, Order Blocks, Liquidity Sweeps, Break of Structure, and Change of Character in both bullish and bearish variants, then tracks how these patterns transition from one to another over time.
🚀 Points of Innovation
First indicator to apply N-gram sequence modeling from computational linguistics to SMC pattern analysis
Dynamic transition matrix rebuilds every 50 bars for adaptive probability calculations
Supports bigram (2), trigram (3), and quadgram (4) sequence lengths for varying analysis depth
Priority-based pattern classification ensures higher-significance patterns (CHoCH, BOS) take precedence
Configurable minimum occurrence threshold filters out statistically insignificant predictions
Real-time probability visualization with graphical confidence bars
🔧 Core Components
Pattern Alphabet System: 11 discrete SMC patterns encoded as integers for efficient matrix indexing and transition tracking
Swing Point Detection: Uses ta.pivothigh/pivotlow with configurable sensitivity for non-repainting structure identification
Transition Count Matrix: Flattened array storing occurrence counts for all possible pattern sequence transitions
Context Encoder: Converts N-gram pattern sequences into unique integer IDs for matrix lookup
Probability Calculator: Transforms raw transition counts into percentage probabilities for each possible next pattern
🔥 Key Features
Multi-Pattern SMC Detection: Simultaneously identifies FVGs, Order Blocks, Liquidity Sweeps, BOS, and CHoCH formations
Adjustable N-Gram Length: Choose between 2-4 pattern sequences to balance specificity against sample size
Flexible Lookback Range: Analyze anywhere from 100 to 5,000 historical bars for matrix construction
Pattern Toggle Controls: Enable or disable individual SMC pattern types to customize analysis focus
Probability Threshold Filtering: Set minimum occurrence requirements to ensure prediction reliability
Alert Integration: Built-in alert conditions trigger when high-probability predictions emerge
🎨 Visualization
Probability Table: Displays current pattern, recent sequence, sample count, and top N predicted patterns with percentage probabilities
Graphical Probability Bars: Visual bar representation (█░) showing relative probability strength at a glance
Chart Pattern Markers: Color-coded labels placed directly on price bars identifying detected SMC formations
Pattern Short Codes: Compact notation (F+, F-, O+, O-, L↑, L↓, B+, B-, C+, C-) for quick pattern identification
Customizable Table Position: Place probability display in any corner of your chart
📖 Usage Guidelines
N-Gram Configuration
N-Gram Length: Default 2, Range 2-4. Lower values provide more samples but less specificity. Higher values capture complex sequences but require more historical data.
Matrix Lookback Bars: Default 500, Range 100-5000. More bars increase statistical significance but may include outdated market behavior.
Min Occurrences for Prediction: Default 2, Range 1-10. Higher values filter noise but may reduce prediction availability.
SMC Detection Settings
Swing Detection Length: Default 5, Range 2-20. Controls pivot sensitivity for structure analysis.
FVG Minimum Size: Default 0.1%, Range 0.01-2.0%. Filters insignificant gaps.
Order Block Lookback: Default 10, Range 3-30. Bars to search for OB formations.
Liquidity Sweep Threshold: Default 0.3%, Range 0.05-1.0%. Minimum wick extension beyond swing points.
Display Settings
Show Probability Table: Toggle the probability matrix display on/off.
Show Top N Probabilities: Default 5, Range 3-10. Number of predicted patterns to display.
Show SMC Markers: Toggle on-chart pattern labels.
✅ Best Use Cases
Anticipating continuation or reversal patterns after liquidity sweeps
Identifying high-probability BOS/CHoCH sequences for trend trading
Filtering FVG and Order Block signals based on historical follow-through rates
Building confluence by comparing predicted patterns with other technical analysis
Studying how SMC patterns typically sequence on specific instruments or timeframes
⚠️ Limitations
Predictions are based solely on historical pattern frequency and do not account for fundamental factors
Low sample counts produce unreliable probabilities—always check the Samples display
Market regime changes can invalidate historical transition patterns
The indicator requires sufficient historical data to build meaningful probability matrices
Pattern detection uses standardized parameters that may not capture all institutional activity
💡 What Makes This Unique
Linguistic Modeling Applied to Markets: Treats SMC patterns like words in a language, analyzing how they “flow” together
Quantified Pattern Relationships: Transforms subjective SMC analysis into objective probability percentages
Adaptive Learning: Matrix rebuilds periodically to incorporate recent pattern behavior
Comprehensive SMC Coverage: Tracks all major Smart Money Concepts in a unified probability framework
🔬 How It Works
1. Pattern Detection Phase
Each bar is analyzed for SMC formations using configurable detection parameters
A priority hierarchy assigns the most significant pattern when multiple detections occur
2. Sequence Encoding Phase
Detected patterns are stored in a rolling history buffer of recent classifications
The current N-gram context is encoded into a unique integer identifier
3. Matrix Construction Phase
Historical pattern sequences are iterated to count transition occurrences
Each context-to-next-pattern transition increments the appropriate matrix cell
4. Probability Calculation Phase
Current context ID retrieves corresponding transition counts from the matrix
Raw counts are converted to percentages based on total context occurrences
5. Visualization Phase
Probabilities are sorted and the top N predictions are displayed in the table
Chart markers identify the current detected pattern for visual reference
💡 Note:
This indicator performs best when used as a confluence tool alongside traditional SMC analysis. The probability predictions highlight statistically common pattern sequences but should not be used as standalone trading signals. Always verify predictions against price action context, higher timeframe structure, and your overall trading plan. Monitor the sample count to ensure predictions are based on adequate historical data.

Volume Delta + Bandas de Bollinger📊 Volume Delta + Bollinger Bands Indicator
Characteristics
• Volume Delta Histogram
• Shows the difference between buying and selling pressure.
• Green bars indicate positive delta (buyers dominating).
• Red bars indicate negative delta (sellers dominating).
• The histogram oscillates around the zero line, which represents balance between buyers and sellers.
• Bollinger Bands applied to Delta
• A moving average (basis line) of the delta is calculated.
• Upper and lower bands are plotted using standard deviation.
• These bands highlight periods when the delta moves to statistically extreme levels.
• Helps identify unusual buying or selling pressure compared to recent history.
• Zero Line Reference
• A horizontal line at zero shows equilibrium.
• Crossing above zero suggests net buying pressure.
• Crossing below zero suggests net selling pressure.
How to Use
• Identify Buyer/Seller Dominance
• Green histogram bars above zero → buyers are stronger.
• Red histogram bars below zero → sellers are stronger.
• Spot Extremes with Bollinger Bands
• When delta touches or exceeds the upper band, it signals unusually strong buying pressure.
• When delta touches or exceeds the lower band, it signals unusually strong selling pressure.
• These extremes can precede reversals or mark continuation if confirmed by price action.
• Combine with Price Analysis
• Use delta signals together with price trends and support/resistance levels.
• For example, if price is at resistance and delta spikes into the upper band, it may indicate exhaustion of buyers.
• If price is at support and delta spikes into the lower band, it may indicate exhaustion of sellers.
• Trading Strategy Ideas
• Reversal setups: Look for delta extremes against key price levels.
• Trend confirmation: Sustained delta above zero supports bullish trends; sustained delta below zero supports bearish trends.
• Volatility filter: Bollinger Bands help filter out normal fluctuations and highlight significant imbalances.
👉 In short, this indicator combines order flow pressure (delta) with volatility context (Bollinger Bands), making it useful for spotting moments when buying or selling activity becomes unusually strong compared to recent history.

Stop Hunt / Liquidity Sweep Detector with Momentum Ratingdetects liquidity sweeps as they happen then gives you a rating on how much momentum the reversal has.

Credit Spread RegimeThe Credit Market as Economic Barometer
Credit spreads are among the most reliable leading indicators of economic stress. When corporations borrow money by issuing bonds, investors demand a premium above the risk-free Treasury rate to compensate for the possibility of default. This premium, known as the credit spread, fluctuates based on perceptions of economic health, corporate profitability, and systemic risk.
The relationship between credit spreads and economic activity has been studied extensively. Two papers form the foundation of this indicator. Pierre Collin-Dufresne, Robert Goldstein, and Spencer Martin published their influential 2001 paper in the Journal of Finance, documenting that credit spread changes are driven by factors beyond firm-specific credit quality. They found that a substantial portion of spread variation is explained by market-wide factors, suggesting credit spreads contain information about aggregate economic conditions.
Simon Gilchrist and Egon Zakrajsek extended this research in their 2012 American Economic Review paper, introducing the concept of the Excess Bond Premium. They demonstrated that the component of credit spreads not explained by default risk alone is a powerful predictor of future economic activity. Elevated excess spreads precede recessions with remarkable consistency.
What Credit Spreads Reveal
Credit spreads measure the difference in yield between corporate bonds and Treasury securities of similar maturity. High yield bonds, also called junk bonds, carry ratings below investment grade and offer higher yields to compensate for greater default risk. Investment grade bonds have lower yields because the probability of default is smaller.
The spread between high yield and investment grade bonds is particularly informative. When this spread widens, investors are demanding significantly more compensation for taking on credit risk. This typically indicates deteriorating economic expectations, tighter financial conditions, or increasing risk aversion. When the spread narrows, investors are comfortable accepting lower premiums, signaling confidence in corporate health.
The Gilchrist-Zakrajsek research showed that credit spreads contain two distinct components. The first is the expected default component, which reflects the probability-weighted cost of potential defaults based on corporate fundamentals. The second is the excess bond premium, which captures additional compensation demanded beyond expected defaults. This excess premium rises when investor risk appetite declines and financial conditions tighten.
The Implementation Approach
This indicator uses actual option-adjusted spread data from the Federal Reserve Economic Database (FRED), available directly in TradingView. The ICE BofA indices represent the industry standard for measuring corporate bond spreads.
The primary data sources are FRED:BAMLH0A0HYM2, the ICE BofA US High Yield Index Option-Adjusted Spread, and FRED:BAMLC0A0CM, the ICE BofA US Corporate Index Option-Adjusted Spread for investment grade bonds. These indices measure the spread of corporate bonds over Treasury securities of similar duration, expressed in basis points.
Option-adjusted spreads account for embedded options in corporate bonds, providing a cleaner measure of credit risk than simple yield spreads. The methodology developed by ICE BofA is widely used by institutional investors and central banks for monitoring credit conditions.
The indicator offers two modes. The HY-IG excess spread mode calculates the difference between high yield and investment grade spreads, isolating the pure compensation for below-investment-grade credit risk. This measure is less affected by broad interest rate movements. The HY-only mode tracks the absolute high yield spread, capturing both credit risk and the overall level of risk premiums in the market.
Interpreting the Regimes
Credit conditions are classified into four regimes based on Z-scores calculated from the spread proxy.
The Stress regime occurs when spreads reach extreme levels, typically above a Z-score of 2.0. At this point, credit markets are pricing in significant default risk and economic deterioration. Historically, stress regimes have coincided with recessions, financial crises, and major market dislocations. The 2008 financial crisis, the 2011 European debt crisis, the 2016 commodity collapse, and the 2020 pandemic all triggered credit stress regimes.
The Elevated regime, between Z-scores of 1.0 and 2.0, indicates above-normal risk premiums. Credit conditions are tightening. This often occurs in the build-up to stress events or during periods of uncertainty. Risk management should be heightened, and exposure to credit-sensitive assets may be reduced.
The Normal regime covers Z-scores between -1.0 and 1.0. This represents typical credit conditions where spreads fluctuate around historical averages. Standard investment approaches are appropriate.
The Low regime occurs when spreads are compressed below a Z-score of -1.0. Investors are accepting below-average compensation for credit risk. This can indicate complacency, strong economic confidence, or excessive risk-taking. While often associated with favorable conditions, extremely tight spreads sometimes precede sudden reversals.
Credit Cycle Dynamics
Beyond static regime classification, the indicator tracks the direction and acceleration of spread movements. This reveals where credit markets stand in the credit cycle.
The Deteriorating phase occurs when spreads are elevated and continuing to widen. Credit conditions are actively worsening. This phase often precedes or coincides with economic downturns.
The Recovering phase occurs when spreads are elevated but beginning to narrow. The worst may be over. Credit conditions are improving from stressed levels. This phase often accompanies the early stages of economic recovery.
The Tightening phase occurs when spreads are low and continuing to compress. Credit conditions are very favorable and improving further. This typically occurs during strong economic expansions but may signal building complacency.
The Loosening phase occurs when spreads are low but beginning to widen from compressed levels. The extremely favorable conditions may be normalizing. This can be an early warning of changing sentiment.
Relationship to Economic Activity
The predictive power of credit spreads for economic activity is well-documented. Gilchrist and Zakrajsek found that the excess bond premium predicts GDP growth, industrial production, and unemployment rates over horizons of one to four quarters.
When credit spreads spike, the cost of corporate borrowing increases. Companies may delay or cancel investment projects. Reduced investment leads to slower growth and eventually higher unemployment. The transmission mechanism runs from financial conditions to real economic activity.
Conversely, tight credit spreads lower borrowing costs and encourage investment. Easy credit conditions support economic expansion. However, excessively tight spreads may encourage over-leveraging, planting seeds for future stress.
Practical Application
For equity investors, credit spreads provide context for market risk. Equities and credit often move together because both reflect corporate health. Rising credit spreads typically accompany falling stock prices. Extremely wide spreads historically have coincided with equity market bottoms, though timing the reversal remains challenging.
For fixed income investors, spread regimes guide sector allocation decisions. During stress regimes, flight to quality favors Treasuries over corporates. During low regimes, spread compression may offer limited additional return for credit risk, suggesting caution on high yield.
For macro traders, credit spreads complement other indicators of financial conditions. Credit stress often leads equity volatility, providing an early warning signal. Cross-asset strategies may use credit regime as a filter for position sizing.
Limitations and Considerations
FRED data updates with a lag, typically one business day for the ICE BofA indices. For intraday trading decisions, more current proxies may be necessary. The data is most reliable on daily timeframes.
Credit spreads can remain at extreme levels for extended periods. Mean reversion signals indicate elevated probability of normalization but do not guarantee timing. The 2008 crisis saw spreads remain elevated for many months before normalizing.
The indicator is calibrated for US credit markets. Application to other regions would require different data sources such as European or Asian credit indices. The relationship between spreads and subsequent economic activity may vary across market cycles and structural regimes.
References
Collin-Dufresne, P., Goldstein, R.S., and Martin, J.S. (2001). The Determinants of Credit Spread Changes. Journal of Finance, 56(6), 2177-2207.
Gilchrist, S., and Zakrajsek, E. (2012). Credit Spreads and Business Cycle Fluctuations. American Economic Review, 102(4), 1692-1720.
Krishnamurthy, A., and Muir, T. (2017). How Credit Cycles across a Financial Crisis. Working Paper, Stanford University.

Greater Moving AverageThe purpose for this indicator is to function as a comprehensive market-state detector, with the primary goal of avoiding a market crash.
Mendoza Lines (V-pattern detection) identify early crash conditions and warn when market structure becomes unstable.
RSI/volume-shaded candles + Supertrend confirm momentum and trend, creating a unified system to avoid major drawdowns.
Enhanced Wyckoff ranges with ATR.
Mendoza lines identify abrupt V-shaped reversals which often precede high-risk crash structures. By tracking both the formation and resolution of these patterns across multiple timeframes, the indicator provides early warning signals when the market is entering unstable territory, allowing traders to step aside before liquidity collapses or structural breakdowns begin.
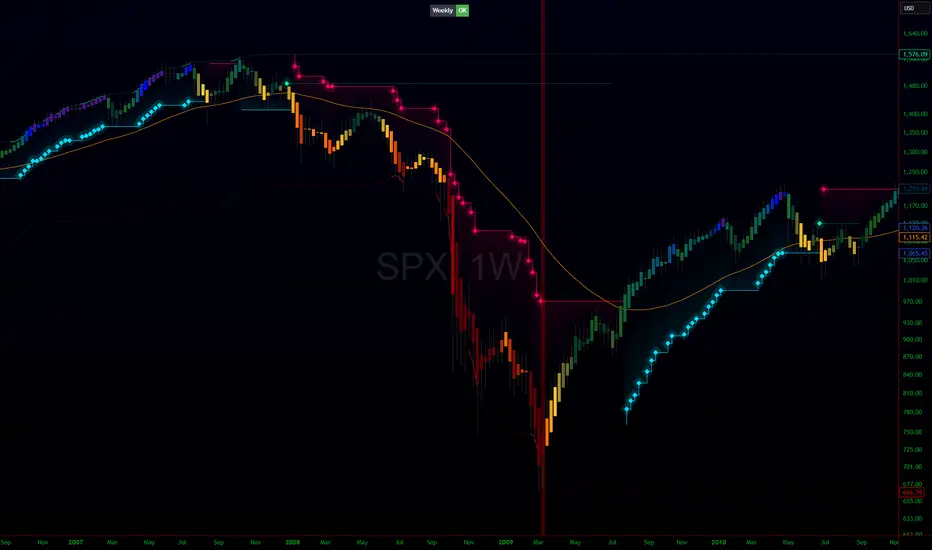
Ideal configurations use Heikin Ashi to smooth out candle structure. Observe SPX on a Weekly Chart, which correctly identifies exits and entries during the 2001 and 2009 crashes. On a 6 hour chart, the Tariff low is correctly identified. The improved VWAP uses a cumulative metric rather than the built in ta.vwap calculation, and functions as a macro low beacon when crossed with the 200 EMA. Historically, these crosses have aligned closely with macro cycle lows.
To round out the system, the indicator overlays RSI-based and volume-weighted candle shading to reflect internal momentum and real buying/selling pressure directly on the chart, making shifts in strength immediately visible. A Supertrend confirmation layer acts as the final filter, smoothing noise and verifying trend direction before decisions are made.
Reversal WaveThis is the type of quantitative system that can get you hated on investment forums, now that the Random Walk Theory is back in fashion. The strategy has simple price action rules, zero over-optimization, and is validated by a historical record of nearly a century on both Gold and the S&P 500 index.
Recommended Markets
SPX (Weekly, Monthly)
SPY (Monthly)
Tesla (Weekly)
XAUUSD (Weekly, Monthly)
NVDA (Weekly, Monthly)
Meta (Weekly, Monthly)
GOOG (Weekly, Monthly)
MSFT (Weekly, Monthly)
AAPL (Weekly, Monthly)
System Rules and Parameters
Total capital: $10,000
We will use 10% of the total capital per trade
Commissions will be 0.1% per trade
Condition 1: Previous Bearish Candle (isPrevBearish) (the closing price was lower than the opening price).
Condition 2: Midpoint of the Body The script calculates the exact midpoint of the body of that previous bearish candle.
• Formula: (Previous Open + Previous Close) / 2.
Condition 3: 50% Recovery (longCondition) The current candle must be bullish (green) and, most importantly, its closing price must be above the midpoint calculated in the previous step.
Once these parameters are met, the system executes a long entry and calculates the exit parameters:
Stop Loss (SL): Placed at the low of the candle that generated the entry signal.
Take Profit (TP): Calculated by projecting the risk distance upward.
• Calculation: Entry Price + (Risk * 1).
Risk:Reward Ratio of 1:1.
About the Profit Factor
In my experience, TradingView calculates profits and losses based on the percentage of movement, which can cause returns to not match expectations. This doesn’t significantly affect trending systems, but it can impact systems with a high win rate and a well-defined risk-reward ratio. It only takes one large entry candle that triggers the SL to translate into a major drop in performance.
For example, you might see a system with a 60% win rate and a 1:1 risk-reward ratio generating losses, even though commissions are under control relative to the number of trades.
My recommendation is to manually calculate the performance of systems with a well-defined risk-reward ratio, assuming you will trade using a fixed amount per trade and limit losses to a fixed percentage.
Remember that, even if candles are larger or smaller in size, we can maintain a fixed loss percentage by using leverage (in cases of low volatility) or reducing the capital at risk (when volatility is high).
Implementing leverage or capital reduction based on volatility is something I haven’t been able to incorporate into the code, but it would undoubtedly improve the system’s performance dramatically, as it would fix a consistent loss percentage per trade, preventing losses from fluctuating with volatility swings.
For example, we can maintain a fixed loss percentage when volatility is low by using the following formula:
Leverage = % of SL you’re willing to risk / % volatility from entry point to exit or SL
And if volatility is high and exceeds the fixed percentage we want to expose per trade (if SL is hit), we could reduce the position size.
For example, imagine we only want to risk 15% per SL on Tesla, where volatility is high and would cause a 23.57% loss. In this case, we subtract 23.57% from 15% (the loss percentage we’re willing to accept per trade), then subtract the result from our usual position size.
23.57% - 15% = 8.57%
Suppose I use $200 per trade.
To calculate 8.57% of $200, simply multiply 200 by 8.57/100. This simple calculation shows that 8.57% equals about $17.14 of the $200. Then subtract that value from $200:
$200 - $17.14 = $182.86
In summary, if we reduced the position size to $182.86 (from the usual $200, where we’re willing to lose 15%), no matter whether Tesla moves up or down 23.57%, we would still only gain or lose 15% of the $200, thus respecting our risk management.
Final Notes
The code is extremely simple, and every step of its development is detailed within it.
If you liked this strategy, which complements very well with others I’ve already published, stay tuned. Best regards.

Scary Flush Indicator R0Work in progress.
Calculates the gradient based on candle lows (previous low to current low). Works on all time frames.
Looks for a selling gradient of >0.75pts per minute then highlights. Anything less than this indicates a lazy grind down and indicates a potential invalidation for the FBD.

Candlestick Pattern Identifier (Extended + Alerts)Candlestick Pattern Identifier (Extended + Alerts)

FOR CRT SMT – 4 CANDLEFOR CRT SMT – 4 CANDLE Indicator
This indicator detects SMT (Smart Money Technique) divergence by comparing the last 4 candle highs and lows of two different assets.
Originally designed for BTC–ETH comparison, but it works on any market, including Forex pairs.
You can open EURUSD on the chart and select GBPUSD from the settings, and the indicator will detect SMT divergence between EUR and GBP the same way it does between BTC and ETH. This makes it useful for analyzing correlated markets across crypto, forex, and more.
🔴 Upper SMT (Bearish Divergence – Red)
Occurs when:
The main chart asset makes a higher high,
The comparison asset makes a lower high.
This may signal a liquidity grab and potential reversal.
🟢 Lower SMT (Bullish Divergence – Green)
Occurs when:
The main chart asset makes a lower low,
The comparison asset makes a higher low.
This may indicate the market is sweeping liquidity before reversing upward.
📌 Features
Uses the last 4 candles of both assets.
Automatically draws divergence lines.
Shows clear “SMT ↑” or “SMT ↓” labels.
Works on Crypto, Forex, and all correlated assets.

3 Lines RCI + Psy Signal + RSI Background📌 3 Lines RCI + Psy Signal + RSI Background
This indicator combines three RCI lines, Psychological Line signals, RSI-based background highlights, and ADX strength detection to visualize market momentum, trend strength, and potential reversal zones.
🔍 Main Features
📌 1. Triple RCI (Rank Correlation Index)
Displays Short / Mid / Long RCI
Detects momentum shifts and trend reversals
Highlight zones:
Overbought: +80 ~ +100 (Red Zone)
Oversold: -80 ~ -100 (Green Zone)
📌 2. Psychological Line Signal
Column bars appear only in extreme conditions:
Overbought → Red Bars
Oversold → Green Bars
Helps detect short-term sentiment extremes
📌 3. RSI Background Highlight
Red Background: RSI > Overbought threshold
Green Background: RSI < Oversold threshold
Provides a visual cue of underlying market pressure.
📌 4. ADX Trend Strength
ADX line color shows strength level:
Blue: Weak trend
Yellow: Moderate trend
Red: Strong trend
Useful to identify whether signals occur in a trend or range state.
🎯 Trading Usage Tips
RCI + RSI + Psy confluence can identify strong reversal timing.
Use signals only when ADX is weak or moderate to avoid counter-trading a strong trend.
Combine short/mid RCI crossovers with extreme zones for potential entry timing.
⚙️ Suitable For
Scalping, day trading, swing trading
Stocks, Forex, Crypto, Indices, Commodities

Liquidity Swings [LuxAlgo] – Intrabar More Granulara “high-resolution” version of the same script with the more-granular pivots baked in.
SMC + OB + FVG + Reversal + UT Bot + Hull Suite – by Fatich.id🎯 7 INTEGRATED SYSTEMS:
✓ Mxwll Suite (SMC + Auto Fibs + CHoCH/BOS)
✓ UT Bot (Trend Signals + Label Management)
✓ Hull Suite (Momentum Analysis)
✓ LuxAlgo FVG (Fair Value Gaps)
✓ LuxAlgo Order Blocks (Volume Pivots) ⭐ NEW
✓ Three Bar Reversal (Pattern Recognition)
✓ Reversal Signals (Momentum Count Style)
⚡ KEY FEATURES:
• Smart Money Structure (CHoCH/BOS/I-CHoCH/I-BoS)
• Auto Fibonacci (10 customizable levels)
• Order Block Detection (Auto mitigation)
• Fair Value Gap Tracking
• Session Highlights (NY/London/Asia)
• Volume Activity Dashboard
• Multi-Timeframe Support
• Clean Label Management
🎨 PERFECT FOR:
• Smart Money Concept Traders
• Order Flow & Liquidity Analysis
• Support/Resistance Trading
• Trend Following & Reversals
• Multi-Timeframe Analysis
💡 RECOMMENDED SETTINGS:
Clean Charts: OB Count 3, UT Signals 3, FVG 5
Detailed Analysis: OB Count 5-10, All Signals
Scalping: Low sensitivity, Hull 20-30
Swing Trading: High sensitivity, Hull 55-100

Volume Profile VisionVolume Profile Vision - Complete Description
Overview
Volume Profile Vision (VPV) is an advanced volume profile indicator that visualizes where trading activity has occurred at different price levels over a specified time period. Unlike traditional volume indicators that show volume over time, this indicator displays volume distribution across price levels, helping traders identify key support/resistance zones, fair value areas, and potential reversal points.
What Makes This Indicator Original
Volume Profile Vision introduces several unique features not found in standard volume profile tools:
Dual-Direction Histogram Display:
Unlike conventional volume profiles that only show bars extending in one direction, VPV displays volume bars extending both left (into historical candles) and right (as a traditional histogram). This bi-directional approach allows traders to see exactly where historical price action intersected with high-volume nodes.
Real-Time Candle Highlighting: The indicator dynamically highlights volume bars that intersect with the current candle's price range, making it immediately obvious which volume levels are currently in play.
Four Professional Color Schemes: Each color scheme uses distinct gradient algorithms and visual encoding systems:
Traffic Light: Uses red (POC), green (VA boundaries), yellow (HVN), with grayscale gradients outside the value area
Aurora Glass: Modern cyan-to-magenta gradient with hot magenta POC highlighting
Obsidian Precision: Professional dark theme with white POC and electric cyan accents
Black Ice: Monochromatic cyan family with graduated intensity
Adaptive Transparency System: Automatically adjusts bar transparency based on position relative to value area, with special handling for each color scheme to maintain visual clarity.
Core Concepts & Calculations
Volume Distribution Analysis
The indicator divides the visible price range into user-defined price levels (default: 80 levels) and calculates the total volume traded at each level by:
Scanning back through the specified lookback period (customizable or visible range)
For each historical bar, determining which price levels the bar's high/low range intersects
Accumulating volume for each intersected price level
Optionally filtering by bullish/bearish volume only
Point of Control (POC)
The POC is the price level with the highest traded volume during the analyzed period. This represents the "fairest" price where most traders agreed on value. The indicator marks this with distinct coloring (red in Traffic Light, magenta in Aurora Glass, white in Obsidian Precision, cyan in Black Ice).
Trading Significance: POC acts as a strong magnet for price - markets tend to return to fair value. When price is away from POC, traders watch for:
Mean reversion opportunities when price is far from POC
Rejection signals when price tests POC from above/below
Breakout confirmation when price breaks through and holds beyond POC
Value Area (VA)
The Value Area encompasses the price range where a specified percentage (default: 68%) of all volume traded. This represents the range of "accepted value" by market participants.
Calculation Method:
Start at the POC (highest volume level)
Expand upward and downward, adding adjacent price levels
Always add the level with higher volume next
Continue until accumulated volume reaches the VA percentage threshold
Value Area High (VAH): Upper boundary of accepted value - acts as resistance
Value Area Low (VAL): Lower boundary of accepted value - acts as support
Trading Significance:
Price spending time inside VA indicates market equilibrium
Breakouts above VAH suggest bullish momentum shift
Breakdowns below VAL suggest bearish momentum shift
Returns to VA boundaries often provide high-probability entry zones
High Volume Nodes (HVN)
Price levels with volume exceeding a threshold percentage (default: 80%) of POC volume. These represent areas of strong agreement and consolidation.
Trading Significance:
HVNs act as strong support/resistance zones
Price tends to consolidate at HVNs before making directional moves
Breaking through an HVN often signals strong momentum
Low Volume Nodes (LVN)
Price levels within the Value Area with volume ≤30% of POC volume. These are zones price moved through quickly with minimal consolidation.
Trading Significance:
LVNs represent areas of rejection - price finds little acceptance
Price tends to move rapidly through LVN zones
Useful for setting stop-losses (below LVN for longs, above for shorts)
Can identify potential gaps or "air pockets" in the market structure
Grayscale POC Detection
A secondary POC detection system identifies the highest volume level outside the Value Area (with a 2-level buffer to avoid confusion). This helps identify significant volume accumulation zones that exist beyond the main value area.
How to Use This Indicator
Setup
Choose Lookback Period:
Enable "Use Visible Range" to analyze only what's on your chart
Or set "Fixed Range Lookback Depth" (default: 200 bars) for consistent analysis
Adjust Profile Resolution:
"Number of Price Levels" (default: 80) - higher = more granular analysis, lower = broader zones
Select Color Scheme:
Traffic Light: Best for clear POC/VA/HVN identification
Aurora Glass: Modern aesthetic for dark charts
Obsidian Precision: Professional trader preference
Black Ice: Minimalist single-color family
Visual Customization
Left Extension: How far back the left-side histogram extends into historical candles (default: 490 bars)
Right Extension: Width of the traditional histogram bars on the right (default: 50 bars)
Right Margin: Space between current price bar and histogram (default: 0 for flush alignment)
Left Profile Gap: Space between left-side histogram and candles (default: 0)
Trading Strategies
Strategy 1: Value Area Mean Reversion
Wait for price to move outside the Value Area (above VAH or below VAL)
Look for rejection signals (wicks, bearish/bullish candles)
Enter trades toward the POC
Take profits as price returns to POC or opposite VA boundary
Strategy 2: Breakout Confirmation
Identify when price is consolidating within the Value Area
Wait for a strong close above VAH (bullish) or below VAL (bearish)
Enter on the breakout or on first pullback to the VA boundary
Target previous HVNs or swing highs/lows outside the VA
Strategy 3: POC Support/Resistance
Watch for price approaching the POC level
If approaching from below, look for bullish reversal patterns at POC (support)
If approaching from above, look for bearish reversal patterns at POC (resistance)
Trade in the direction of the bounce with stops beyond the POC
Strategy 4: LVN Fast Movement Zones
Identify LVN zones within the Value Area (marked with "LVN" label)
When price enters an LVN, expect rapid movement through the zone
Avoid entering trades within LVNs
Use LVNs as confirmation of directional momentum
Alert System
The indicator includes 7 customizable alert conditions:
POC Touch: Alerts when price comes within 0.5 ATR of POC
VAH/VAL Touch: Alerts at Value Area boundaries
VA Breakout: Alerts on breakouts above VAH or below VAL
HVN Touch: Alerts when price contacts High Volume Nodes
LVN Entry: Alerts when entering Low Volume zones
POC Shift: Alerts when POC moves to a new price level
Reading the Profile
Price Labels (shown on the right side):
POC: Point of Control - highest volume price level
VAH: Value Area High - upper boundary of accepted value
VAL: Value Area Low - lower boundary of accepted value
LVN: Low Volume Node - expect fast movement through this zone
Color Intensity Interpretation:
Brighter colors = higher volume concentration
Dimmer colors = lower volume
Abrupt color changes = transition between volume zones
Gaps in the histogram = price levels with no trading activity
Technical Details
Volume Accumulation Logic:
For each bar in lookback period:
For each price level:
If bar's high/low range intersects price level:
Add bar's volume to that price level's total
Gradient Algorithm:
Traffic Light: Dual-range piecewise gradient (0-50% and 50-100% volume intensity)
Aurora Glass: Linear cyan-to-magenta interpolation
Obsidian Precision: Dark blue gradient with cyan highlights
Black Ice: Three-stage cyan intensity progression
Real-Time Updates:
The profile recalculates on every bar, including real-time tick data, ensuring the volume distribution always reflects current market structure.
Best Practices
Timeframe Selection: Use higher timeframes (4H, Daily) for swing trading, lower timeframes (5min, 15min) for day trading
Combine with Price Action: Volume profile shows WHERE, price action shows WHEN
Multiple Timeframe Analysis: Check daily VP for major levels, then drill down to intraday for entries
Volume Type Selection: Use "Bullish" volume in uptrends, "Bearish" in downtrends, or "Both" for complete picture
Adjust VA Percentage: 68% (default) captures one standard deviation; try 70% for tighter or 60% for broader value areas
Performance Notes
Maximum bars back: 5000 (handles deep historical analysis)
Maximum boxes: 500 (handles complex profiles)
Optimized calculation: Only recalculates on last bar for efficiency
Real-time capable: Updates as new ticks arrive

Bitcoin Multibook v1.0 [Apollo Algo]Bitcoin Multibook v1.0 by Apollo Algo is an advanced market depth and order flow visualization tool that brings professional-grade multi-exchange order book analysis to TradingView. Inspired by Bookmap's multibook functionality and built upon LucF's original single "Tape" indicator concept, this tool aggregates real-time trading data from multiple Bitcoin exchanges into a unified tape display.
Credits & Attribution
This indicator is an evolution of the original "Tape" indicator created by LucF (TradingView: @LucF). The multibook enhancement and Bitcoin-specific optimizations were developed by Apollo Algo to provide traders with institutional-grade market microstructure visibility across major Bitcoin trading venues.
Purpose & Philosophy
Bitcoin leads the entire cryptocurrency market. By monitoring order flow across the primary Bitcoin exchanges simultaneously, traders gain crucial insights into:
Cross-exchange arbitrage opportunities
Institutional order flow patterns
Market maker positioning
True market sentiment beyond single-exchange data
Key Features
📊 Multi-Exchange Data Aggregation
Real-time tape from 3 major exchanges:
Binance (BTCUSDT)
Coinbase (BTCUSD)
Kraken (BTCUSD)
Customizable source inputs for any trading pair
Synchronized price and volume tracking
Exchange name identification in tape display
📈 Advanced Tape Display
Dynamic tape visualization with configurable line quantity (0-50 lines)
Directional flow indicators (+/- symbols for price changes)
Exchange identification for each trade
Volume precision control (0-16 decimal places)
Flexible positioning (9 screen positions available)
Real-time only operation for accurate order flow
🎯 Volume Delta Analysis
Real-time cumulative volume delta calculation
Divergence detection (price vs. volume direction)
Colored visual feedback for market sentiment
Total session delta displayed in footer
Cross-exchange delta aggregation
🚨 Smart Alert System
Marker 1: Volume Delta Bumps (⬆⬇)
Triggers on consecutive volume delta increases
Identifies momentum acceleration points
Filters out divergent movements
Marker 2: Volume Delta Thresholds (⇑⇓)
Fires when delta exceeds user-defined thresholds
Catches significant order imbalances
Excludes divergence conditions
Marker 3: Large Volume Detection (⤊⤋)
Highlights unusually large individual trades
Spots potential institutional activity
Direction-specific triggers
Configure Data Sources
Adjust exchange pairs if needed (e.g., for altcoin analysis)
Leave blank to disable specific exchanges
Use format: EXCHANGE:SYMBOL
Customize Display
Set tape line quantity based on screen size
Position the table for optimal visibility
Choose color scheme (text or background)
Adjust text size for readability
Configure Alerts
Enable desired markers (1, 2, or 3)
Set volume thresholds appropriate for your timeframe
Choose direction (Longs, Shorts, or Both)
Create TradingView alerts on marker signals
Trading Applications
Scalping (1-5 min)
Monitor tape speed for momentum shifts
Watch for cross-exchange divergences
Track large volume clusters
Use Marker 1 for quick momentum trades
Day Trading (5-60 min)
Identify accumulation/distribution phases
Spot institutional positioning
Confirm breakout validity with volume delta
Use Marker 2 for significant imbalances
Swing Trading (1H+)
Analyze volume delta trends
Detect smart money rotation
Time entries with order flow confirmation
Use Marker 3 for institutional footprints
Advanced Techniques
Cross-Exchange Arbitrage Detection
When price disparities appear between exchanges:
Immediate Opportunity: Price differences > 0.1%
Bot Activity: Rapid convergence patterns
Liquidity Vacuum: One exchange leading others
Divergence Trading Strategies
Volume delta diverging from price direction:
Absorption: Strong hands entering (price down, delta up)
Distribution: Smart money exiting (price up, delta down)
Reversal Setup: Sustained divergence over multiple bars
Institutional Footprint Recognition
Large volume characteristics:
Simultaneous Spikes: Same timestamp across exchanges
TWAP Patterns: Consistent volume over time
Iceberg Orders: Repeated same-size trades
Pine Script v6 Enhancements
Type Safety Improvements
Strict boolean type handling
Explicit type declarations
Enhanced error checking
Performance Optimizations
Improved request.security() function
Better memory management with arrays
Optimized table rendering
Modern Syntax Updates
indicator() instead of study()
Namespaced math functions (math.round())
Typed input functions (input.int(), input.float())
Performance Considerations
System Requirements
Real-time Data: Essential for tape operation
Multiple Security Calls: May impact performance
Array Operations: Memory intensive with high line counts
Table Rendering: CPU usage increases with tape size
Optimization Tips
Reduce tape lines for better performance
Increase volume filter to reduce noise
Disable unused markers
Use text-only coloring for faster rendering

ShooterViz Lazy Trader EMA SystemShooterViz Lazy Trader EMA System - Complete User Guide
What This Script Does
This is a position scaling indicator that tells you exactly when to enter, add to, and exit trades using a simplified 5-EMA system. It removes the guesswork and decision fatigue from trading by giving you clear visual signals.
The Core Concept
3 entry signals that build your position from 20% → 50% → 100%
2 exit signals that scale you out at 50% → 50% (complete exit)
1 higher timeframe filter that keeps you on the right side of the trend
No Fibonacci calculations, no RSI divergence, no multi-indicator confusion. Just EMAs and price action.
What You'll See On Your Chart
1. Colored EMA Lines
Blue Lines (Entry Zone):
3 EMA (lightest blue) - Early reversal detector
5 EMA (darker blue) - Confirmation line
Green Lines (Add Zone):
21 EMA (bright green) - First add location
34 EMA (lighter green) - Final add location
Red Lines (Exit Zone):
89 EMA (lighter red) - First exit trigger
144 EMA (darker red) - Final exit trigger
Orange Lines (Hyper Frame - optional):
Hyper 21 EMA (from higher timeframe) - Trend direction
Hyper 34 EMA (from higher timeframe) - Bias confirmation
2. Triangle Signals
Green Triangles (Below Price) = BUY/ADD:
Lime triangle with "20%" = Entry 1: Price reclaimed 3→5 EMA (starter position)
Green triangle with "30%" = Entry 2: Price bounced off 21 EMA (first add)
Teal triangle with "50%" = Entry 3: Price broke out from 34 EMA compression (final add)
Red Triangles (Above Price) = SELL:
Orange triangle with "50% OFF" = Exit 1: Price broke below 89 EMA (take half off)
Red triangle with "EXIT ALL" = Exit 2: Price broke below 144 EMA (close remaining position)
3. Background Color (Trend Bias)
Light green background = Hyper frame EMAs trending up (bias LONG)
Light red background = Hyper frame EMAs trending down (bias SHORT)
Gray background = Neutral/choppy (be cautious)
4. Info Table (Top Right Corner)
A live status dashboard showing:
Which entry signals are currently active (✓ or —)
Which exit signals are currently active (⚠ or ⛔)
Current hyper frame bias (🟢 LONG / 🔴 SHORT / ⚪ NEUTRAL)
Which timeframe you're using for hyper frame filtering
How to Install and Set Up
Step 1: Add the Script to TradingView
Open TradingView
Click "Pine Editor" at the bottom of the screen
Copy the entire script code
Paste it into the Pine Editor
Click "Add to Chart"
Step 2: Configure Your Settings
Click the gear icon ⚙️ next to "LazyEMA" in your indicators list.
Critical Settings to Configure:
Hyper Frame Selection (Most Important!)
Location: "Hyper Frame (Pick ONE)" section
Setting: "Timeframe"
What to choose:
Trading 15min or 1H charts? → Use "240" (4-hour)
Trading 4H or Daily charts? → Use "D" (Daily)
Trading Daily or Weekly charts? → Use "W" (Weekly)
Why this matters: This filter keeps you aligned with the bigger trend. Only take longs when this timeframe is green, shorts when it's red.
MA Type (Optional, default is fine)
Location: "MA Config" section
Default: EMA (recommended)
Options: EMA, SMA, WMA, HMA, RMA, VWMA
Most traders should stick with EMA
Visual Toggles (Customize your view)
Entry Zone: Turn individual EMAs on/off (3, 5, 21, 34)
Exit Zone: Turn individual EMAs on/off (89, 144)
Hyper Frame: Toggle the higher timeframe EMAs on/off
Step 3: Clean Up Your Chart
Turn OFF these if visible:
Volume bars (they clutter the view)
Any other indicators you have loaded
Grid lines (optional, but cleaner)
Keep ONLY:
Price candles
Your ShooterViz Lazy Trader EMA System
Maybe support/resistance levels if you manually draw them
How to Trade With This Script
The Basic Workflow
Before the Market Opens:
Check the background color and info table bias
Green background? Look for LONG setups only
Red background? Look for SHORT setups only
Gray background? Stay flat or trade small
During the Trading Session:
LONGS (When hyper frame is bullish):
Wait for Entry 1 signal:
Lime triangle appears with "20%"
Price has reclaimed the 5 EMA after dipping to 3 EMA
Action: Enter 20% of your intended position
Stop loss: Place below the 5 EMA or recent swing low
Wait for Entry 2 signal:
Green triangle appears with "30%"
Price pulled back to 21 EMA and bounced
Action: Add 30% more (you're now at 50% total)
Move stop: Trail it up to below 21 EMA
Wait for Entry 3 signal:
Teal triangle appears with "50%"
Price compressed at 34 EMA and broke out
Action: Add final 50% (you're now 100% loaded)
Move stop: Trail it up to below 34 EMA
Wait for Exit 1 signal:
Orange triangle appears with "50% OFF"
Price broke below 89 EMA
Action: Exit 50% of your position immediately
Move stop on rest: Trail to 89 EMA or lock in profits
Wait for Exit 2 signal:
Red triangle appears with "EXIT ALL"
Price broke below 144 EMA
Action: Exit remaining 50% (you're now flat)
Or: Stop gets hit at 89 EMA (same result)
SHORTS (When hyper frame is bearish):
Same process, but inverted
Triangles appear above price instead of below
Look for breakdowns below EMAs instead of bounces off them
Exit when price reclaims 89 and 144 EMAs
Real-World Example Walkthrough
Setup: Trading ES (S&P 500 Futures) on 1H Chart
Chart Configuration:
Timeframe: 1 Hour
Hyper Frame: 240 (4-hour)
Ticker: ES
Pre-Market Check:
Background is light green
Info table shows "🟢 LONG" for Hyper Bias
Decision: Only look for long entries today
9:30 AM - Market Opens
Price dips and touches 3 EMA
Watch for: Reclaim of 5 EMA
9:45 AM - Entry 1 Triggers
Lime triangle appears below bar
Price closed above 5 EMA at $4,550
Action taken:
Enter long 20% position (2 contracts if targeting 10 total)
Stop loss at $4,545 (below 5 EMA)
Risk: $10 per contract × 2 = $20 risk
10:30 AM - Entry 2 Triggers
Price rallied to $4,565, pulls back
Green triangle appears at 21 EMA ($4,555)
Action taken:
Add 30% (3 more contracts, now have 5 total)
Move stop to $4,550 (below 21 EMA)
Current P/L: +$25 ($5 gain on original 2 contracts, break-even on new 3)
11:15 AM - Entry 3 Triggers
Price consolidates at 34 EMA around $4,560
Teal triangle appears as price breaks to $4,568
Action taken:
Add final 50% (5 more contracts, now have 10 total)
Move stop to $4,555 (below 34 EMA)
Current P/L: +$70
1:00 PM - Price Extends
Price rallies to $4,595 (on track)
89 EMA is at $4,575
No action yet, let it run
2:15 PM - Exit 1 Triggers
Price pulls back from $4,600
Orange triangle appears as price breaks below 89 EMA at $4,580
Action taken:
Exit 50% (5 contracts closed at $4,580)
Keep 5 contracts with stop at 89 EMA ($4,575)
Banked: +$150 average gain on closed 5 contracts
2:45 PM - Exit 2 Triggers
Price continues down
Red triangle appears as price breaks 144 EMA at $4,570
Action taken:
Exit remaining 5 contracts at $4,570
Banked: +$100 on remaining 5 contracts
Final Results:
Total gain: $250 on the trade
Initial risk: $50 (if stopped out at Entry 1)
Risk/Reward: 5:1
Time in trade: ~5 hours
Common Questions
"What if I miss Entry 1? Can I still take Entry 2?"
Yes! Each entry is independent. If you miss the 3→5 reclaim, wait for the 21 EMA bounce. You'll start with a 30% position instead of 20%, but that's fine.
Rule: Never chase. Wait for the next EMA setup.
"What if multiple entry signals trigger at the same bar?"
Rare, but possible. If you see both Entry 1 and Entry 2 trigger together:
Take Entry 1 first (20%)
If the next bar confirms Entry 2 is still valid, add 30%
When in doubt, scale in gradually
"The hyper frame is green but I'm seeing short signals?"
Don't take them. The hyper frame is your bias filter. If it says "go long," ignore short setups. They're usually lower probability and will get stopped out.
"Can I use this for swing trading overnight?"
Absolutely. Just switch your hyper frame:
If you're on Daily charts, use Weekly hyper frame
If you're on 4H charts, use Daily hyper frame
Adjust position sizes for overnight risk
"What if the signal appears right at market close?"
Don't chase it. Wait for the next bar (next day) to confirm. Signals that appear in the last 5 minutes are often noise.
"How do I set up alerts?"
Right-click on the chart
Select "Add Alert"
Choose "LazyEMA" from the condition dropdown
Select which signal you want alerts for:
Entry 1: 3→5 Reclaim
Entry 2: 21 EMA Add
Entry 3: 34 EMA Breakout
Exit 1: 89 EMA Break
Exit 2: 144 EMA Break
Click "Create"
Pro tip: Set up all 5 alerts so you never miss a signal.
Position Sizing Guide see
swingtradenotes.substack.com
Critical Rule: Know your total risk BEFORE you take Entry 1. Don't wing it.
Customization Tips
For Day Traders (Scalpers)
Use 5min or 15min charts
Hyper frame: 1H or 4H
Expect 2-4 setups per day
Tighter stops (0.5% risk per entry)
For Swing Traders
Use 4H or Daily charts
Hyper frame: Daily or Weekly
Expect 1-2 setups per week
Wider stops (1-2% risk per entry)
For Position Traders
Use Daily or Weekly charts
Hyper frame: Weekly or Monthly
Expect 1-2 setups per month
Widest stops (2-3% risk per entry)
The "Don't Be Stupid" Checklist
Before taking ANY signal from this script, ask:
✅ Is the hyper frame bias pointing in my direction?
✅ Is the signal clean (not at a weird time or during news)?
✅ Do I know my stop loss level?
✅ Do I know my position size?
✅ Can I afford to lose if this trade fails?
If you answered "no" to ANY of these, skip the trade.
Troubleshooting
"I'm not seeing any signals"
Possible causes:
The "Show Lazy Trader System" toggle is off (turn it on)
Your chart timeframe is too high (try 1H or 4H)
Market is in a tight range (EMAs are compressed)
You need to refresh the chart
"Too many signals, getting whipsawed"
Fixes:
Increase your chart timeframe (go from 15m to 1H)
Switch to a less volatile ticker
Only trade when hyper frame bias is STRONG (not neutral)
Add a minimum bar count between signals
"The info table is covering my price action"
Fix:
Edit the script
Find the line: table.new(position.top_right, ...
Change position.top_right to position.bottom_right or position.top_left
"Signals appear then disappear"
This is normal (repainting). Some signals (especially compression breakouts) can disappear if the next bar reverses. This is why you:
Wait for bar close before acting
Use alerts that only fire on confirmed bars
Don't chase signals mid-bar
Final Thoughts
This script is a decision-making tool, not a crystal ball. It shows you high-probability setups based on EMA dynamics and trend structure. You still need to:
Manage your risk
Choose your position size
Stick to the rules
Accept losses when they happen
The system works when YOU work the system.
Print this guide, tape it next to your monitor, and follow it religiously for 20 trades before making ANY changes.
Good luck, and stay lazy (the smart way).
