指標和策略

Advanced custom multi MA signals (EMA/SMA/VWMA/VWAP) Features of Multi Moving Averages
The biggest enemy in trading is "Noise." If you get swayed by minute fluctuations on the chart, you end up missing the forest for the trees.
This indicator (Advanced Custom Multi MA Signals) is not just a simple line. By combining the three core elements of Price, Time, and Volume, it acts as a navigation system that visualizes the market's "true trend." In particular, the ability to analyze 5 moving averages simultaneously across various timeframes is akin to viewing a 3D map of the battlefield.
Understanding Core Concepts
This indicator supports 4 types of moving averages. It is crucial to clearly understand the nature of each tool.
SMA (Simple Moving Average): The most basic average value. Since it produces fewer whipsaws (false signals), it is used as a baseline to judge the "long-term trend."
EMA (Exponential Moving Average): Places more weight on recent prices. It reacts sensitively to market changes, making it advantageous for identifying "entry points."
VWMA (Volume Weighted Moving Average): Incorporates "volume" into the price calculation. It acts as a "false signal filter," weeding out price moves that aren't backed by trading volume.
VWAP (Volume Weighted Average Price): The benchmark price used by institutional investors for daily trading. It is calculated based on the session, regardless of the period settings. It is considered the "lifeline" of day trading.
Indicator Settings Guide
Open the settings window and tune it to fit your trading style.
MA 01 ~ 05 (Moving Average Settings)
MA Type: Select according to your purpose. (Generally, EMA is recommended for short-term analysis, SMA/VWMA for long-term).
Length: Enter the period you wish to analyze (e.g., 20, 60, 120, 200).
Timeframe: This is the core feature. It allows you to overlay moving averages from a higher timeframe (e.g., 4-hour, Daily) onto the chart you are currently viewing (e.g., 15-minute).
Signal Option (Trading Signals)
Golden Cross (GC) / Death Cross (DC): Captures the moment the short-term line breaks through the long-term line. You can run up to 3 strategies simultaneously.
Ribbon Gradient (Trend Visualization)
Represents the gap between two moving averages with color. As the color deepens and the width expands, it indicates a powerful trend; if the width narrows, it suggests a high probability of a trend reversal.
5 Usage Strategies
The highlight of this indicator is the cross strategy utilizing the "Multi-Timeframe (MTF)" feature. Familiarize yourself with the 5 example strategies below and set up your own strategy based on your expertise.
💡 Tip 1. Do not go against the "Major Trend" (The Authority of the Weekly Candle)
Settings: Set MA5 to .
Interpretation: The Weekly 50 line is the "major trend line" managed by institutions and market makers. If the current price is above this line, maintain only a "Buy (Long)" bias; if below, maintain only a "Sell (Short)" bias. Adhering to this rule alone can help you avoid massive losses.
💡 Tip 2. Highly Reliable "Swing Signal" (Daily Golden Cross)
Settings: In Signal 1, configure the Short MA to and the Long MA to .
Interpretation: A Golden Cross where the 4-Hour 50 EMA breaks above the Daily 50 EMA often signifies a major "trend reversal" rather than a temporary rebound. This provides an ideal entry signal for office workers or swing traders who need high reliability.
💡 Tip 3. 4-Hour Candle as the Standard for "Precision Entry"
Situation: When the Daily trend is rising (Bullish alignment).
Strategy: While watching the 15-minute or 1-hour chart, set the indicator's Signal 2 to the cross of and .
Interpretation: When the Daily chart is in an uptrend, a Golden Cross occurring on the 4-Hour chart marks "the point where a correction (pullback) ends and the rise resumes." This is the entry point with the best risk-to-reward ratio.
💡 Tip 4. Filtering Out "Fake Signals" (The Secret of Volume)
Strategy: When creating a cross signal, try using VWMA (Volume Weighted) for the Long MA, even if you use EMA for the Short MA.
Reason: A Golden Cross caused simply by a rise in price can be a trap. However, if it breaks through the heavy VWMA line accompanied by volume, it is strong evidence that "genuine liquidity" has entered.
💡 Tip 5. Remember the "Hierarchy" (Higher Timeframe Priority Rule)
Principle: If a Golden Cross (Buy Signal) appears on the 4-Hour chart, but the Daily chart is in a Death Cross (Sell Signal) state, do not enter.
Interpretation: A signal from a lower timeframe cannot overcome the power of a higher timeframe. The professional approach is to trade with significant volume only when signals align (Sync) in the order of Weekly > Daily > 4-Hour. Keep this indicator's dashboard feature on and always check the status of higher timeframes.
Signal Generation Principle (Operating Mechanism)
Signals are generated when the set short-term moving average and long-term moving average cross each other.
📈 1. Golden Cross (BUY = Buy Signal)
Situation: The moment the short-term MA crosses upward from below the long-term MA.
Principle: It implies that recent buying pressure has broken through the resistance level accumulated over a long period.
📉 2. Death Cross (SELL = Sell Signal)
Situation: The moment the short-term MA crosses downward from above the long-term MA.
Principle: It implies that recent selling pressure has collapsed the long-term support line.
※ If the candles are not displaying correctly or are flickering, please set the indicator's 'Visual order' to 'Bring to front' as shown in the image below.
Investment Caution and Disclaimer
Before using this indicator for actual trading, please strictly read the contents below.
① Auxiliary indicators are a "Compass," not a "Book of Prophecy."
This indicator is merely a tool that mathematically calculates and visualizes past price data. A "magic indicator" that predicts future price fluctuations 100% accurately or guarantees profit does not exist. The signals provided are for reference only and must never be the sole basis for entry/exit decisions.
② The responsibility for all investments lies with "Yourself."
Financial investment (Cryptocurrencies, Stocks, Futures, etc.) involves high volatility and is a risky activity that can result in the loss of some or all of the principal. The final responsibility for all trading results (profits and losses) incurred by utilizing this indicator lies entirely with the investor. The distributor and developer accept no legal responsibility for investment results under any circumstances.
③ Past data does not guarantee the future.
Even a Golden Cross that fit perfectly in backtesting or past charts may operate differently in tomorrow's market situation (News, Macroeconomics, Unexpected Variables, etc.). Do not rely solely on technical analysis; you must conduct fundamental analysis and risk management in parallel.
④ Risk management is the top priority.
No matter how promising a signal appears, "all-in trading" (investing all assets in a single trade) is a shortcut to bankruptcy. More important than the indicator itself is adhering to the principles of strict scaling in (split buying) and Stop-Loss.

Zone Eleven HTF Gate SweepThis indicator is designed as a simple visual framework rather than a rigid signal system. It highlights time-based structure and key alignment zones to help identify when price behavior is more likely to be active or responsive. The logic is intentionally flexible, allowing the user to apply their own discretion instead of relying on strict conditions. Its primary value is visual clarity and context, not automatic entries or exits.

Goldbach Timing Model This indicator is designed as a simple visual framework rather than a rigid signal system. It highlights time-based structure and key alignment zones to help identify when price behavior is more likely to be active or responsive. The logic is intentionally flexible, allowing the user to apply their own discretion instead of relying on strict conditions. Its primary value is visual clarity and context, not automatic entries or exits.


krishnadeshmukh/NIFTY50 Micro Sentiment Part 1📘 Script Description: NIFTY50 Micro Sentiment — Part 1
This indicator tracks real-time micro sentiment across the top 25 weighted stocks of the NIFTY50 index using a volume-based distribution model.
🔍 How it works:
Scans last N bars (configurable) for each stock.
Divides each stock’s price range into equal bins.
Measures bullish vs bearish volume in each bin based on:
Candle Color (Close > Open) or
Close Near High (Close > Midpoint).
Assigns a sentiment value:
+1 → Bullish dominance
-1 → Bearish dominance
0 → Neutral
📊 Each stock's sentiment is weighted by its contribution to the index.
🧮 Displays:
Weighted Sentiment Score
Bullish / Bearish / Neutral Components
Updated every 5 bars with an easy-to-read table.
Use this to gauge underlying micro shifts in sentiment before broader market moves.
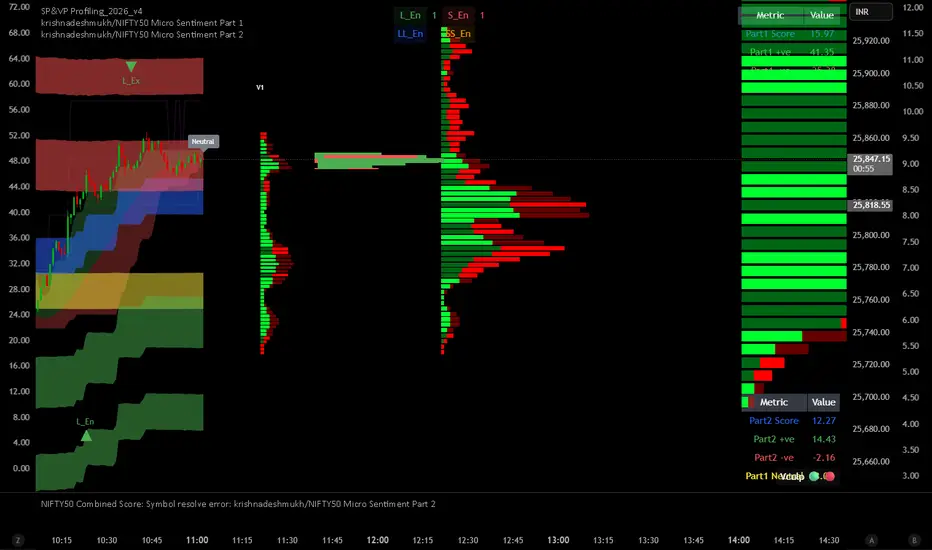
krishnadeshmukh/NIFTY50 Micro Sentiment Part 2📘 Script Description: NIFTY50 Micro Sentiment — Part 2
This indicator continues the NIFTY50 Micro Sentiment model by analyzing the remaining 25 stocks (Rank 26–50 by index weight) of the NIFTY50.
🔍 Key Features:
Applies the same volume-bin methodology used in Part 1.
Sentiment detection based on:
Candle Color (default) or
*Close vs Midpoint of the candle range.
Stocks are weighted by their index influence.
Output is a clean sentiment table:
+ve / -ve / Neutral Volume Score
Weighted Sentiment Output
Use this in conjunction with Part 1 to analyze the entire NIFTY50 sentiment landscape.
📘 Script Description: NIFTY50 Combined Score
This script aggregates live sentiment data from both:
🧩 NIFTY50 Micro Sentiment — Part 1
🧩 NIFTY50 Micro Sentiment — Part 2
🚀 What it does:
Imports Score, +ve, -ve, and Neutral components from both scripts.
Combines them to produce:
✅ Total Weighted Sentiment
🟢 Bullish Weight
🔴 Bearish Weight
🟡 Neutral Component
📊 Outputs are shown via a middle-right sentiment table, updated every 5 bars.
Perfect for traders seeking a unified view of micro sentiment across the entire NIFTY50 ecosystem — in one glance.

MTF Bollinger Bands (2SD & 3SD)
개요
1분봉이나 5분봉 등 하위 타임프레임에서 스캘핑을 할 때, 차트를 변경하지 않고 상위 타임프레임(기본 4시간)의 볼린저 밴드 위치를 확인하기 위해 제작했습니다.
주요 기능
MTF (Multi-Timeframe): 현재 보고 있는 차트와 상관없이 설정한 타임프레임의 볼린저 밴드를 표시합니다. (기본값: 4시간)
듀얼 밴드 시각화 (Dual Zone): 표준편차 2(2SD)와 표준편차 3(3SD)을 동시에 계산합니다.
2SD 영역: 2SD와 3SD의 배경색이 겹치도록 설계하여, 중심부(2SD)가 시각적으로 더 진하게 보입니다. 이는 주요 지지/저항 구간을 직관적으로 보여줍니다.
3SD 영역: 외곽은 연하게 표시되어 과매수/과매도 구간을 식별하기 좋습니다.
끊김 없는 라인: gaps_off 처리를 통해 타임프레임 변경 시 선이 끊기지 않고 부드럽게 연결됩니다.
설정 가이드
Timeframe: 기준이 될 상위 시간대를 선택하세요. (기본: 240분/4시간)
Multiplier: 표준편차 배수를 변경할 수 있습니다. (기본: 2.0 / 3.0)
Transparency: 배경 투명도를 조절해 밴드의 진하기를 변경하세요.
==========================================
Overview
Designed for traders who need to monitor Higher Timeframe (HTF) volatility while scalping on Lower Timeframes (LTF). This indicator overlays HTF Bollinger Bands on your current chart without the need to switch tabs.
Key Features
MTF Capability: Displays Bollinger Bands from any user-defined timeframe. (Default: 4 Hours).
Dual Zone Visualization: Plots both 2 Standard Deviations (2SD) and 3 Standard Deviations (3SD).
Visual Depth: The script utilizes an overlapping fill method. The inner 2SD band appears darker as it layers on top of the 3SD background, clearly highlighting the primary support/resistance zone.
Extreme Zones: The outer 3SD band remains lighter, indicating extreme overbought/oversold conditions.
Seamless Plotting: Uses gaps_off to ensure lines remain continuous across different timeframes.
Settings
Timeframe: Select the target HTF. (Default: 240 / 4H)
Multiplier: Adjust the standard deviation multipliers. (Default: 2.0 & 3.0)
Style: Customize colors and transparency to fit your chart theme.

S&R Zones + Signals V6.4 (Rejection & Break)This indicator is to trigger once the Candle go into the Zone, get rejection and Break

avax by dionfor adding liquidity for view the trend then avax foundation adding liquidity whats the price action

Triple Supertrend + EMA CrossoverCustomized 3 supertrend and EMA crossover which is helpful for identification of the trend.

Supertrend + EMA + RSI Algo (Low Risk High Accuracy)This is a trend-following + momentum confirmation strategy designed to reduce false signals and control loss.
Supertrend (10,3) → Identifies overall market direction (Buy in uptrend, Sell in downtrend)
EMA 50 & EMA 200 → Confirms strong trend and avoids sideways market
Buy only when EMA 50 is above EMA 200
Sell only when EMA 50 is below EMA 200
RSI (14) → Confirms momentum
Buy when RSI > 55 (strong bullish momentum)
Sell when RSI < 45 (strong bearish momentum)
---
🔹 Entry Logic
BUY: Market is in uptrend + strong momentum
SELL: Market is in downtrend + strong bearish pressure
---
🔹 Risk Management (Most Important)
Stop Loss: Based on ATR (adapts to volatility)
Target: Fixed Risk-Reward ratio (example: 1 : 2.5)
This keeps loss small and profits larger
---
🔹 Best Use Case
Works best in trending markets
Ideal timeframes: 15m, 1h, 4h
Suitable for crypto futures & swing trading
Beginner-friendly if used with low leverage

High Volume Breakout DetectorThis indicator is a dedicated volume analysis tool displayed in a separate pane below the price chart. It visually highlights significant volume surges (spikes) by comparing the current bar's volume to a dynamic threshold based on a Simple Moving Average (SMA) of volume.
Key Concepts and Methodology:
- The core calculation uses a user-configurable Simple Moving Average (default: 20 periods) of historical volume to establish a baseline of "normal" trading activity.
- A customizable multiplier (default: 1.50, meaning 150% of the SMA) defines the threshold for a volume spike. When the current bar's volume meets or exceeds this threshold, it is classified as a spike—indicating unusually high participation that often accompanies breakouts, reversals, climaxes, or institutional activity.
- Volume bars are plotted as columns and colored based on two factors:
- Candle direction: Green shades for bullish candles (close ≥ open), red shades for bearish candles (close < open).
- Spike status: Brighter/solid colors for confirmed spikes, muted/translucent colors for normal volume. This candle-matched coloring helps traders quickly assess whether the surge supports buying pressure (green spike on up candle) or selling/distribution (red spike on down candle).
- Optional overlays include the volume SMA line (blue) and the dynamic threshold line (orange, plotted as circles for easy distinction).
Features and Customization:
- Fully adjustable inputs: SMA length, multiplier threshold, colors for up/down/normal/spike bars, and toggles for showing the SMA line, threshold line, or background highlighting on spikes.
- Built-in alert condition triggers reliably on volume spikes (≥ selected multiplier of SMA), with a constant message string including ticker, timeframe, volume value, and threshold reference.
How to Use:
- Add to any chart in a separate pane (overlay=false).
- Look for brighter colored volume bars as potential signals of conviction in price moves. For example:
- Green spikes on up candles may signal strong accumulation or breakout confirmation.
- Red spikes on down candles may indicate distribution or exhaustion selling.
- Combine with price action, support/resistance, or trend indicators for confluence.
- Ideal for day trading, swing trading, or spotting volume climaxes on stocks, forex, crypto, or futures across any timeframe.
The unique combination of candle-direction-matched coloring for spikes, visual threshold plotting, and focused spike highlighting provides clearer, more actionable insight into directional volume pressure compared to standard volume displays.

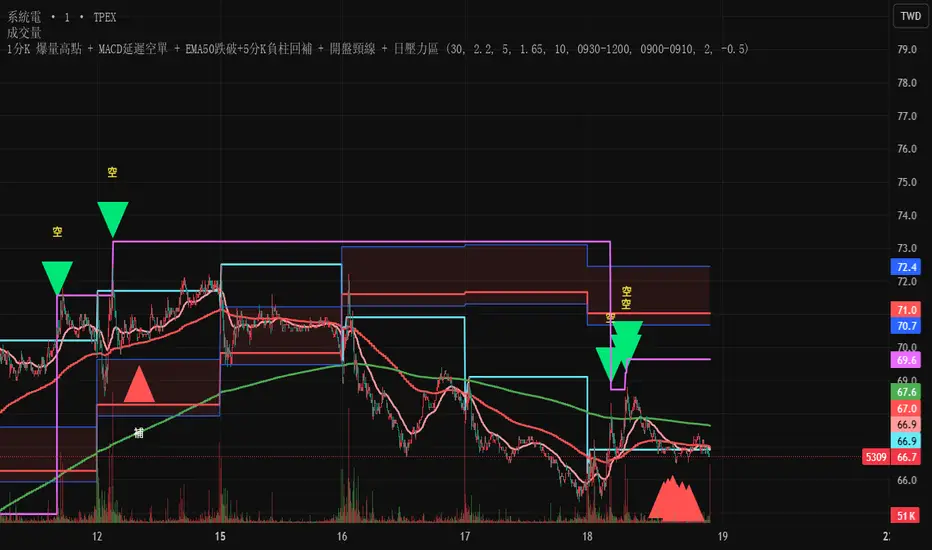
Test此指標為測試階段
最近手法改變,高點出現率後移,
此指標為爆量後跌破12ema才放空,
由於操盤手還是可以騙線,故時間設定為10:00之後成功率比較大
This indicator is in the testing phase.
Recently, the method has changed, and the occurrence rate of high points has shifted later.
This indicator only calls for shorting after a surge in volume followed by a drop below the 12-day moving average (EMA).
Because traders can still create false signals, setting the time after 10:00 AM increases the success rate.
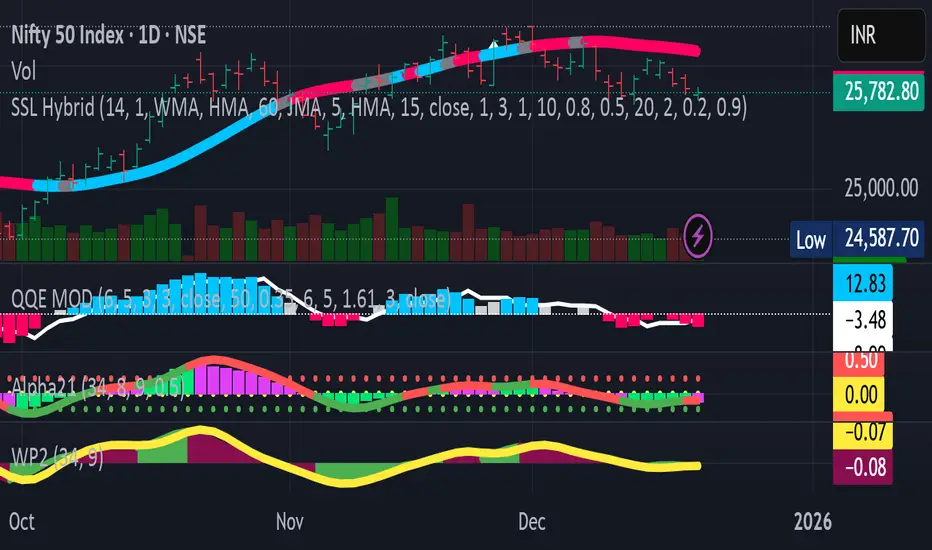
MTF rsi/stoch imdI just built this indicator.
It displays a multi-timeframe (MTF) table directly on the chart, showing Stoch RSI K and RSI values per timeframe.
Cell background colors are driven by predefined value ranges, while text color turns green or red depending on whether the value is rising or falling compared to the previous candle on the same timeframe.
The RSI color conditions are based on the levels 36, 46, 56, and 65.
The Timeframe Pack selector works as follows:
Pack 1 (BNC): 3m, 9m, 27m, 1h, 81m, 3h, 9h, 12h, 1D, 3D, 1W, 9D
Pack 2: 1h through 24h
Pack 3: 1D through 24D
Pack 4 (Custom): fully user-defined timeframes via the 24 slots
Only when Pack 4 (Custom) is selected do the custom timeframe slots apply; in Packs 1–3 they are ignored.
All visual behavior (box colors, text colors, transparency, or a single-color override) is configurable under Style, and the entire table can be toggled on or off.

EMA12/50 如果放空後趨勢由背景紅轉綠可以考慮常抱
抱到背景再次翻紅而比較不被雜訊洗掉
現階段指標合併在一起會出BUG
If the trend changes from red to green after shorting, consider holding for a longer period.
Hold until the background turns red again to avoid being washed out by noise.
Currently, merging them together will cause bugs.

Custom ORB (Adjustable Time + Alerts)Opening range Breakout for the current day only. Time frame and be adjusted for first 15 min, 30 min, e.g., 9:30 am to 9:45 am or to 10 am, etc. You can add price alerts for high and low. You can also change the color of solid lines.

Adaptive Trend-Based Fib Extension + TrendlinesThis advanced analysis tool is designed to take the guesswork out of Fibonacci trading. By combining Adaptive Fibonacci Extensions with multi-method Pivot Detection, Dynamic Trendlines, and Horizontal Support/Resistance, this indicator provides a comprehensive roadmap for any market trend.
Learn volume trading - @pricevolumetraders
Key Features
Adaptive Fibonacci Engine: Unlike static tools, this indicator uses an ATR-based adaptive factor to adjust extension levels according to current market volatility.
Smart Trend Detection: Automatically identifies trend direction using EMA cross-overs or Higher High/Higher Low sequences to determine whether to plot Bullish or Bearish extensions.
Multi-Method Pivots: Choose from six different pivot detection methods, including Volume-Based, Fractal, ATR-Based, and Long Wick detection, to suit your specific trading style.
Automated Trendlines & S/R: High-probability diagonal trendlines and horizontal S/R levels are drawn only when they meet a minimum "touch" requirement and volume confirmation.
Institutional Zones: Highlights the "Golden Zone" between the 127.2% and 161.8% extension levels, where trends often reach exhaustion or find major targets.
How to Use
Trend Alignment: Use the built-in Dashboard to quickly identify the current trend (Bull/Bear) and RSI momentum.
The 3-Point Setup: The indicator automatically finds Point 1 (Trend Start), Point 2 (Impulse End), and Point 3 (Retracement/Last Touch) to project future price targets.
Entry Confirmation: Look for price action near the 61.8% or 78.6% Retracement levels for high-probability entries in the direction of the trend.
Targeting: Use the extension levels (100%, 127.2%, 161.8%) as your primary Take Profit zones.
Confluence: The strongest setups occur when a Fibonacci level aligns perfectly with a Horizontal S/R line or a Diagonal Trendline.
Technical Settings
Pivot Settings: Adjust 'Left' and 'Right' bars to change the sensitivity of swing high/low detection.
Fib Timeframe: You can anchor Fibonacci levels to a higher timeframe (e.g., 1-hour levels) while trading on a lower timeframe (e.g., 5-minute).
Volume Multiplier: Filter for horizontal levels that were formed with significant institutional volume.
Disclaimer: Trading involves significant risk. This tool is for educational and analytical purposes only and should be used in conjunction with a complete trading plan.

First Presented FVGSummary: First Presented FVG Indicator
This is a Pine Script v6 TradingView indicator that identifies and visualizes the first Fair Value Gap (FVG) that forms within configurable time windows during a trading session.
What it Does
1. Detects FVGs : Uses the classic 3-candle FVG definition:
- Bullish FVG: When low > high (gap up)
- Bearish FVG: When high < low (gap down)
2. "First Presented" Logic : For each configured time slot, it captures only the first qualifying FVG that forms—subsequent FVGs in that window are ignored.
3. Visual Display :
- Draws a colored box spanning from detection time to session end
- Optional text label showing detection time (e.g., "9:38 Tue FP FVG")
- Optional grade lines at 25%, 50%, and 75% levels within the FVG
Key Configuration
Setting Description
Timeframe Only works on 5-minute charts or lower
Timezone IANA timezone for session times (default: America/New_York)
Session Futures trading hours (default: 1800-1715)
Min FVG Size Minimum gap size in ticks to qualify
4 Time Slots Each with enable toggle, time window, and color
Default Time Slots
Slot 1 (enabled): 09:30-10:30 — lime green
Slot 2 (enabled): 13:30-14:30 — blue
Slot 3 (disabled): 13:00-13:30 — teal
Slot 4 (disabled): 14:15-14:45 — fuchsia
Technical Features
Handles cross-midnight sessions correctly
Resets all drawings at each new session
Skips the first bar of each window to ensure valid 3-candle lookback
Clamps slot windows to session boundaries

10>20,p>50 DEMARenders daily EMA, 10, 20 and 50 on any timeframe below 1D
30m timeframe works well.
Use trend of 10 > 20 + price > 50 for long and 10 < 20 + price < 50 for shorts or exits.

GME Warrant Tracker [theUltimator5]The GME Warrant Tracker was designed to be used for GME warrants tracking. The theory behind this indicator is that warrants are priced similarly to options and generally follow the same Greeks. With that assumption, we can break down the price of the warrants by using known Greeks to estimate either the theoretical price, or even estimate Implied Volatility (IV).
The base settings for this indicator plot the calculated IV, the theoretical price (there are multiple methods of calculation which I will discuss later) and the current warrant price.
You can toggle on or off all of these plots to display only what you want to track.
For example, you can simply track the difference between the theoretical price and the current price to see if warrants are trading at a premium or a discount vs what the indicator calculates it to be.
Calculating implied volatility is extremely difficult and must be approximated.
The theoretical warrant price produced by this indicator depends primarily on the volatility input (σ) used in the Black–Scholes pricing model.
This script supports five distinct methods for approximating σ, each extracting different information from the market.
1) Close-to-Close Historical Volatility
Close-to-Close computes the standard deviation of daily close-to-close returns and uses a lookback window scaled to time-to-expiry. As the expiration approaches, the lookback window tightens, giving a more responsive volatility approximation relative to time-to-expiry.
This option produces conservative approximations for volatility, and may lag actual volatility intraday.
2) Parkinson High-Low Volatility
Parkinson High-Low volatility uses daily high and low prices to calculate intraday trading range for a more responsive estimation to volatility. It ignores opening and close gaps, so overnight volatility is not accounted for.
This option produces higher theoretical volatility during choppy price action and can over estimate actual volatility.
3) Garman–Klass Volatility
Garman–Klass volatility is a way to estimate how much price is fluctuating by using the open, high, low, and close for each period. Because it draws on multiple intraperiod price points (not just the range or close-to-close moves), it typically produces a tighter, more informative volatility estimate than simpler approaches. It’s often most helpful when gaps occur and when the open and close carry meaningful information about the session’s trading.
4)Yang–Zhang Volatility
The Yang–Zhang volatility estimator is designed to account for both opening jumps and price drift. It estimates volatility by combining overnight (close-to-open) variance, intraday (open-to-close) variance, and a weighted Rogers–Satchell component using OHLC data, often yielding a more robust measure than simpler close-to-close style estimators.
5) Option price
By default, the indicator uses the call option strike dated closest to the warrant expiration date. Since the Greeks for both the warrants and the
options are assumed to be equivalent with a minor difference in theta (time-to-expiry), the theoretical price of the warrants closely matches the trade price of the call strike chosen.
There is a table that can be enabled (off by default because it is large and fills entire screen on mobile) which shows all the configuration settings and Greeks.
You can also manually adjust the "dilution" factor for the warrants, which shifts the number of active warrants and moves the count into the shares outstanding for the underlying (GME). The reason for this is that as warrants get exercised, the total quantity of warrants in circulation decreases and the the total quantity of shares outstanding increases.
Since this indicator was built around the single warrant, ticker NYSE: GME/W, it is only meant to be used with NYSE:GME. Any other ticker will not work properly with this indicator.
