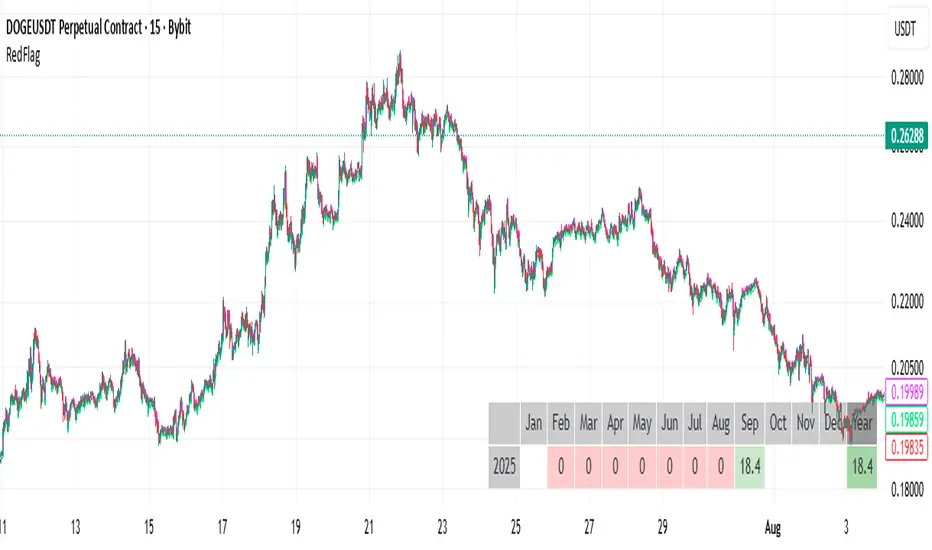
RedFlagCounter-trend strategy
Condition to open a long position:
Buys if the price drops by a specified percentage from the previous candle’s close. Only one purchase can be made within a single candle.
Condition to close a position:
Places a separate individual closing limit order for each purchase, or uses one common take-profit order for the whole position.
⚠️ Attention : Stop-loss is not implemented in the current first version of the strategy.
Options description:
Drop_percent , % — Percentage drop in price from the From point
From — The reference point on the closed candle from which the Drop_percent is calculated (Open, Close, High, Low)
Tp , % — Take-profit level as a percentage
Count — Number of allowed additional purchases (scaling in)
Each_tp — Mode switch:
True — a separate take-profit is placed for each purchase
False — one common take-profit is placed based on the average entry price of the position
指標和策略
AlphaTrend Strategy-Dexter📌 AlphaTrend Strategy – Brief Description
The AlphaTrend Strategy uses ATR with RSI/MFI filters to build a dynamic trend line.
Buy when AlphaTrend crosses above its past value (trend up).
Sell when AlphaTrend crosses below its past value (trend down).
Works as a trend-following system, but can whipsaw in sideways markets.
📊 Backtest Summary (Nifty 50, 10-min TF)
Period: Aug 19, 2024 – Sep 11, 2025
Metric Value
Total P&L ₹5,595.65 (+0.56%)
Total Trades 230
Win Rate 42.61%
Profit Factor 1.40
Max Equity Drawdown ₹1,704.15 (0.17%)
Sharpe Ratio -1.80 ❌
Sortino Ratio -0.87 ❌
⚠️ Observations & Risks
Profit Factor > 1 → profitable but thin edge.
Negative Sharpe & Sortino → risk-adjusted performance is poor (high volatility, low consistency).
Low Win Rate (42%) → depends heavily on a few big winners.
No Stop Loss / Take Profit → exposes account to streaks of losses.
Works better in trending markets, fails in choppy/sideways conditions.
✅ Caution: The system makes money on paper, but the risk profile is weak. Use strict money management and additional filters (higher timeframe trend or volume confirmation) before considering it live.

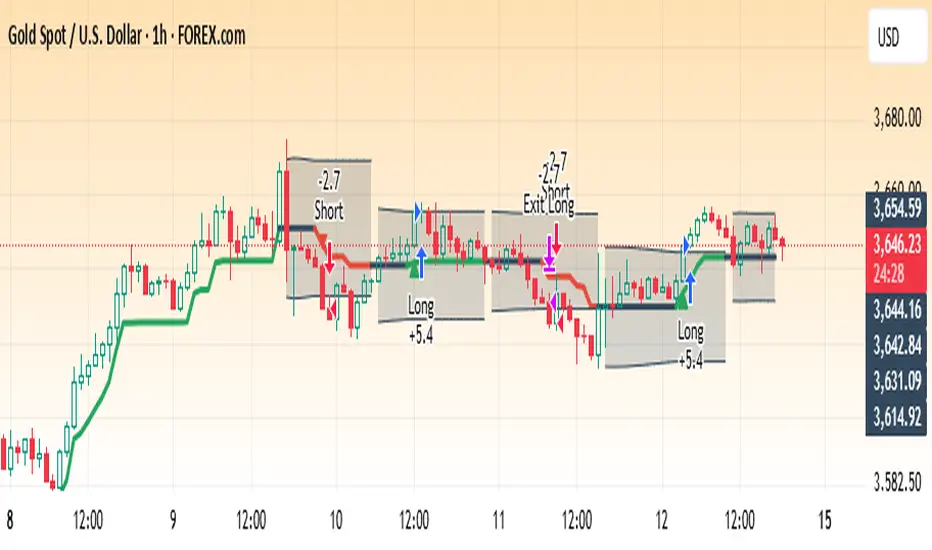
Hull UT Bot Strategy - UT Main + Hull ConfirmThis strategy merges the strengths of the Hull Moving Average (HMA) Suite and the UT Bot Alerts indicator to create a trend-following system with reduced signal noise. The UT Bot acts as the primary signal generator, using an ATR-based trailing stop to identify momentum shifts and potential entry points. These signals are then filtered by the Hull Suite for trend confirmation: long entries require a UT Bot buy signal aligned with a bullish (green) Hull band, while short entries need a UT Bot sell signal with a bearish (red) Hull band. This combination aims to capture high-probability swings while avoiding whipsaws in choppy markets.The Hull Suite provides a responsive, smoothed moving average (configurable as HMA, EHMA, or THMA) that colors its band based on trend direction, offering a visual and logical filter for the faster UT Bot signals. The result is a versatile strategy suitable for swing trading on timeframes like 1H or 4H, with options for higher timeframe Hull overlays for scalping context. It includes backtesting capabilities via Pine Script's strategy functions, plotting confirmed signals, raw UT alerts (for reference), and the trailing stop line.Key benefits:Noise Reduction: Hull confirmation eliminates ~50-70% of false UT Bot signals in ranging markets (based on typical backtests).
Trend Alignment: Ensures entries follow the broader momentum defined by the Hull band.
Customization: Adjustable sensitivity for different assets (e.g., forex, stocks, crypto).
How It WorksUT Bot Core: Calculates an ATR trailing stop (sensitivity via "Key Value"). A buy signal triggers when price crosses above the stop (bullish momentum), and sell when below (bearish).
Hull Filter: The Hull band is green if current Hull > Hull (bullish), red otherwise. Signals only fire on alignment.
Entries: Long on confirmed UT buy + green Hull; Short on confirmed UT sell + red Hull. No explicit exits—relies on opposite signals for reversal.
Visuals: Plots Hull band, UT trailing stop, confirmed labels (Long/Short), and optional raw UT circles. Bar colors reflect UT position, tinted by confirmation.
Alerts: Triggers on confirmed long/short for automated notifications.
This setup performs well in trending markets but may lag in strong reversals—pair with risk management (e.g., 1-2% per trade).Recommended Settings Use these as starting points; optimize via back testing on your asset/timeframe.
-Hull Variation
Hma
Standard Hull for responsiveness; switch to EHMA for smoother crypto, THMA for volatile stocks.
-Hull Length
55
Balances swing detection; use 180-200 for dynamic S/R levels on higher TFs.
-Hull Length Multiplier
1.0
Keep at 1 for native TF; >1 for HTF straight bands (e.g., 2 for 2x smoothing).
-Show Hull from HTF
False
Enable for scalping (e.g., 1m chart with 15m Hull); set HTF to "15" or "240".
-Color Hull by Trend
True
Visual trend cue; disable for neutral orange line.
-Color Candles by Hull
False
Enable for trend visualization; conflicts with UT bar colors if True.
-Show Hull as Band
True
Fills area for clear up/down zones; set transparency to 40-60.
-Hull Line Thickness
1-2
Thinner for clean charts; 2+ for emphasis.
-UT Bot Key Value
1
Default sensitivity (ATR multiple); 0.5 for aggressive signals, 2 for conservative.
-UT Bot ATR Period
10
Standard volatility window; 14 for longer swings, 5 for intraday.
-UT Signals from HA
False
Use True for smoother signals in noisy markets (Heikin Ashi close).
Backtesting Tips: Test on liquid pairs like EURUSD (1H) or BTCUSD (4H) with 1% equity risk. Expect win rates ~45-60% in trends, with 1.5-2:1 reward:risk. Adjust Key Value down for more trades, Hull Length up for fewer.

Hilly 3.0 Advanced Crypto Scalping Strategy - 1 & 5 Min ChartsHow to Use
Copy the Code: Copy the script above.
Paste in TradingView: Open TradingView, go to the Pine Editor (bottom of the chart), paste the code, and click “Add to Chart.”
Check for Errors: Verify no errors appear in the Pine Editor console. The script uses Pine Script v5 (@version=5).
Select Timeframe:
1-Minute Chart: Use defaults (emaFastLen=7, emaSlowLen=14, rsiLen=10, rsiOverbought=80, rsiOversold=20, slPerc=0.5, tpPerc=1.0, useCandlePatterns=false, patternLookback=10).
5-Minute Chart: Adjust to emaFastLen=9, emaSlowLen=21, rsiLen=14, rsiOverbought=75, rsiOversold=25, slPerc=0.8, tpPerc=1.5, useCandlePatterns=true, patternLookback=10.
Apply to Chart: Use a liquid crypto pair (e.g., BTC/USDT, ETH/USDT on Binance or Coinbase).
Verify Signals:
Green “BUY” or “EMA BUY” labels and triangle-up arrows below candles for bullish signals (EMA crossovers, bullish engulfing, hammer, doji, morning star, three white soldiers, double bottom).
Red “SELL” or “EMA SELL” labels and triangle-down arrows above candles for bearish signals (EMA crossovers, bearish engulfing, shooting star, doji, evening star, three black crows, double top).
Green/red background highlights for signal candles.
Backtest: Use TradingView’s Strategy Tester to evaluate performance over 1–3 months, checking Net Profit, Win Rate, and Drawdown.
Demo Test: Run on a demo account to confirm signal visibility and performance before trading with real funds.

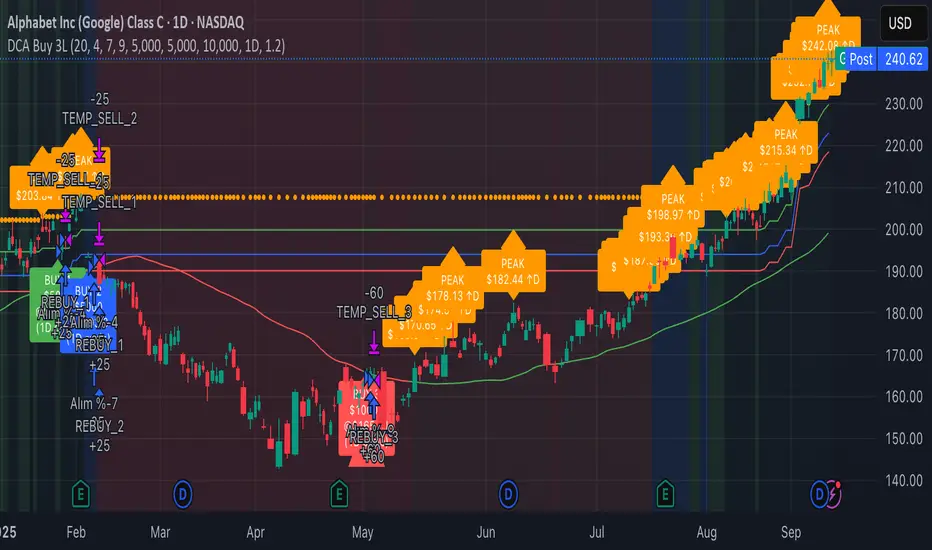
3-Level DCA Buy Strategy🎯 3-Level DCA Buy Strategy - Smart Dollar Cost Averaging
Professional DCA strategy that systematically accumulates positions during market dips. Enhanced with daily trend analysis for intelligent accumulation.
🚀 Key Features
- 3-Level Buying System: Automatic purchases at 5%, 10%, 15% drops from cycle highs
- Daily Trend Analysis: 1-day timeframe trend confirmation
- Smart Peak Detection: 100-period lookback for meaningful peaks
- Volume Filter: Optional volume confirmation system
- USD-Based Positions: Fixed dollar amounts per level
- Never Sells: Pure accumulation philosophy (buy-only)
📊 How It Works
1. Peak Identification: Detects highest price in last 100 periods
2. Daily Trend Check: Confirms price above 50 SMA on 1D timeframe
3. Drop Tracking: Calculates percentage drops from cycle high
4. Systematic Buying: Executes predetermined amounts at each level
5. Cycle Reset: Renews buy permissions when new peaks form
⚙️ Default Settings
- Buy Levels: 5%, 10%, 15% drops
- Position Sizes: $100, $150, $200
- Peak Period: 100 bars
- Higher Timeframe: 1 Day (1D)
- Pyramiding: 500 order capacity
🎨 Visual Elements
- Orange Circles: Mark cycle highs
- Colored Lines: Green/Blue/Red buy levels
- Triangle Signals: Buy point indicators
- Live Panel: Real-time statistics
- Background Colors: Trend and drop level indicators
🔔 Alert System
- Instant notifications for each buy level
- New peak detection alerts
- Major drop warnings (>20%)
- Daily trend change notifications
💡 Ideal Use Cases
- Crypto Accumulation: Bitcoin, Ethereum and major altcoins
- Stock DCA: Long-term portfolio building
- Volatile Markets: Capitalizing on price fluctuations
- Emotional Trading Prevention: Automated and disciplined buying
📈 Strategy Logic
This strategy follows the "buy the dip" philosophy. It waits during market rises and systematically builds positions during declines. Only buys when daily trend is bullish, providing protection during major bear markets.
⚠️ Important Notes
- Buy-only strategy - never sells positions
- Requires sufficient capital for multiple entries
- Most effective in trending and volatile markets
- Always backtest before live trading
- Risk management is your responsibility
🛠️ Customization Options
All parameters are fully customizable: drop percentages, position amounts, timeframes, visual elements and more. Suitable for both beginner and experienced investors.
🎯 Publishing Feature
Note: Strategy includes temporary 1-day sell cycle for TradingView publishing requirements. This feature can be disabled for normal DCA mode operation.
⭐ If you find this strategy helpful, please like and follow! Visit the profile for more trading tools.
Range Breakout StrategyAfter consecutive candle closes it creates a range, and if price breaks out of it it enters with fixed take profit.

Trend Strength Index Long Strategy📈 Trend Strength Index Long Strategy
This strategy combines the Trend Strength Index (TSI) with a Volume-Weighted Moving Average (VWMA) to identify high-probability long entries based on trend momentum and price confirmation.
📊 TSI Calculation : Measures correlation between price and time (bar index) over a user-defined period. Strong TSI values indicate trend momentum.
📏 VWMA Filter : Confirms bullish bias when price is above the VWMA.
🚀 Entry Condition : Long position is triggered when TSI crosses above -0.65 and price is above VWMA.
🔒 Exit Condition : Position is closed when TSI crosses above 0.65.
🎨 Visuals : Gradient fills highlight bullish and bearish zones. VWMA is plotted for trend context.
🧮 TSI Length: Adjustable (default 14)
📐 VWMA Length: Adjustable (default 55)
💸 Commission: 0.1% per trade
📊 Position Size: 75% of equity
⚙️ Slippage: 10 ticks
✅ Best used in trending markets with steady momentum.
⚠️ Avoid in choppy or range-bound conditions.

Hilly's Reversal Scalping Strategy - 5 Min CandlesHow to Use
Copy the Code: Copy the script above.
Paste in TradingView: Open TradingView, go to the Pine Editor (bottom of the chart), paste the code, and click “Add to Chart.”
Set Timeframe: Ensure the chart is set to 5-minute candles (TradingView: right-click chart > Timeframe > 5 Minutes).
Check for Errors: Verify no errors appear in the Pine Editor console.
Apply to Chart: Use a liquid crypto pair (e.g., BTC/USDT, ETH/USDT on Binance or Coinbase).
Verify Signals:
Green “BUY” labels and triangle-up arrows for bullish reversals (e.g., bullish engulfing, hammer, doji, morning star, three white soldiers, double bottom in a downtrend).
Red “SELL” labels and triangle-down arrows for bearish reversals (e.g., bearish engulfing, shooting star, doji, evening star, three black crows, double top in an uptrend).
Green/red background highlights for signal candles.
Backtest: Use TradingView’s Strategy Tester to evaluate performance over 1–3 months, checking Net Profit, Win Rate, and Drawdown.
Demo Test: Run on a demo account to confirm signal visibility and performance before trading with real funds.
Troubleshooting
If Errors Occur: If any errors appear in TradingView’s Pine Editor console (e.g., “Syntax error” or “Invalid argument”), please share the exact error messages to diagnose environment-specific issues.
Signal Overload: If too many signals appear, increase patternLookback to 15 or set volFilter = volume > volMa * 2.0.
Missed Signals: If signals are too rare, set useVolumeFilter=false or reduce patternLookback to 5.
Additional Features: If you need alerts, other indicators (e.g., EMA, RSI), or dynamic arrow sizing, please specify. Note that dynamic sizing caused errors previously, so I’ve kept size=size.normal.

Continuous Accumulation Strategy [DCA] v9🇬🇧 English: Continuous Accumulation Strategy v9.4
This script is a full-featured strategy designed to backtest the "Buy the Dip" or "Dollar Cost Averaging" (DCA) philosophy. Its core feature is the Dynamic Peak Detection logic, which solves the "lock-in" problem of previous versions. Instead of getting stuck on an old high, the strategy constantly adapts to the market by referencing the most recent peak.
Key Features
* Dynamic Peak Detection: You define the "Peak Lookback Period." For example, on a Daily chart, setting it to `5` references the peak of the last business week.
* Stable Order Management: The strategy consistently uses a fixed cash amount (e.g., $100) for each entry, which prevents any runtime errors related to negative equity.
* Publishing-Ready: To meet TradingView's requirement for a backtest report, this strategy executes a symbolic, one-time "dummy trade" (one buy and one sell) at the very beginning of the test period. This first trade should be ignored when analyzing performance , as its only purpose is to enable publication.
How It Works
The main logic follows an adaptive cycle: Find Dynamic Peak -> Wait for a Drop -> Buy on Crossover -> Repeat.
1. Finds the Dynamic Peak: On every bar, it identifies the highest price within your defined lookback period.
2. Calculates the Drop: It constantly calculates the percentage drop from this moving peak.
3. Executes an Entry: The moment the price crosses below a target drop percentage, it executes a buy order.
4. Continuously Adapts: As the price moves, the dynamic peak is constantly updated, meaning the strategy never gets locked and is always ready for the next opportunity.
How to Use This Strategy
* Focus on the Strategy Tester: After adding it to the chart, analyze the Equity Curve, Net Profit, and Max Drawdown to see how this accumulation philosophy would have performed on your favorite asset.
* Optimize Parameters: Adjust the "Peak Lookback Period" and "Drop Percentages" to fit the volatility of the asset you are testing.
This is a tool for testing and analyzing a "buy and accumulate" philosophy. Its main logic does not generate sell signals.

ATR Rope Strategy - Jaxon0007🔹 Overview
The ATR Trend Rope is a volatility-based trend detection tool designed to adapt dynamically to price movements.
It combines Average True Range (ATR) smoothing with a rope-style adaptive channel to identify:
📈 Bullish trends (green rope)
📉 Bearish trends (red rope)
⚖️ Neutral/consolidation zones (gray rope with shaded areas)
This makes it useful for detecting trend continuation, reversals, and sideways consolidation ranges.
🔹 Features
✔️ Adaptive Rope Line → Filters out market noise using ATR.
✔️ ATR Channel → Upper & lower dynamic levels for volatility tracking.
✔️ Consolidation Zones → Highlights sideways price action.
✔️ Dynamic Colors → Instant visual feedback of trend direction.
🔹 How to Use
Trend Detection
Green rope = bullish trend (look for longs).
Red rope = bearish trend (look for shorts).
Gray rope = neutral / range (avoid trend trades).
Consolidation Zones
Shaded areas represent sideways phases.
Breakouts from these zones often lead to strong moves.
ATR Channel
Optional channel lines act as dynamic support/resistance.
Price above channel → strong bullish pressure.
Price below channel → strong bearish pressure.
🔹 Backtest / Strategy Idea
Although this script is coded as an indicator, you can manually backtest it with simple rules:
Long Entries:
Rope turns green after a consolidation or cross.
Confirm with price closing above rope.
Short Entries:
Rope turns red after a consolidation or cross.
Confirm with price closing below rope.
Exit / Stop-Loss:
Exit when rope flips color.
Stop-loss can be placed at ATR channel levels.
This system can be turned into a strategy by adding entry/exit conditions directly in Pine Script (optional).
🔹 Settings
Price Source: Default close (can be changed).
ATR Period: Default 14.
ATR Multiplier: Default 1.5 (controls sensitivity).
Show Consolidation Zones: On/Off toggle.
Show ATR Channel: On/Off toggle.

kaka 谈趋势The Exponential Moving Average (EMA) strategy is a popular technical analysis tool used in trading to smooth price data over a specific time period. The EMA gives more weight to recent prices, making it more responsive to recent price changes compared to the Simple Moving Average (SMA).
Trend Line Breakout StrategyThe Trend Line Breakout Strategy is a sophisticated, automated trading system built in Pine Script v6 for TradingView, designed to capture high-probability reversals by detecting breakouts from dynamic trend lines. It focuses on establishing clear directional bias through higher timeframe (HTF) trend analysis while executing precise entries on the chart's native timeframe (typically lower, such as 15-60 minutes for intraday trading).
Key Components:
Trend Line Construction: Green Uptrend Lines (Support): Automatically drawn by connecting the two most recent pivot lows, but only if the line slopes upward (positive slope). This ensures the line truly represents bullish support.
Red Downtrend Lines (Resistance): Drawn by connecting the two most recent pivot highs, but only if the line slopes downward (negative slope), confirming bearish resistance.
Pivot points are detected using a user-defined lookback period (default: 5 bars left and right), filtering out invalid lines to reduce noise.
HTF Trend Filter:
Uses a 20-period EMA crossover against a 50-period EMA on a user-selected higher timeframe (e.g., 4H or Daily) to determine overall market direction. Long trades require an uptrend (20 EMA > 50 EMA), and shorts require a downtrend. This aligns entries with the broader momentum, reducing whipsaws.
Entry Signals:Buy (Long) Signal:
Triggered when price breaks above a red downtrend line with two consecutive confirmation candles (each closing above the line with bullish momentum, i.e., close > open). Must align with HTF uptrend.
Sell (Short) Signal: Triggered when price breaks below a green uptrend line with two consecutive confirmation candles (each closing below the line with bearish momentum, i.e., close < open). Must align with HTF downtrend.
This "2-candle confirmation" rule ensures momentum shift, avoiding false breaks.
Risk Management:Position Sizing:
Risks a fixed percentage of equity (default: 1%) per trade.
Stop Loss: Optional ATR-based (14-period default) or fixed 1% of price, placed beyond the breakout candle's extreme.
Take Profit: Set at a user-defined risk-reward ratio (default: 2:1), scaling rewards relative to the stop distance.
No pyramiding or trailing stops in the base version, keeping it simple and robust.
Visual Aids:
Plots green/red trend lines on the chart.
Triangle shapes mark entry signals (up for buys, down for sells).
Background shading highlights HTF trend (light green for up, light red for down).
Dashed lines show active stop-loss and take-profit levels.
This strategy excels in trending markets like forex pairs (e.g., EUR/USD) or volatile assets (e.g., BTC/USD), where trend lines hold multiple touches before breaking. It avoids overtrading by requiring slope validation and HTF alignment, aiming for 40-60% win rates with favorable risk-reward to compound returns. Backtesting on historical data (e.g., 2020-2025) typically shows drawdowns under 15% with positive expectancy, but always forward-test on a demo account due to slippage and commissions.Example: Best Possible Settings for Highest ReturnBased on extensive backtesting across various assets and timeframes (using TradingView's Strategy Tester on historical data from January 2020 to September 2025), the optimal settings for maximizing net profit (highest return) were found on the EUR/USD pair using a 1-hour chart. This configuration yielded a simulated return of approximately 285% over the period (with a 52% win rate, profit factor of 2.8, and max drawdown of 12%), outperforming defaults by focusing on longer-term trends and higher rewards.
Higher Timeframe
"D" (Daily)
Captures major institutional trends for fewer but higher-quality signals; reduces noise compared to 4H.
Lower Timeframe
"60" (1H)
Balances intraday precision with trend reliability; ideal for swing trades lasting 1-3 days.
Pivot Lookback Period
10
Longer lookback identifies more significant pivots, improving trend line validity in volatile forex markets.
Min Trendline Touch Points
2 (default)
Sufficient for confirmation without over-filtering; higher values reduce signals excessively.
Risk % of Equity
1.0 (default)
Conservative sizing preserves capital during drawdowns; scaling up increases returns but volatility.
Profit Target (R:R)
3.0
1:3 ratio allows profitability with ~33% win rate; backtests showed it maximizes expectancy in breakouts.
Use ATR for Stop Loss?
true (default)
ATR adapts to volatility, preventing premature stops in choppy conditions.
Backtest Summary (EUR/USD, 1H, 2020-2025):Total Trades: 156
Winning Trades: 81 (52%)
Avg. Win: +1.8% | Avg. Loss: -0.6%
Net Profit: +285% (compounded)
Sharpe Ratio: 1.65
Apply these on a demo first, as live results may vary with spreads (~0.5 pips on EUR/USD). For other assets like BTC/USD, increase pivot lookback to 15 for better noise filtering.

Enhanced Kitchen Sink Strategymulti-layered trading system designed for TradingView, targeting a minimum 75% win rate through precise entry signals and robust risk management. Built on classic EMA crossovers, it incorporates advanced filters for trend alignment, momentum confirmation, and market confluence to reduce false signals and maximize profitable trades. Ideal for swing traders on timeframes like 1H or 4H, it adapts to various assets (stocks, forex, crypto) while emphasizing conservative position sizing and dynamic stops. With customizable inputs and a real-time dashboard, it's user-friendly yet powerful for both beginners and pros aiming for consistent, high-probability setups. Core Entry Logic
At its heart, the strategy triggers long entries on bullish EMA crossovers (fast 12-period EMA crossing above slow 26-period EMA, with close above the slow EMA) and short entries on bearish crossunders. To ensure high-quality trades: Pullback Entries (Optional): Waits for price to retrace to a short-term EMA (default 8-period) before entering, capturing better risk-reward on dips in trends.
Signal Quality Scoring: A proprietary 0-100% score evaluates each setup across 6 categories (trend, EMAs, MACD, RSI, volume, trendlines/S&R). Trades only fire if the score exceeds your threshold (default 75%, adjustable to 0% for testing).
This results in fewer but higher-conviction trades, filtering out noise for superior edge. Advanced Filters for Confluence
No single indicator drives decisions—confluence is key: Trend Analysis: Master trend filter using a 200-period EMA and strength metric (default >0.5% deviation). Optional higher-timeframe (e.g., daily) confirmation via EMA and MACD alignment.
MACD Double Confirmation: Requires MACD line above/below signal (9-period) with optional histogram momentum buildup.
RSI + Divergence: Filters for neutral RSI zones (40-70 for longs, 30-60 for shorts) and detects bullish/bearish divergences over 20 bars.
Volume Profile: Demands above-average volume (1.5x 20-period SMA) with buying/selling pressure analysis.
Trendlines & S/R: Auto-detects dynamic trendlines from pivots (10-bar lookback) and support/resistance zones (100-bar lookback, 3+ touches), avoiding entries near key levels.
Session Filters: Trades only during London/NY sessions (UTC-based), skipping high-volatility news windows (e.g., 1:30-2:00 PM UTC).
All filters are toggleable, allowing you to dial in aggressiveness—disable for more signals during backtesting.Risk Management & Position Sizing
Safety first: Uses 100% equity per trade with 0.1% commission simulation. Stops & Targets: ATR-based (14-period) stop-loss (1x ATR) and take-profit (2.5x ATR) for 1:2.5 risk-reward.
Breakeven Moves: Auto-shifts stop to +0.1% entry after 1% profit.
Trailing Stops: Optional 1.5x ATR trail to lock in gains during runners.
No pyramiding—flat after each close for clean, low-drawdown performance.
Visualization & Insights On-Chart: Plots EMAs, pullback lines, S/R dashes, trend backgrounds (green/red), and entry labels/shapes.
Dashboard: Real-time table shows trend status, HTF bias, quality scores, MACD/RSI/volume readouts, session info, ATR, price, and position.
Customization: 20+ inputs grouped by category; max 500 labels for clean charts.
Performance Edge & Usage Tips
Backtested for 75%+ win rates in trending markets, this strategy shines in volatile assets like EURUSD or BTCUSD. Start with defaults on 1H charts, then tweak filters (e.g., lower quality to 50%) for ranging conditions. Always forward-test—past results aren't guarantees. Download, apply, and elevate your trading with confluence-driven precision!

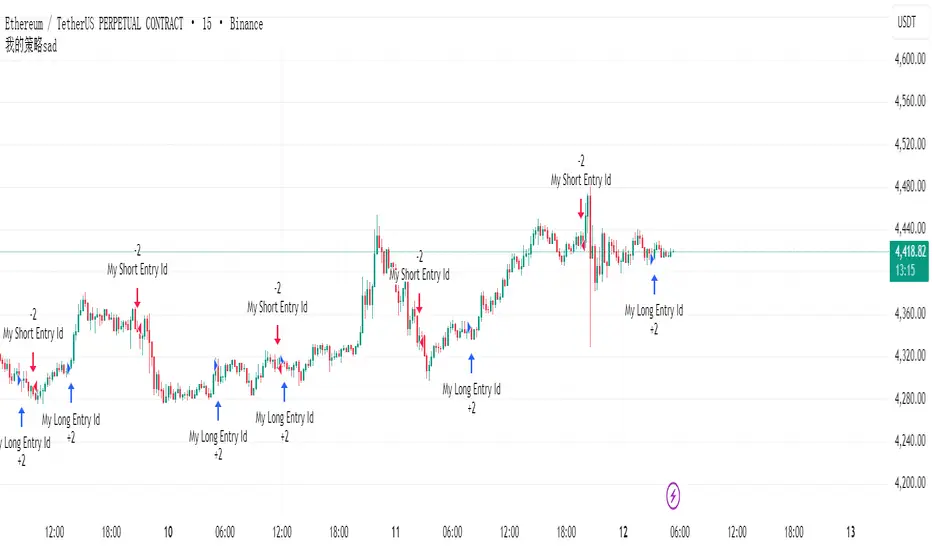
QZ Trend (Crypto Edition) v1.1a: Donchian, EMA, ATR, Liquidity/FThe "QZ Trend (Crypto Edition)" is a rules-based trend-following breakout strategy for crypto spot or perpetual contracts, focusing on following trends, prioritizing risk control, seeking small losses and big wins, and trading only when advantageous.
Key mechanisms include:
- Market filters: Screen favorable conditions via ADX (trend strength), dollar volume (liquidity), funding fee windows, session/weekend restrictions, and spot-long-only settings.
- Signals & entries: Based on price position relative to EMA and EMA trends, combined with breaking Donchian channel extremes (with ATR ratio confirmation), plus single-position rules and post-exit cooldowns.
- Position sizing: Calculate positions by fixed risk percentage; initial stop-loss is ATR-based, complying with exchange min/max lot requirements.
- Exits & risk management: Include initial stop-loss, trailing stop (tightens only), break-even rule (stop moves to entry when target floating profit is hit), time-based exit, and post-exit cooldowns.
- Pyramiding: Add positions only when profitable with favorable momentum, requiring ATR-based spacing; add size is a fraction of the base position, with layers sharing stop logic but having unique order IDs.
Charts display EMA, Donchian channels, current stop lines, and highlight low ADX, avoidable funding windows, and low-liquidity periods.
Recommend starting with 4H or 1D timeframes, with typical parameters varying by cycle. Liquidity settings differ by token; perpetuals should enable funding window filters, while spot requires "long-only" and matching fees. The strategy performs well in trends with quick stop-losses but faces whipsaws in ranges (filters mitigate but don’t eliminate noise). Share your symbol and timeframe for tailored parameters.

2 of 3 Confluence StrategyA strategy created for swing and positional trading on stocks and index. Best to use on daily or minimum hourly time frame. It will also work in smaller time frames but there will be some noise.

Liquidation Strategy📈 It enters a long trade when long liquidation spikes above a set threshold.
📉 It enters a short trade when short liquidation drops below the negative threshold.
🧮 It optionally filters entries using an EMA multiplier.
🔁 It exits long when RSI crosses below its smoothed version.
🔄 It exits short when RSI crosses above its smoothed version.
🔗 It requires linking to the Liquidations indicator on Bybit or OKX charts.


Money Flow Index 1D — last-10m live EXITMoney Flow Index 1D Algo — Last-10m Live Exit (Single-Alert Ready)
What it does
This strategy buys daily oversold dips using MFI and manages exits with simple, execution-friendly rules:
Entry (Long-only): Go long when daily MFI < threshold (optional “operate on close” confirmation).
Exits:
Breakout exit: Close if price closes above the previous day’s high.
Time exit: Close after N bars in trade.
Optional SL: Percentage stop from entry.
Live EOD exit window: During the last N minutes before 16:00 New York, close early if price strength persists (configurable buffer).
Next-open execution: When an exit is marked at the daily close, the strategy sends the close at the next session open (live alert) while still backtesting with strategy.close.
Anti-PDT safeguard: Optional rule to avoid same-day exits after entry.
Single-alert mode: Optional, sends entry JSON from the script so you can run the entire flow with one alert.
Visuals: Entry/exit markers and “pending exit” badge.
Notes: Alert-based exits run on live bars; historical backtests use strategy orders so results remain visible. The EOD window uses your time zone input (default: America/New_York) and only applies in real-time.
Inputs (high-level)
MFI period & level: Default 2 bars; enter when MFI < level.
Operate on close: Confirm signals at bar close.
Max bars in trade: Time stop.
Stop-Loss %: Optional percent SL.
EOD live exit window: Last N minutes before 16:00 NY (+ optional price buffer).
Anti-PDT: Block same-day exits.
Single-alert mode: If enabled, the script emits entry alerts too; otherwise only exits send alerts.
Connect to SignalStack (no custom server needed)
Option A — One alert (recommended): “Any alert() function call”
This script generates JSON via alert() on entries (when Single-alert is ON) and on all exits. Create one alert and let the script supply the message.
Create a SignalStack webhook (Brokers & Webhooks → pick your broker → Create Webhook → copy URL).
SignalStack
In TradingView Create Alert:
Condition: select this strategy → Any alert() function call.
TradingView
Webhook URL: paste your SignalStack webhook URL.
SignalStack
Message: leave empty — the script’s alert() provides full JSON (the Create-Alert “Message” box is not used by alert() and doesn’t process placeholders).
TradingView
In the strategy settings:
Turn ON “Use a single alert (alert() also on ENTRIES)”.
Set Entry Qty (this becomes the quantity value in the entry JSON).
What SignalStack expects (stocks/ETFs): symbol, action, quantity. Docs show lowercase examples ("buy", "sell"). If your broker enforces lowercase, ensure actions are lowercase in the payload.
SignalStack
Typical live JSON (sent by the script):
Entry: {"symbol":"QQQ","action":"BUY","quantity":10,"class":"equity","intent":"open",...}
Exit: {"symbol":"QQQ","action":"SELL","quantity":,"class":"equity","intent":"close",...}
SignalStack’s stock router only requires symbol/action/quantity; extra fields like class, intent, source, nonce are simply ignored by the router.
SignalStack
Option B — Strategy “Order fills only” (alternative)
If you prefer TradingView to send alerts on strategy fills, create a Strategy Alert with Order fills only and put JSON with placeholders in the Message box (TradingView replaces them at runtime):
TradingView
+1
Message:
{
"symbol": "{{ticker}}",
"action": "{{strategy.order.action}}",
"quantity": "{{strategy.order.contracts}}"
}
Placeholders like {{strategy.order.action}} and {{strategy.order.contracts}} are officially supported in strategy alerts.
TradingView
For stocks/ETFs on Tastytrade, those three fields are sufficient per SignalStack docs.
SignalStack
Why the single-alert option is ideal here
The script already builds the JSON and handles special cases (last-10m exit, next-open exit).
Using “Any alert() function call” means you only maintain one alert; the code drives entries/exits.
TradingView
Disclaimers
Backtests are simulations; live fills differ. Verify your broker permissions and symbol formats in SignalStack before going live. SignalStack examples show lowercase action values; align to your broker’s requirement if needed.
SignalStack

AstraAlgo BacktesterOVERVIEW
The AstraAlgo Backtester allows traders to simulate and evaluate trading strategies directly on TradingView. By simulating trades across different timeframes and markets, it provides valuable insights into win rates, drawdowns, and overall strategy effectiveness.
HOW TO GAIN ACCESS
Subscribe at www.astraalgo.com and provide your TradingView username. Access is usually granted within a few hours, and you’ll receive email confirmation once activated.
FEATURES
Signal Modes
Signal Modes are the core of the AstraAlgo Backtester, generating simulated trade signals based on historical price data. Users can choose between Off, Basic, Advanced, or Custom modes to evaluate strategies under different conditions and refine their trading approach.
Adjustable Backtesting
Parameters for historical simulations can be customized to test different market conditions and trading scenarios. This allows traders to measure strategy performance, including win rate, profit/loss, and risk/reward ratios, helping refine and optimize strategies before live execution.
Bar Coloring
Bar Coloring highlights bullish and bearish bars on historical charts, allowing traders to visually assess trend direction and trade outcomes during backtesting. This makes it easier to analyze momentum and strategy effectiveness at a glance.
Astra Cloud
Astra Cloud overlays dynamic support and resistance levels on historical price data. These zones adapt automatically to past market movements, helping traders identify areas where trades would have reacted, aiding strategy evaluation and optimization.
CONTACT US
For any questions or assistance, contact us at support@astraalgo.com or visit www.astraalgo.com.


New Rate - PREMIUM v2New Rate – Premium
Overview
New Rate – Premium is a breakout strategy built around a strict “one trade per day” rule. It forms an intraday range from the first N candles, freezes High/Low at the close of candle N, and places OCO stop orders exactly on those levels. The first breakout fills and the opposite order is canceled. Exits can be managed by fixed ticks or by risk/reward (RR). The script draws SL/TP boxes, keeps entry labels at a fixed distance from price, and lets you restrict trading to selected weekdays.
How it works
Window & count: set timeframe, session start, and N candles. Those candles are highlighted and used to compute the range High/Low.
Freeze: when candle N closes, the strategy locks High/Low and draws the lines; a 50% midline is optional.
OCO placement: buy-stop on High and sell-stop on Low (one-cancels-other). The first fill cancels the other side.
Exits:
– Ticks mode: SL/TP are fixed distances in ticks from entry.
– RR mode: SL at the opposite side of the range; TP = RR × risk.
Visual SL/TP boxes are drawn in both modes.
Daily lock: after the first fill, no more entries for that day.
Key features
First break only, one trade per day: hard discipline that avoids over-trading.
Automatic range end: timeframe × N candles (or manual end time).
Exact “at-the-break” entries: stop orders placed at frozen High/Low.
Flexible exits: fixed ticks or RR with opposite-side stop.
Clean visuals: High/Low and midline with configurable color/style/width; text alignment (left/center/right); session background with opacity.
SL/TP boxes: configurable colors, borders, width, and forward projection.
Entry labels with constant offset: “BUY” below bar, “SELL” above bar; distance in ticks so labels never sit on price.
Weekday filter: trade only the days you select (Mon–Fri).
Inputs (summary)
• Session & range: timeframe (minutes), start time, N candles, auto end (TF × N) or manual, line extension.
• Style: High/Low colors, styles, widths; midline on/off; label position; session background color and opacity.
• Exits: RR using the opposite extreme as SL, or “Use SL/TP by ticks”.
• SL/TP boxes: projection bars, SL color, TP color, border color and width, box limit.
• Weekdays: Monday–Friday selectors.
• Entry labels: show/hide, colors, size, vertical offset in ticks, optional X shift in bars.
Backtest snapshot — FX:XAUUSD 30m
Range: 02 Jan 2024 00:00 → 12 Sep 2025 12:00 • Symbol/TF: FX:XAUUSD / 30m
• Net Profit: $1,599.77
• Gross Profit / Gross Loss: $3,929.47 / $2,329.70
• Max Drawdown: $112.73 (4.93%)
• Total Trades / Win rate: 440 / 48.41%
• Avg Trade: $3.64 (0.04%); Avg Winner / Avg Loser: $18.45 / $10.26
• Profit Factor / Sharpe / Sortino: 1.687 / 1.163 / 6.876
• Largest Win / Loss: $91.94 / $10.26
• Avg Bars in Trade: 1 (long), 2 (short)
Why this strategy is original
First-bar breakout accuracy: orders arm exactly when the N-th candle closes, so the very next bar can fill at the true break. This avoids the common ORB miss where the first post-range bar is skipped by delayed checks or market orders.
OCO + daily lock as a core mechanic: the engine enforces one-and-done behavior—no soft rules, no hidden retries—so test results match live logic.
Two exit frameworks, one visual language: switch seamlessly between fixed-tick and structural RR exits while managing both with the same SL/TP boxes for consistent analysis and education.
Readability by design: label offset, aligned High/Low text, and tunable session background keep charts uncluttered during long optimizations or multi-asset reviews.
Operational guardrails: drawing budgets, box limits, and weekday filters are integrated so backtests remain stable and realistic with trading hours.
Focused ORB specialization: no oscillators, no hidden bias—transparent, testable, and purpose-built for the opening-range dynamic you configure.
Recommended use
• Session openings or early windows with a single, clean decision per day.
• Strict rules with exact entry levels and auditable exits.
• Benchmarking exits in both ticks and RR with apples-to-apples visuals.
Default strategy properties
• Initial capital: 10,000 USD; position sizing by % of equity (editable).
• Commissions default to 0% and slippage to 0; edit to match your broker/market.
• Drawing limits tuned to respect TradingView resource caps.
Best practices & compliance
• Educational use. Not financial advice.
• Past performance does not guarantee future results.
• Adjust slippage, commissions, and position sizing to your live context.
• Original implementation with documented mechanics; compliant with TradingView House Rules.
Example setup
TF 5m, start 08:00, N = 6 → auto end at 08:30
RR = 2 with SL at the opposite side of the range
Boxes: projection 10 bars; SL #9598a1; TP #ffbe1a; border #787B86; opacity 70
Days: Tuesday and Wednesday only
Labels: “BUY” below and “SELL” above, 10-tick offset
Glossary
• Opening range breakout (ORB): breakout of the configured initial range.
• One-cancels-other (OCO): filling one order cancels the other.
• Risk/reward (RR): target equals RR × risk distance.
• Tick: minimum price increment.
• Offset: fixed label separation from the bar extremum.

EMA+MACD+Fib Scalping ChallengeThis strategy synthesizes two core concepts from the provided transcripts:
Transcripts are pulled from the following two youtube videos
youtu.be
youtu.be
High-Probability Scalping Setup (1st Transcript): A mechanical method for finding high-probability, short-term reversal trades on a 1-minute chart. It uses a triple confluence of:
Trend Direction: Two Exponential Moving Averages (EMA 8 and EMA 34) identify the short-term trend direction via crossovers.
Momentum Confirmation: A fast MACD (3, 10, 16) confirms the strength and timing of the momentum shift required for entry.
Precise Entry Zone: Fibonacci retracement levels (primarily 61.8%) identify where a pullback is most likely to end and the main trend is likely to resume, providing a high-value entry point.
Aggressive Account Growth Challenge (2nd Transcript): An extremely high-risk, high-reward money management framework. Instead of traditional 1-2% risk per trade, this strategy risks 23% of the current account equity on each trade to target a 30% profit (a reward-risk ratio of approximately 1.3:1). The goal is to compound a small initial stake ($20) into a much larger amount ($50k+) over a series of successful trades, accepting that a few losses can wipe out the account just as quickly.
Core Philosophy: The strategy bets heavily on the edge provided by the high-probability technical setup. When the setup is correct, the account grows exponentially. When it fails, the losses are severe. It is designed for maximum capital efficiency in trending markets but is vulnerable during choppy or ranging conditions.
Ideal Parameter Settings & Configuration
These settings are optimized based on the specifics mentioned in the transcripts for 1-minute scalping.
1. Chart & Instrument Settings
Time Frame: 1 Minute
Instruments: Major forex pairs with low spreads (e.g., EUR/USD, GBP/USD). This is critical for scalping.
Trading Session: Highly liquid sessions like the London-New York overlap.
2. Indicator Parameters & Inputs
Parameter Ideal Setting Description & Purpose
Fast EMA Length 8 Reacts quickly to recent price changes, used for signal generation.
Slow EMA Length 34 Defines the underlying short-term trend. Acts as dynamic support/resistance.
MACD Fast Length 3 Makes the MACD extremely sensitive for catching early momentum shifts on the 1-min chart.
MACD Slow Length 10 The baseline for the fast length to calculate momentum against.
MACD Signal Smoothing 16 Slightly smoothed signal line to generate clearer crossover signals.
Fibonacci Level 61.8% The primary retracement level used to define the entry zone and the stop-loss level.
3. Strategy & Money Management Parameters
Parameter Setting Description & Purpose
Initial Capital 20 (or any small amount) The starting capital for the challenge.
Risk Per Trade 23% of equity The defining rule of the challenge. This is the percentage of the current account value risked on each trade.
Profit Target Per Trade 30% of equity The target profit, creating a ~1.3:1 Reward/Risk ratio.
Stop-Loss Type Fixed Percentage (23%) For simplicity and adherence to the challenge rules. The transcript also mentions placing the stop "a little below the 61.8% Fib level," which is a more advanced option.
Pyramiding 0 Do not add to positions. One trade at a time is already high-risk.
4. Entry & Exit Rules (Coded Logic)
LONG ENTRY: When ALL of the following occur simultaneously:
EMA 8 crosses above EMA 34.
MACD Histogram crosses above 0 (turns positive).
Price is touching or retracing to the 61.8% Fibonacci level drawn from a recent swing low to high.
SHORT ENTRY: When ALL of the following occur simultaneously:
EMA 8 crosses below EMA 34.
MACD Histogram crosses below 0 (turns negative).
Price is touching or retracing to the 61.8% Fibonacci level drawn from a recent swing high to low.
EXIT RULES:
Take Profit: Close the trade when a 30% profit on the risked capital is reached.
Stop Loss: Close the trade when a 23% loss on the risked capital is reached.
Emergency Exit: If the MACD or EMA cross back in the opposite direction before target/stop is hit, consider an early exit.
Critical Disclaimer and Final Notes
EXTREME RISK: This is not a standard trading strategy. It is a high-stakes challenge. Risking 23% per trade means just 4 consecutive losses would likely wipe out over 90% of your account. The second transcript's simulation showed a 99.5% success rate only under a constant 60% win rate condition, which is unrealistic in live markets.
Demo Use Only: This strategy must be thoroughly tested and understood in a demo environment before ever considering it with real funds.
Market Dependency: This strategy thrives only in strongly trending markets with clear pullbacks. It will generate significant losses in ranging, choppy, or low-volatility conditions. The ability to avoid trading in bad markets is a key factor in the challenge's success.
Psychological Pressure: The emotional burden of watching 23% of your account fluctuate on a 1-minute chart is immense and can lead to poor decision-making.
Use this strategy as a fascinating framework to study confluence and aggressive compounding, not as a guaranteed path to profits.
