Tails and WicksTails and Wicks 📊
A clean price action tool that spots strong wick rejection candles and draws semi-transparent colored boxes around their high-to-low range. 🔍
Boxes extend forward to highlight potential S/R zones – perfect for pinbars, hammers, shooting stars & indecision dojis! 🚀
Features:
• 🟢 Bullish tails (long lower wick – default green)
• 🔴 Bearish tails (long upper wick – default red)
• 🟠 Indecision (both long wicks – default orange)
• Independent toggles & custom colors 🎨
• Adjustable wick % threshold (default 60%)
• Fixed or infinite right extension ➡️
• Limit recent zones per type (default 4) to keep charts tidy 🧹
• Pure visual – no text clutter (disable "Labels on price scale" in indicator Style tab if needed)
Lightweight, customizable, and great for clean price action trading! 💹
指標和策略

Confluence Levels + Vol Triangles + No-Trade GrayWhen two levels cross: Premarket High (PMH), Premarket Low (PML), Yesterday High (YH), Yesterday Low (YL), Opening Range High (ORH), Opening Range Low (ORL),VWAP, you get a confluence trigger (line cross) that is green for a bull signal and red for a bear signal. Orange line cross signals confluence, but it is unclear what direction. Additional confluence is signaled by a triangle once volume

Liquidity Sweep Reentry ToolkitHere’s a clear breakdown of what your Liquidity Sweep Reentry Toolkit script does, and how you can use it on your charts:
🔎 Script Breakdown
1. Visual Controls (Inputs)
• : Master toggle to turn all visuals on/off.
• : Show labels when a liquidity sweep + ChoCh condition occurs.
• : Plot green/red triangles for bullish/bearish reentry signals.
• : Prevent multiple signals within the same swing.
• : Show HH/HL/LL/LH market structure letters.
• : Slider to adjust how dim the background of HH/HL/LL/LH labels appear.
2. Core Conditions
• Defines simple bullish () and bearish () candles.
• is a placeholder for your Change of Character logic.
3. Sweep Detection
• : Detects when price makes a new high compared to the last 5 bars.
• : Detects when price makes a new low compared to the last 5 bars.
4. Restriction Flags
• Tracks whether a sweep signal has already triggered in the current swing.
• Resets when sweeps end, so new signals can appear.
5. Composite Triggers
• : Fires when bullish candle + buy-side sweep + ChoCh condition align.
• : Fires when bearish candle + sell-side sweep + ChoCh condition align.
6. Visual Labels
• Gold labels mark “BS Sweep + ChoCh” or “SS Sweep + ChoCh” events.
• Green triangle below bar = bullish reentry.
• Red triangle above bar = bearish reentry.
• Blue HH/HL/LL/LH labels narrate market structure pivots, with adjustable transparency.
7. Alerts
• Alerts can be set for bullish or bearish sweep reentry triggers, so you get notified when conditions align.
📘 How to Use It
1. Apply to Chart
Add the script to your TradingView chart (works best on intraday timeframes like 5‑minute).
2. Configure Visuals
• Use the Visual Controls panel to toggle features on/off.
• Adjust the Label Transparency slider to dim or brighten the HH/HL/LL/LH labels.
3. Interpret Signals
• Gold labels show when a sweep + ChoCh condition occurs.
• Triangles mark potential reentry points (green = bullish, red = bearish).
• HH/HL/LL/LH labels narrate market structure shifts for clarity.
4. Set Alerts
• Use the built‑in alert conditions to get notified when bullish or bearish sweep reentry triggers fire.
👉 In short: this toolkit helps you spot liquidity sweeps, confirm with ChoCh, and visualize reentry signals, while also narrating market structure pivots. It’s modular, so you can toggle features depending on how much visual clutter you want.
🛠 Workflow Example
1. Setup
• Apply the script to your chart (e.g., 5‑minute S&P futures).
• In the indicator settings, decide which visuals you want:
• Turn on Sweep + ChoCh labels if you want to see gold tags narrating liquidity events.
• Keep Entry triangles on to highlight actionable reentry points.
• Adjust the Label Transparency slider so HH/HL/LL/LH structure labels are dim enough not to clutter.
2. Watch for Sweeps
• As price pushes above recent highs → a Buy‑side Sweep is detected.
• As price dips below recent lows → a Sell‑side Sweep is detected.
• If ChoCh logic is true at the same time, you’ll see a gold label (“BS Sweep + ChoCh” or “SS Sweep + ChoCh”).
3. Confirm Reentry
• If conditions align (bullish candle + buy‑side sweep + ChoCh), you’ll see a green triangle below the bar.
• If bearish candle + sell‑side sweep + ChoCh, you’ll see a red triangle above the bar.
• These triangles are your potential reentry triggers.
4. Narrate Market Structure
• HH/HL/LL/LH labels appear at pivots, giving you a running commentary of structure shifts.
• Example: HH → HL → HH shows bullish continuation; LH → LL → LH shows bearish pressure.
• Use the transparency slider to keep these labels subtle but visible.
5. Alerts
• Set alerts for “Bullish Sweep Reentry” or “Bearish Sweep Reentry” so you don’t miss signals even if you’re away from the screen.
📘 How to Use in Practice
• Intraday trading: On a 5‑minute chart, use the toolkit to spot liquidity grabs and confirm reentry points.
• Narration: The HH/HL/LL/LH labels help you keep track of structure without manually marking pivots.
• Decision making: Gold labels + triangles = potential trade setups. Structure labels = context for trend bias.
• Customization: Dim labels when you want a cleaner chart, brighten them when you’re focused on structure.
👉 In short: this script gives you a modular toolkit — sweeps, ChoCh confirmation, reentry signals, and structure narration — all adjustable so you can tailor the visuals to your workflow.
📈 Bullish Scenario Walkthrough
1. Market Context
• You’re watching the 5‑minute chart.
• Price has been consolidating near recent highs, building liquidity above.
2. Liquidity Sweep
• Price spikes above the prior swing high → the script detects a buy‑side sweep.
• A gold label appears: “BS Sweep + ChoCh” (if your ChoCh condition is true).
3. Change of Character (ChoCh)
• The candle closes bullish ().
• Your ChoCh condition confirms a structural shift.
• Together, sweep + ChoCh = potential reentry setup.
4. Reentry Trigger
• The script plots a green triangle below the bar.
• This marks a bullish sweep reentry signal: price grabbed liquidity and is now showing strength.
5. Market Structure Narration
• At the same time, the HH/HL labels update:
• The sweep bar prints a new HH.
• The next pivot low prints an HL.
• This narrates bullish continuation: HH → HL → HH.
6. Trade Decision
• You can use the green triangle as your entry cue.
• The HH/HL narration gives you confidence that structure supports the trade.
• Alerts can be set so you don’t miss the trigger.
7. Risk Management
• Stop placement: below the HL pivot or sweep low.
• Target: next liquidity pool above, or measured move.
🧭 How to Use This in Practice
• Gold label = liquidity event + ChoCh confirmation.
• Green triangle = actionable bullish reentry trigger.
• HH/HL narration = context for trend bias and trade management.
• Transparency slider = keep structure labels subtle so the chart stays clean.
📉 Bearish Scenario Walkthrough
1. Market Context
• You’re watching the 5‑minute chart.
• Price has been consolidating near recent lows, building liquidity underneath.
2. Liquidity Sweep
• Price spikes below the prior swing low → the script detects a sell‑side sweep.
• A gold label appears: “SS Sweep + ChoCh” (if your ChoCh condition is true).
3. Change of Character (ChoCh)
• The candle closes bearish ().
• Your ChoCh condition confirms a structural shift.
• Together, sweep + ChoCh = potential bearish reentry setup.
4. Reentry Trigger
• The script plots a red triangle above the bar.
• This marks a bearish sweep reentry signal: price grabbed liquidity below and is now showing weakness.
5. Market Structure Narration
• At the same time, the LH/LL labels update:
• The sweep bar prints a new LL.
• The next pivot high prints a LH.
• This narrates bearish continuation: LH → LL → LH.
6. Trade Decision
• You can use the red triangle as your entry cue.
• The LH/LL narration gives you confidence that structure supports the short.
• Alerts can be set so you don’t miss the trigger.
7. Risk Management
• Stop placement: above the LH pivot or sweep high.
• Target: next liquidity pool below, or measured move.
🧭 How to Use This in Practice
• Gold label = liquidity event + ChoCh confirmation.
• Red triangle = actionable bearish reentry trigger.
• LH/LL narration = context for trend bias and trade management.
• Transparency slider = keep structure labels subtle so the chart stays clean.

MTF FVG 3-candleMTF FVG 3-candle is an indicator that detects Fair Value Gaps using a 3-candle pattern on the timeframe selected in the settings. It projects FVG zones onto lower timeframes, tracks the first touch and full fill of each zone, and provides alerts.

Trinity ATR Levels Pro (SATY)Trading View banned the original version of this script as when I published I did not realize I should not have another indicator on the screen at the same time and TV correctly removed it to prevent anyone from being confused. Here is the clean single view on this indicator with nothing else on the screen. Enjoy as I know some people have been messaging me to have it added back...
This is an updated version of the SATY ATR levels () and all credit to him for the original version.
Major Changes and why it helps:
Lower Trigger line is now red instead of yellow, Upper Trigger line is now green instead of aqua/cyan to indicate to go long or short.
Every single level group has its own color input so you can customize everything (previous close, fib levels, 61.8 %, 100 % ATR, extensions, 200 %, 300 %, etc.) without touching the code. Every plotted level now has a clear text label on the right side of the chart (“Prev Close”, “Lower Trig”, “Upper Trig”, “-61.8 %”, “+100 %”, “-200 %”, etc.) so you instantly know what you’re looking at.
A new input called “Target Distance (×ATR)” lets you decide how far your profit target is (default 1.0 = +100 % ATR, but you can set 1.618, 2.0, 2.618, etc. instantly).
As soon as price closes above the Upper Trigger or below the Lower Trigger, a big, obvious target box automatically appears on the right side of the screen showing the exact dollar target price for the active long or short (green box for longs, red box for shorts). When there is no active trigger, the box disappears and the table stays perfectly clean.
In short, you now have the exact same beloved Saty ATR indicator everyone uses, but with red/green triggers, full color control, level labels, and a beautiful dynamic target box that only shows up when you actually have a trade on — all while keeping the original clean 4-row table untouched. It’s the cleanest and most professional version you’ll find anywhere. Enjoy! 🚀
Some other changes:
1. added alerts
2. added ability to change the table location and size and enable or disable
3. added the ability to change the target box size and enable or disable
4. added the ability to change from calls/puts to longs/shorts
5. added the ability to change the target levels
6. added the ability to change the trigger levels
7. added info hints box to every menu selection in the settings

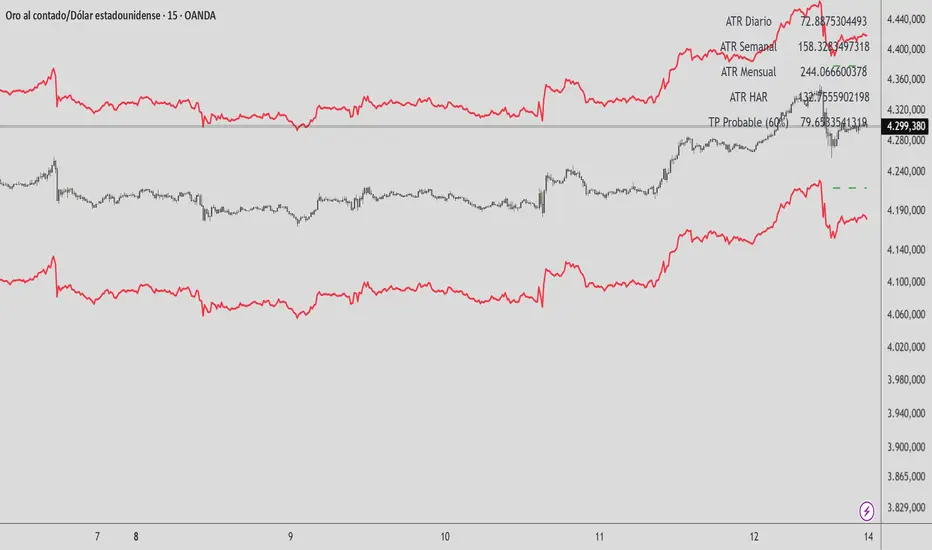
HAR Volatility ATR v1.0 (Andreus Villalobos)
Indicator based on the HAR (Hyper-Realized Volatility) model.
Combines daily, weekly, and monthly ATRs to project:
– Most probable price range (90%)
– Most probable take profit (60%)
Does not generate entry signals.
Designed for use in conjunction with:
market structure, liquidity, and price action.
Works on Forex, Indices, Gold, and Cryptocurrencies.
VX Levels and Ranch Ranges with SPY/SPX price converterThis is a indicator for all Vexly subscribers to plot the following:
1. Plot SPY/SPX levels on your ES chart. Or QQQ levels on your NQ chart
2. VX levels obtained from vx_levels command. SPY on ES chart and QQQ on NQ chart
3. Ranch Range levels from the discord channel for ES and NQ chart.
You can enable/disable any of them at your discretion.

Dynamic Pivot Point [MarkitTick]Title: Dynamic Pivot Point MarkitTick
Concept
Unlike traditional Pivot Points, which plot static horizontal levels based on the previous period's High, Low, and Close, this script introduces a dynamic element by applying an Exponential Moving Average (EMA) to the calculated pivot levels. This approach allows the Support and Resistance zones to adapt more fluidly to recent price action, reducing the jagged steps often seen in standard multi-timeframe pivot indicators.
How It Works
The script operates in two distinct phases of calculation:
1. Data Extraction and Core Math:
The indicator first requests the High, Low, and Close data from a user-defined timeframe (e.g., Daily, Weekly). Using this data, it calculates the standard Pivot Point (P) alongside three levels of Support (S1, S2, S3) and three levels of Resistance (R1, R2, R3) using standard geometric formulas:
Pivot = (High + Low + Close) / 3
R1 = 2 * Pivot - Low
S1 = 2 * Pivot - High
(Subsequent levels follow standard Floor Pivot logic).
2. Dynamic Smoothing:
Instead of plotting these raw values directly, the script processes each calculated level (P, S1-S3, R1-R3) through an Exponential Moving Average (EMA). The length of this EMA is controlled by the Pivot Length input. This smoothing process filters out minor volatility and creates curved, dynamic trajectories for the pivot levels rather than static straight lines.
How to Use
Traders can use this tool to identify dynamic areas of interest where price may react.
The White Line represents the Central Pivot. Price action relative to this line helps determine the immediate bias (above for bullish, below for bearish).
Green Lines (Support 1, 2, 3) indicate potential demand zones where price may bounce during a downtrend.
Red Lines (Resistance 1, 2, 3) indicate potential supply zones where price may reject during an uptrend.
Because the levels are smoothed, they can also act as dynamic trend followers, similar to moving averages, but derived from pivot geometry.
Settings
Show Pivot Points: Toggles the visibility of the plot lines on the chart.
Pivot Length: Defines the lookback period for the EMA smoothing applied to the pivot levels. A higher number results in smoother, slower-reacting lines.
Timeframe: Determines the timeframe used for the underlying High/Low/Close data (e.g., selecting "D" calculates pivots based on Daily data while viewing a lower timeframe chart).
Disclaimer This tool is for educational and technical analysis purposes only. Breakouts can fail (fake-outs), and past geometric patterns do not guarantee future price action. Always manage risk and use this tool in conjunction with other forms of analysis.

Day Trading MA Crossover IndicatorDay Trading MA Crossover Indicator Overview The Day Trading MA Crossover Indicator is a simple yet effective tool designed for day traders to identify potential buy and sell opportunities based on moving average crossovers. It plots two customizable moving averages on your chart and generates clear visual signals when they cross, helping you spot trend reversals or continuations in fast-paced markets.This indicator is ideal for intraday trading on lower timeframes (e.g., 5-min, 15-min charts) but can be adapted for swing trading or higher timeframes. It's built with flexibility in mind, allowing you to tweak the MA lengths and types to suit your strategy.Key FeaturesMoving Average Crossovers: Generates "BUY" signals when the fast MA crosses above the slow MA (potential bullish entry) and "SELL" signals when it crosses below (potential bearish entry or exit).
Visual Signals: Green "BUY" labels below bars for long entries and red "SELL" labels above bars for short entries or exits. Optional subtle background coloring highlights signals for quick spotting.
Customizable Parameters:Fast MA Length (default: 9): Period for the shorter moving average.
Slow MA Length (default: 21): Period for the longer moving average.
MA Type (default: EMA): Choose between SMA (Simple), EMA (Exponential), or WMA (Weighted) for different smoothing behaviors.
Overlay Mode: Plots directly on your price chart without cluttering separate panes.
Lightweight and Efficient: Minimal computation for real-time performance on TradingView.
How It WorksMoving Averages Calculation: The indicator computes two MAs based on your selected type and lengths using closing prices.
Signal Detection: A buy signal triggers on an upward crossover (fast MA > slow MA), indicating potential momentum shift to the upside. A sell signal triggers on a downward crossunder (fast MA < slow MA), signaling possible downside momentum.
Visual Aids: Signals appear as labeled shapes with optional background tints to emphasize key bars.
Usage TipsFor Day Trading: Apply on volatile instruments like forex pairs, stocks, or crypto. Combine with support/resistance levels or other indicators (e.g., RSI for overbought/oversold confirmation) to filter false signals in ranging markets.
Backtesting: Test on historical data to optimize MA lengths for your asset—shorter periods for aggressive trading, longer for smoother trends.
Risk Management: Always use stop-losses and position sizing. Signals are not foolproof and work best in trending conditions.
Customization: Adjust inputs via the indicator settings panel after adding it to your chart.
Example SetupOn a 5-min EUR/USD chart: Use EMA (9/21) for quick crossovers. Look for buy signals above key support with increasing volume.
Avoid choppy markets where frequent false crossovers ("whipsaws") can occur.
This indicator is provided for educational and informational purposes only. It is not financial advice, and past performance does not guarantee future results. Trading involves risk; consult a professional advisor before using any strategy. If you have feedback or suggestions for improvements, feel free to comment!

SB - Ultimate Clean Trend Pro Uses dynamic Moving colour coding for spotting chage of bias. Use set up with keeping VWAP in reference.

FxNeel SessionAll types of ICT session you can draw here. Like Asia, London, NY, New Close, CBDR, Asia Kill zone and also Silverbullet Time zone.

[AlscapeLabs] HTF Candle Stack (Multi-Timeframe)
Overview
The HTF Candle Stack (Multi-TF) indicator is a powerful visualization tool designed to overlay high-timeframe (HTF) price action directly onto your current chart, independent of the chart's price scale. This gives traders a clear, aligned, and non-overlapping view of simultaneous price movements across customizable timeframes.
By stacking the candles horizontally next to the chart's price action, the indicator allows for quick identification of multi-timeframe correlation, trend confluence, and key levels without switching chart timeframes.
Key Features
6 Independent Stacks: Configure up to 6 separate timeframes (e.g., 5m, 15m, 1H, 4H, Daily, Weekly) to view the complete market fractals from micro to macro.
Price-Aligned Visualization : All HTF candle stacks are perfectly aligned with the main chart's vertical price axis
Replay Mode Safe : Includes dedicated logic to prevent "duplicate candles" during Bar Replay, ensuring accurate backtesting and historical analysis.
Toggleable Stacks : Each stack can be individually enabled or disabled via input settings
Dynamic Spacing : The distance between active stacks is automatically calculated and adjusted based on the visibility of the preceding stack.
Settings Guide
Stack Configuration (1 - 6)
Each of the six stacks has identical controls:
Show/Hide : Enable or disable this specific stack.
Timeframe : The specific HTF to display (e.g., "60" for 1 Hour, "D" for Daily).
[*} Count : How many candles to show in this stack (Current Active Candle + Past Closed Candles). Tip: Use higher counts (10-12) for lower TFs (Stack 1-2) and lower counts (2-4) for higher TFs (Stack 5-6)
Candle Color
Controls global coloring
Bullish / Bearish : Customize the body colors.
Wick : Separate control for wick color and transparency
Layout
Distance from Chart : How far (in bars) to the right the first stack begins
Space between Stacks : The gap (in bars) between each active stack.
Candle Width : The thickness of the HTF candles.
Labels
Displays a time-frame next to the active (live) candle in each stack
Show TF Labels : Enable or disable labels through all stacks
Text Color : Label text color
Background : Label background color
Style : Label position (Left, Down)
Size : Label text size (Tiny, Small, Normal, Large, Huge)
Developed by AlscapeLabs

SB-VDEMA + PivotsBest use - Intraday Scalping ( 1 Mt, 3 Mts, 5 Mts )
Uses Volatility weighted DEMA for smoother and reliable signals.
One can use dynamic colour coding of VWDEMA for entering call or puts. VWAP and Henkin ashi Supertrend is also there but, i think VWDEMA is quite enogh for decision making.

BTC - ALSI: Altcoin Season Index (Dynamic Eras)Title: BTC - ALSI: Altcoin Season Index (Dynamic Eras)
Overview & Philosophy
The Altcoin Season Index (ALSI) is a quantitative tool designed to answer the most critical question in crypto capital rotation: "Is it time to hold Bitcoin, or is it time to take risks on Altcoins?"
Most "Altseason" indicators suffer from Survivor Bias or Obsolescence. They either track a static list of coins that includes "dead" assets from previous cycles (ghosts of 2017), or they break completely when major tokens collapse (like LUNA or FTT).
This indicator solves this by using a Time-Varying Basket. The indicator automatically adjusts its reference list of Top 20 coins based on historical eras. This ensures the index tracks the winners of the moment—capturing the DeFi summer of 2020, the NFT craze of 2021, and the AI/Meme narratives of 2024/2025.
Methodology
The indicator calculates the percentage of the Top 20 Altcoins that are outperforming Bitcoin over a rolling window (Default: 90 Days).
The "Win" Count: For every major Altcoin performing better than BTC, the index adds a point.
Dynamic Eras: The basket of coins changes depending on the date:
2020 Era (DeFi Summer): Tracks the "Blue Chips" of the DeFi revolution like UNI, LINK, DOT, and early movers like VET and FIL.
2021 Era (Layer 1 Wars): Tracks the explosion of alternative smart contract platforms, adding winners like SOL, AVAX, MATIC, and ALGO.
2022 Era (The Survivors): Filters for resilience during the Bear Market, solidifying the status of established assets like SHIB and ATOM.
2023 Era (Infrastructure & Scale): Captures the rise of "Next-Gen" tech leading into the pre-halving year, introducing TON, APT (Aptos), and ARB (Arbitrum).
2024/25 Era (AI & Speed): Tracks the current Super-Cycle leaders, focusing on the AI narrative (TAO, RNDR), High-Performance L1s (SUI), and modern Memes (PEPE).
Chart Analysis & Strategy ( The "Alpha" )
As seen in the chart above, there is a strong correlation between ALSI Peaks and local tops in TOTAL3 (The Crypto Market Cap excluding BTC & ETH).
The Entry (Rotation): When the indicator rises above the neutral 50 line, it signals that capital is beginning to rotate out of Bitcoin and into Altcoins. This has historically been a strong confirmation signal to increase exposure to high-beta assets.
The Exit (Saturation): When the indicator hits 100 (or sustains in the Red Zone > 75), it means every single Altcoin is beating Bitcoin. Historically, this extreme exuberance often marks a local top in the TOTAL3 chart. This is the zone where smart money typically sells into strength, rather than opening new positions.
How to Read the Visuals
🚀 Altcoin Season (Red Zone > 75): Strong Altcoin dominance. The market is "Risk On."
🛡️ Bitcoin Season (Blue Zone < 25): Bitcoin dominance. Alts are bleeding against BTC. Historically, this is a defensive zone to hold BTC or Stablecoins.
Data Dashboard: A status table in the bottom-right corner displays the live Index Value, current Regime, and a System Check to ensure all 20 data feeds are active.
Settings
Lookback Period: Default 90 Days. Lowering this (e.g., to 30) makes the index faster but noisier.
Thresholds: Adjustable zones for Altcoin Season (Default: 75) and Bitcoin Season (Default: 25).
Credits & Attribution
This open-source indicator is built on the shoulders of giants. I acknowledge the original creators of the concept and the pioneers of its implementation on TradingView:
Original Concept: BlockchainCenter.net. - They established the industry standard definition: 75% of the Top 50 coins outperforming Bitcoin over 90 days = Altseason..
TradingView Implementation: Adam_Nguyen - He implemented the "Dynamic Era" logic (updating the coin list annually) on TradingView. Our code structure for the time-based switching is inspired by his methodology. See also his implementation in the chart. ( Altcoin Season Index - Adam) .
Comparison: Why use ALSI | RM?
While inspired by the above, ALSI introduces three key improvements:
Open Source: Unlike other popular TradingView versions (which are closed-source), this script is fully transparent. You can see exactly which coins are triggering the signal.
Sanitized History (Anti-Fragile): Historical Top 20 snapshots are not blindly used. "Dead" coins (like LUNA and FTT) from previous eras are manually filtered out. A raw index would crash during the Terra/FTX collapses, giving a false "Bitcoin Season" signal purely due to bad actors. The curated list preserves the integrity of the market structure signal.
Narrative Relevance: The 2024/25 basket was updated to include TAO (Bittensor) and RNDR, ensuring the index captures the dominant AI narrative, rather than tracking fading assets from the previous cycle.
You can compare the ALSI indicator with other available tradingview indicators in the chart: Different indicators for the same idea are shown in the 3 Pane window below the BTC and Total3 chart, whereas ALSI is the top pane indicator.
Important Note on Coin Selection Baskets are highly curated: Dead/irrelevant coins (FTT, LUNA, BSV) are excluded for clean signals. This prevents historical breaks and ensures Era T5 captures current narratives (AI, Memes) via TAO/RNDR. See above. Users are free to adjust the source code to test their own baskets.
Disclaimer
This script is for research and educational purposes only. Past correlations between ALSI and TOTAL3 do not guarantee future results. Market regimes can change, and "Altseasons" can be cut short by macro events.
Tags
bitcoin, btc, altseason, dominance, total3, rotation, cycle, index, alsi, Rob Maths

RSI WMA Crossover Momentum w/ HighlightRSI WMA Crossover Momentum
This is a momentum indicator that tracks the RSI. Its principle is to use the WMA line to determine the trend of the RSI, and from the RSI, the price trend can be determined.

Multi-TF RSI+EMA+Clean S/R v6Visual Confirmation (What You'll See)
✅ EMAs: Blue (9) + Red (21) lines
✅ Pivot Points: Red circles (high) + Green circles (low)
✅ S/R Lines: Red resistance + Green support
✅ MTF Table: Top-right corner (RSI/ADX values)
✅ Signals: 🚀 STRONG BUY / 🔻 STRONG SELL labels
✅ Background: Green/Red tint during strong trends

ICT Immediate RebalanceThe ICT Concept, whereby as soon as it is created, the price makes a strong movement in its favor, requires two "Wicks" to coincide at the same level or for there to be an overlap of no more than 2 Pips, a function that this Indicator fulfills to detect them.

Position CalculatorAn on chart indicator that helps you calculate position sizes, risk/reward ratios, and potential profit/loss for your trades.

Demi's + EMAs + VWAP + Key SR Lines + RSI SignalsBasic buy sell script for 5 min chart updated daily

SUPERTREND ADX FACTOR Modular Trading System - SuperTrend + ADX + DI
A comprehensive trend-following system with customizable filters for precise trade execution.
CORE COMPONENTS:
- SuperTrend with visual fill (trend detection)
- ADX + Directional Indicators (trend strength confirmation)
- Volume filter (optional)
- EMAs 7/21/50 (optional)
- Daily VWAP (optional)
- Previous Day High/Low levels (support/resistance)
KEY FEATURES:
✓ One entry per trend - avoids overtrading
✓ Entry: ADX crosses above threshold with SuperTrend alignment
✓ Exit: SuperTrend direction change
✓ Real-time status dashboard showing all filter conditions
✓ Clear BUY/SELL signals with EXIT markers
✓ All filters can be toggled ON/OFF for testing
✓ Customizable parameters for each indicator
DASHBOARD DISPLAY:
- Live ADX value (green >23 / red <23)
- DI+/DI- values with color coding
- Volume metrics
- Position status (IN/OUT)
- Signal status (BUY/SELL/WAIT)
IDEAL FOR:
Swing traders and position traders on 4H timeframe looking for high-probability trend entries with proper confirmation.
Default configuration: SuperTrend (ATR 10, 3.0) + ADX >23 + DI alignment

Forexsebi - NASDAQ Psychological Levels - TrendflowTrendflow is an advanced TradingView indicator combining psychological price levels with trend and multi-timeframe analysis.
The indicator automatically plots psychological levels in around the current price. Each level is visualized using horizontal lines and price zones (boxes) to clearly highlight potential support and resistance areas.
Psychological Levels – Trendflow ist ein fortschrittlicher TradingView-Indikator , der wichtige psychologische Preislevel mit einer klaren Trend- und Multi-Timeframe-Analyse kombiniert.
Trend Analysis with SMAs
SMA 50 & SMA 200 plotted directly on the chart
Individually toggleable
Clear color separation for fast trend recognition
Multi-Timeframe SMA Trend Table
Trend status (BULLISH / BEARISH / NEUTRAL) across:
5M, 15M, 1H, 4H, 1D
Logic: Price relative to SMA 50 & SMA 200
Color-coded, easy-to-read table
Info Box
Current Gold price
Nearest psychological level above and below price
Alert System
Alerts when price approaches a psychological level
User-defined alert distance

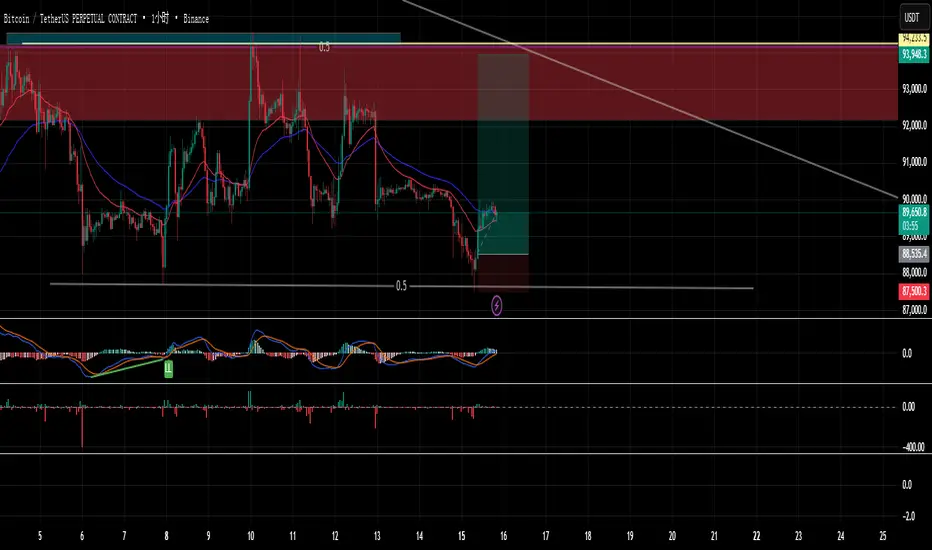
premium//@version=5
indicator("Custom Binance Premium Index + Alerts", overlay=false)
// === 1. 数据源(可修改) ===
// 永续合约价格(默认 BTCUSDT 永续)
futures = request.security("BINANCE:BTCUSDT_PERP", timeframe.period, close)
// 现货价格(默认 BTCUSDT 现货)
spot = request.security("BINANCE:BTCUSDT", timeframe.period, close)
// === 2. 计算自定义溢价指数 ===
premium = ((futures / spot) - 1) * 100
// === 3. 用户设定阈值(你给的值) ===
upper = 1.5 // 溢价 ≥ 1.5 触发告警
lower = -2.0 // 溢价 ≤ -2.0 触发告警
// === 4. 绘图 ===
plot(premium, title="Premium Index (%)", color=color.new(color.blue, 0))
hline(upper, "Upper Threshold (1.5%)", color=color.new(color.red, 0))
hline(lower, "Lower Threshold (-2.0%)", color=color.new(color.green, 0))
// === 5. 告警条件 ===
alertcondition(premium >= upper,
title="溢价 ≥ 1.5%",
message="Premium Index ≥ 1.5%(永续合约偏高,多头较强)"
)
alertcondition(premium <= lower,
title="溢价 ≤ -2.0%",
message="Premium Index ≤ -2.0%(永续合约偏低,空头压力大)"
)
// === 6. 信息显示 ===
label.new(bar_index, premium, "Premium: " + str.tostring(premium, "#.##") + "%",
style=label.style_label_left, color=color.new(color.blue, 85))
Selected Days Indicator V3-TrDoes the stock drop every Wednesday? Do March months always move similarly? Does the 1st week of the month behave differently?
Do you ever say "it always makes this move in these months"? Don't you want to see more clearly whether it actually makes this move or not? Don't you want to see and test periodically repeating price patterns?
Hisse her Çarşamba düşüyor mu? Mart ayları hep benzer mi hareket ediyor? Ayın 1. haftası farklı mı davranıyor?
Bazen "bu aylarda hep bu hareketi yapıyor" dediğiniz oluyor mu? Gerçekten de bu hareketi yapıp yapmadığını daha net görmek istemez misiniz? Periyodik tekrarlayan fiyat kalıplarını görmek ve test etmek istemiyor musunuz?
1. Problem
Some stocks or crypto assets exhibit systematic behaviors on certain days, weeks, or months. But it's hard to see - everything is mixed together on the chart. This indicator isolates the days/weeks/months you want and shows only them. Hides everything else.
2. How It Works
Three-layer filter: Day (Monday, Tuesday...), Week (1st, 2nd, 3rd week of the month), Month (January, February...). Select what you want, let the rest disappear. Example: Show only Thursdays of March-June-September. Or compare every 1st week of the month. View as candlestick, line, or column chart.
3. What's It Good For?
Test "end-of-month effect". Find "day-of-the-week anomaly". Analyze crypto volatility by days. See seasonality in commodities. Discover patterns specific to your own strategy. Past data doesn't guarantee the future but provides statistical advantage.
