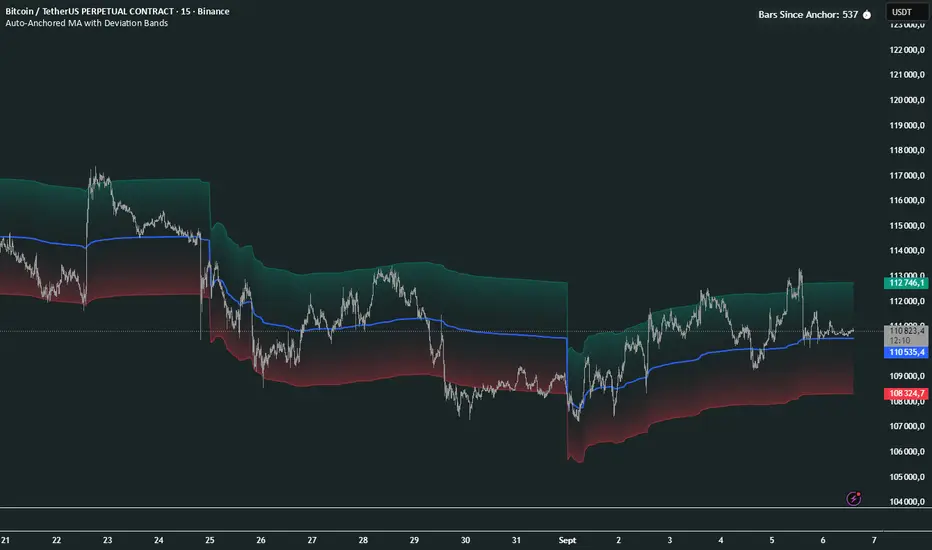
Auto-Anchored MA with Deviation BandsAuto-Anchored MA with Deviation Bands
✨ Features
📈 Auto-Anchored MA: Calculates moving averages (EMA, SMA, EWMA, WMA, VWAP, TEMA) anchored to user-defined periods (Hour, Day, Week, etc.).📏 Deviation Bands: Plots upper/lower bands using Percentage or Standard Deviation modes for volatility analysis.⚙️ Customizable Timeframes: Choose anchor periods from Hour to Year for flexible trend analysis.🎨 Visuals: Displays MA and bands with gradient fills, customizable colors, and adjustable display bars.⏱️ Countdown Table: Shows bars since the last anchor for easy tracking.🛠️ Smoothing: Applies smoothing to bands for cleaner visuals.
🛠️ How to Use
Add to Chart: Apply the indicator on TradingView.
Configure Inputs:
Anchor Settings: Select anchor period (e.g., Day, Week).
MA Settings: Choose MA type (e.g., VWAP, TEMA).
Deviation Settings: Set deviation mode (Percentage/Std Dev) and multipliers.
Display Settings: Adjust bars to display, colors, and gradient fill.
Analyze: View MA, deviation bands, and countdown table on the chart.
Track Trends: Use bands as dynamic support/resistance and monitor anchor resets.
🎯 Why Use It?
Dynamic Analysis: Auto-anchors MA to key timeframes for adaptive trend tracking.
Volatility Insight: Deviation bands highlight potential breakouts or reversals.
Customizable: Tailor MA type, timeframe, and visuals to your trading style.
User-Friendly: Clear visuals and countdown table simplify analysis.
📝 Notes
Ensure sufficient bars for accurate MA and deviation calculations.
Gradient fill enhances readability but can be disabled for simplicity.
Best used with complementary indicators like RSI or Bollinger Bands for robust strategies.
Happy trading! 🚀📈
指標和策略
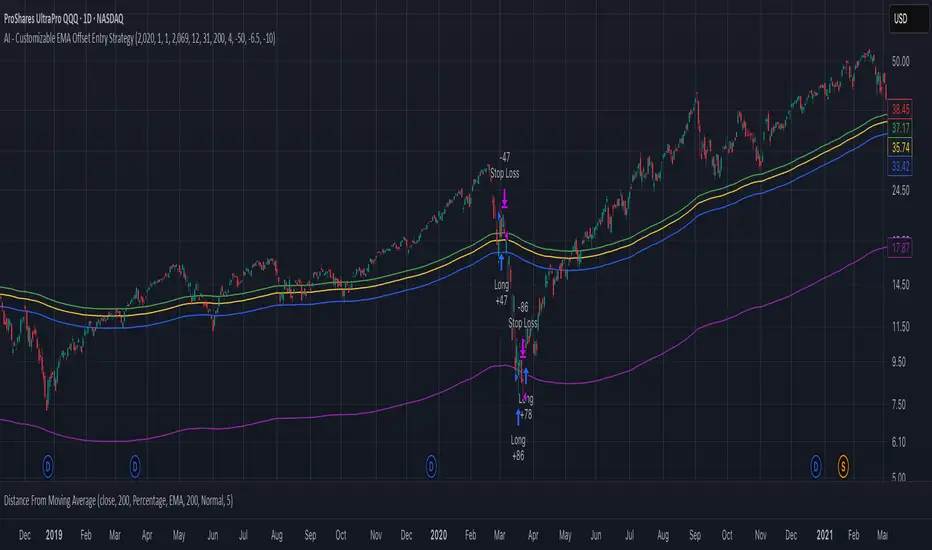
AI - Customizable EMA Offset Entry StrategyMoving average with offsets, such that buy indicators are above the MA and sell indicators are below the MA
MA+BB+LineThis indicator integrates three major components: the MA System, Bollinger Bands, and Chan Theory fractals & segments:
MA System – Utilizes eight moving averages to form a comprehensive MA framework, allowing full customization of both the time periods and the calculation methods.
Bollinger Bands – Provides dynamic volatility tracking and price channel visualization.
Chan Theory Fractals & Segments – Implements a strict-mode automatic segmentation system based on Chan Theory:
Green arrows indicate top fractals
Red arrows indicate bottom fractals
These fractals are used to automatically generate trend segments with precision.

MoneyZone_SmartEleZone of action which helps identify smart money actioned. This bands help identify possible areas to expect action.
Cyclic Reversal Engine [AlgoPoint]Overview
Most indicators focus on price and momentum, but they often ignore a critical third dimension: time. Markets move in rhythmic cycles of expansion and contraction, but these cycles are not fixed; they speed up in trending markets and slow down in choppy conditions.
The Cyclic Reversal Engine is an advanced analytical tool designed to decode this rhythm. Instead of relying on static, lagging formulas, this indicator learns from past market behavior to anticipate when the current trend is statistically likely to reach its exhaustion point, providing high-probability reversal signals.
It achieves this by combining a sophisticated time analysis with a robust price-action confirmation.
How It Works: The Core Logic
The indicator operates on a multi-stage process to identify potential turning points in the market.
1. Market Regime Analysis (The Brain): Before analyzing any cycles, the indicator first diagnoses the current "personality" of the market. Using a combination of the ADX, Choppiness Index, and RSI, it classifies the market into one of three primary regimes:
- Trending: Strong, directional movement.
- Ranging: Sideways, non-directional chop.
- Reversal: An over-extended state (overbought/oversold) where a turn is imminent.
2. Adaptive Cycle Learning (The "Machine Learning" Aspect): This is the indicator's smartest feature. It constantly analyzes past cycles by measuring the bar-count between significant swing highs and swing lows. Crucially, it learns the average cycle duration for each specific market regime. For example, it learns that "in a strong trending market, a new swing low tends to occur every 35 bars," while "in a ranging market, this extends to 60 bars."
3. The Countdown & Timing Signal: The indicator identifies the last major swing high or low and starts a bar-by-bar countdown. Based on the current market regime, it selects the appropriate learned cycle length from its memory. When the bar count approaches this adaptive target, the indicator determines that a reversal is "due" from a timing perspective.
4. Price Confirmation (The Trigger): A signal is never generated based on timing alone. Once the timing condition is met (the cycle is "due"), the indicator waits for a final price-action confirmation. The default confirmation is the RSI entering an extreme overbought or oversold zone, signaling momentum exhaustion. The signal is only triggered when Time + Price Confirmation align.
How to Use This Indicator
- The Dashboard: The panel in the bottom-right corner is your command center.
- Market Regime: Shows the current market personality analyzed by the engine.
- Adaptive Cycle / Bar Count: This is the core of the indicator. It shows the target cycle length for the current regime (e.g., 50) and the current bar count since the last swing point (e.g., 45). The background turns orange when the bar count enters the "due zone," indicating that you should be on high alert for a reversal.
- BUY/SELL Signals: A label appears on the chart only when the two primary conditions are met:
The timing is right (Bar Count has reached the Adaptive Cycle target).
The price confirms exhaustion (RSI is in an extreme zone).
A BUY signal suggests a downtrend cycle is likely complete, and a SELL signal suggests an uptrend cycle is likely complete.
Key Settings
- Pivot Lookback: Controls the sensitivity of the swing point detection. Higher values will identify more significant, longer-term cycles.
- Market Regime Engine: The ADX, Choppiness, and RSI settings can be fine-tuned to adjust how the indicator classifies the market's personality.
- Require Price Confirmation: You can toggle the RSI confirmation on or off. It is highly recommended to keep it enabled for higher-quality signals.


Asset in Every Fiat Currency📌 Description
Asset in Every Fiat Currency is an indicator that expresses the value of any chosen asset across a basket of global fiat currencies.
It uses exchange rates to calculate a weighted aggregate signal, allowing you to see how the asset behaves when priced simultaneously in the world’s most important currencies.
⚖️ Key Features
Choose any asset (default: Gold).
Weighted by major global currencies (USD, EUR, JPY, GBP, CNY, etc.).
Fully customizable weights through user inputs.
Automatic normalization factor for consistent scaling.
🛠️ Use Cases
Compare an asset’s performance beyond the USD lens.
Detect global strength/weakness of an asset in a diversified fiat basket.
Explore alternative ways of viewing asset pricing.
⚠️ Disclaimer: This script is for educational purposes only. It does not constitute financial advice. Always do your own research before making trading decisions.

FRXFORTUNE GOLD ADVANCEThis indicator helps traders analyze gold price reaction after economic news releases.
You can manually input the Actual and Forecast values from news data.
Based on the difference, it shows a side box signal:
- If USD is strong → Gold sell signal
- If USD is weak → Gold buy signal
It also provides alerts when strong reactions are detected.

MS - Çoklu Onay Stratejisi (AL-SAT)"VOLUME, MA50, RSI, DMI, ATR
5 conditions, all turning positive at the same time gives a buy signal; one of them turning negative gives a sell signal. This should be evaluated with weekly data. Not financial advice."

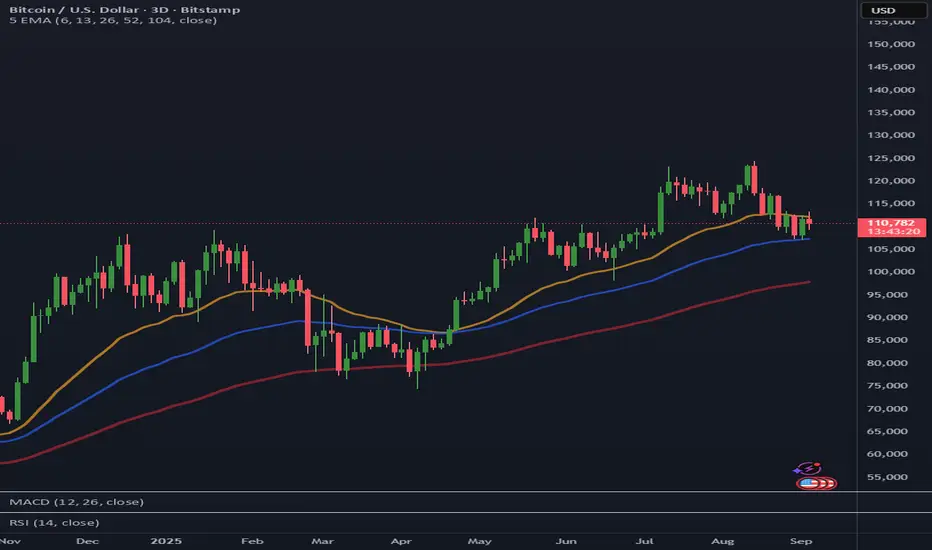
Multiple EMAMultiple EMA Indicator
This script overlays five customizable Exponential Moving Averages (EMAs) on your chart with color styling and transparency matching TradingView’s palette (≈65% opacity).
🔹 Features
Five EMAs with fully customizable lengths (default: 6, 13, 26, 52, 104)
Thicker line weights for longer-term EMAs (26, 52, 104) to emphasize trend bias
Short-term EMAs (6, 13) hidden by default but toggleable in settings
Custom color codes with opacity applied (35% transparency) for a smoother look
Adjustable price source input (close, open, hl2, etc.)
🔹 Best For
Swing traders and trend followers
Traders seeking a clear, color-coded, and visually optimized EMA setup
Consolidated 9-Indicator Buy/Sell Zones & TriggersALL important inductors combined for long term position holders and short term guys...use it to enter trade and exit ...backgroud colour will give you the indication of the market mood..

swapstrategy-Reversal StrategyGenerate buy and sell signals and reverses position when chart turn buy or sell side

BTC 1D — Trend START/END Signals (clean, no repaint)
This strategy is designed primarily for BTC on the daily (1D) timeframe in TradingView.
BUY (start of uptrend)
Fast EMA is above Slow EMA.
Price breaks above the previous Donchian high.
Optional filters (if enabled): volume surge and strong momentum/RSI.
Only one BUY per uptrend—no additional buys until a SELL occurs.
SELL (end of uptrend)
Price falls below the previous Donchian low, or
Price drops below the Slow EMA, or
Momentum flips bearish (DI− > DI+ or RSI ≤ threshold).
One SELL marks the end of the uptrend.

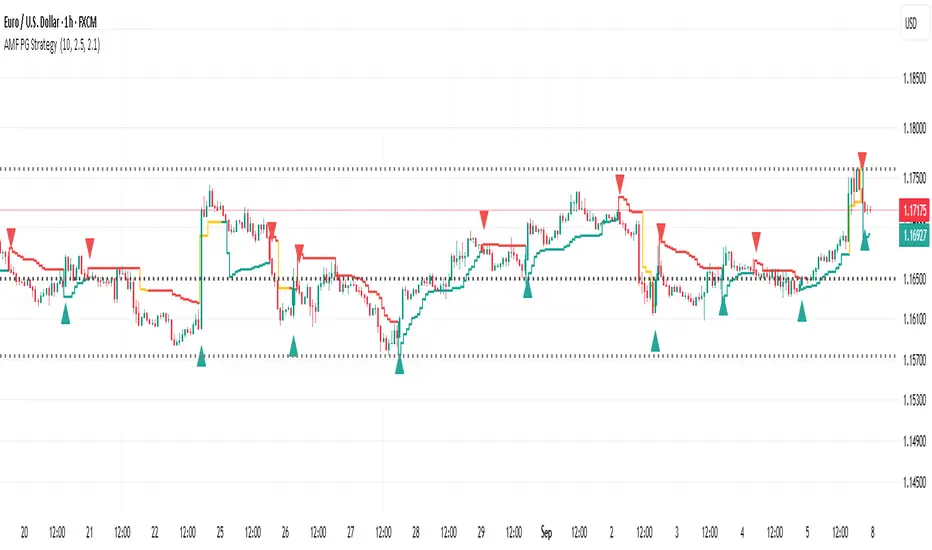
AMF PG Strategy_v2The AMF PG Strategy (Praetorian Guard) is an advanced trading system designed to seamlessly adapt to market conditions. Its unique structure balances precise entries with intelligent protection, giving traders confidence in both trending and volatility environments.
Key points include:
Adaptive Core (AMF Engine) – A dynamic framework that automatically adjusts for clearer long- and short-term opportunities and generates a robust tracking line.
Praetorian Guard – A built-in protective shield that activates in extreme conditions and helps stabilize performance when markets become turbulent.
Versatility – Effective across multiple timeframes, from scalping to swing trading, without constant parameter adjustments.
Clarity – Clear visual signals and color-coded monitoring for instant decision-making.
This strategy is designed for traders who want more than just entries and exits; it offers a command center for disciplined, adaptable, and resilient trading.
Disclaimer:
It should be noted that no strategy is guaranteed. This strategy does not provide buy-sell-hold advice. Responsibility rests with the user.
Version 2: Bugs overlooked in Version 1 have been corrected and improvements have been made.
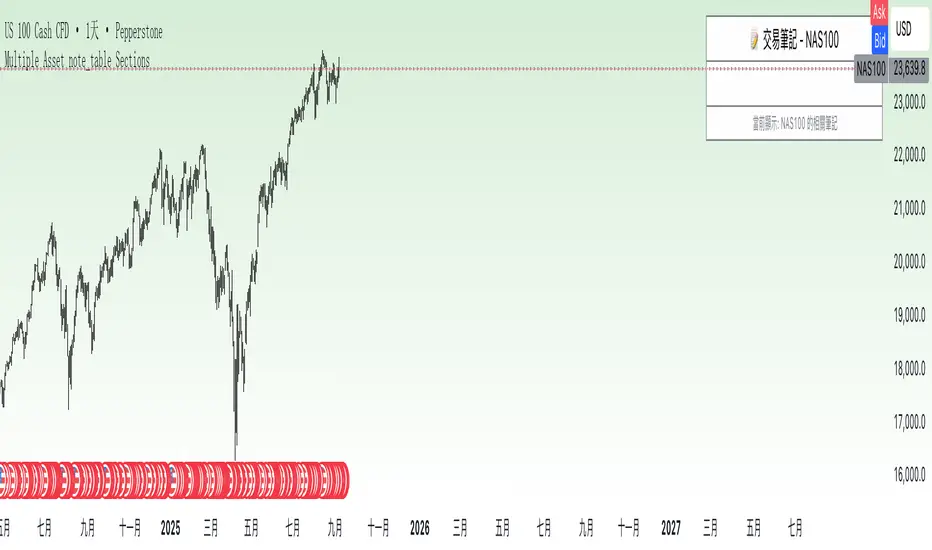
Multiple Asset note_table Sections### Features
- **Expanded to 10 independent Sections**: Each Section has a title, content, and associated asset
- **Asset-based filtering**: Section only displays when the Section's asset name is empty or matches the current chart asset
- **Empty asset setting retained**: If Section asset name is left blank, that Section will display across all assets
- **Automatic display of current asset**: Current asset name is automatically shown in the header and footer
### Usage Instructions
1. Each Section can be assigned a specific asset name, such as "BTCUSDT", "ETHUSDT", etc.
2. A Section will only display when the current chart asset matches the asset specified for that Section
3. If you want a Section to display across all assets, simply leave the asset name blank for that Section
4. Each Section has independent title and content that can be customized as needed
5. When switching to different trading instruments, the indicator automatically displays notes relevant to the current instrument
TEMA Ribbon 9/13/15/21 – Smooth trend shifts, less lag, clearer“TEMA Ribbon 9/13/15/21 – Smooth trend shifts, less lag, clearer bias.”
Plots four Triple Exponential Moving Averages (9, 13, 15, 21) with shaded zones for quick trend visualization. Helps identify short- vs. medium-term momentum shifts with reduced lag compared to standard EMAs.
Recommended Usage:
Best applied on 5M–1H intraday charts for momentum and trend confirmation.
Use the 9 & 13 TEMA for short-term momentum shifts.
Use the 15 & 21 TEMA for medium-term bias.
Look for crossovers and alignment (all fast TEMAs above/below slow ones) to confirm bullish or bearish conditions.
Shaded zones help visualize when the short- and medium-term trends converge or diverge, signaling potential entry or exit points.
Combine the TEMA Ribbon with VWAP or session-based trading (e.g., London/New York Killzones) to filter signals.
Trade only in the direction of VWAP bias (price above VWAP → favor longs, below → favor shorts).
Within Killzones, use TEMA alignment (9/13 above 15/21 = bullish trend, or opposite for bearish) as confirmation before entries.
This reduces false signals and locks entries to periods of high liquidity and volatility, where TEMA shines.
//@version=5
indicator("TEMA 9/13/15/21", overlay=true)
// Quelle
src = close
// Funktion: TEMA
tema(src, length) =>
e1 = ta.ema(src, length)
e2 = ta.ema(e1, length)
e3 = ta.ema(e2, length)
3.0 * e1 - 3.0 * e2 + e3
// TEMA-Berechnung
t9 = tema(src, 9)
t13 = tema(src, 13)
t15 = tema(src, 15)
t21 = tema(src, 21)
// Plots
p9 = plot(t9, "TEMA 9", color=color.teal, linewidth=2)
p13 = plot(t13, "TEMA 13", color=color.aqua, linewidth=2)
p15 = plot(t15, "TEMA 15", color=color.orange, linewidth=2)
p21 = plot(t21, "TEMA 21", color=color.fuchsia, linewidth=2)
// Einfaches Fill (zwischen schnellstem und langsamstem)
fill(p9, p21, color=color.new(color.gray, 85))
fill(p13, p15, color=color.new(color.gray, 92))

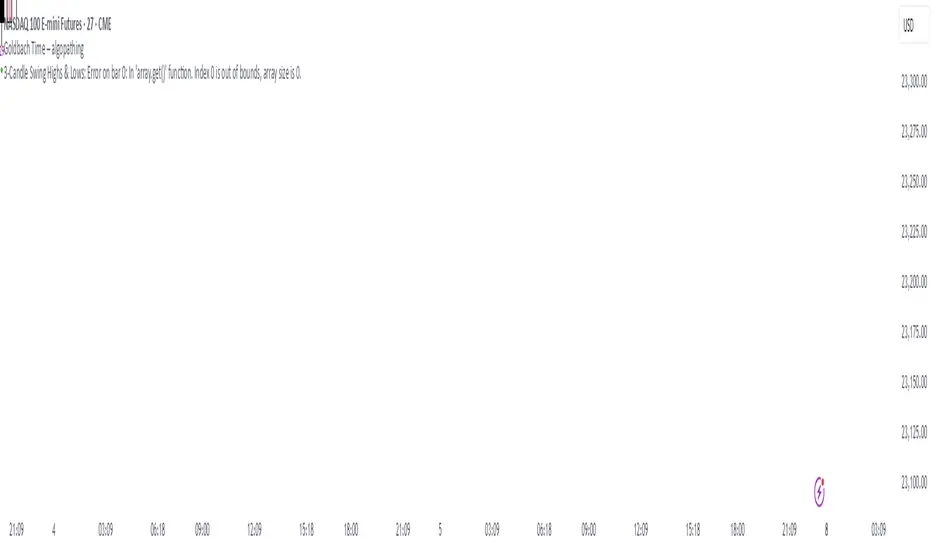
3-Candle Swing Highs & Lows//@version=5
indicator("3-Candle Swing Highs & Lows", overlay=true, max_lines_count=1000)
// Inputs
highColor = input.color(color.red, "Swing High (Unbroken)")
highBreachCol = input.color(color.green, "Swing High (Breached)")
lowColor = input.color(color.blue, "Swing Low (Unbroken)")
lowBreachCol = input.color(color.orange, "Swing Low (Breached)")
// Arrays for storing lines and prices
var line highLines = array.new_line()
var float highPrices = array.new_float()
var line lowLines = array.new_line()
var float lowPrices = array.new_float()
// --- Swing High condition ---
// We check candle (the middle one) against candle and candle
isSwingHigh = high > high and high > high
// --- Swing Low condition ---
isSwingLow = low < low and low < low
// If swing high found (confirmed after bar closes)
if isSwingHigh
newHigh = line.new(bar_index - 1, high , bar_index, high , extend=extend.right, color=highColor, width=2)
array.push(highLines, newHigh)
array.push(highPrices, high )
// If swing low found (confirmed after bar closes)
if isSwingLow
newLow = line.new(bar_index - 1, low , bar_index, low , extend=extend.right, color=lowColor, width=2)
array.push(lowLines, newLow)
array.push(lowPrices, low )
// Update line colours for swing highs
for i = 0 to array.size(highLines) - 1
ln = array.get(highLines, i)
lvl = array.get(highPrices, i)
if close > lvl
line.set_color(ln, highBreachCol)
else
line.set_color(ln, highColor)
// Update line colours for swing lows
for i = 0 to array.size(lowLines) - 1
ln = array.get(lowLines, i)
lvl = array.get(lowPrices, i)
if close < lvl
line.set_color(ln, lowBreachCol)
else
line.set_color(ln, lowColor)

交易区本地时间This is a practical timezone display indicator designed specifically for forex and global market traders, showing real-time current times of three major financial centers in a clear table format at the top-right corner of the chart: Tokyo, New York, and London.
✨ Key Features
🗾 Tokyo Time - Asian trading session reference
🗽 New York Time - American trading session reference
🏛️ London Time - European trading session reference
📅 Complete Date & Time - Display format: MM-DD HH:MM
🔄 Automatic DST - Smart handling of daylight saving time transitions
🎨 Color Coding - Different colors for different timezone identification
⚡ Real-time Updates - Based on current timestamp, accurate with no delay
💼 Use Cases
Forex Traders - Track major financial center opening/closing times
Global Market Analysis - Understand market activity across different timezones
News Trading - Master timing of important economic data releases
Multi-timezone Coordination - Time management tool for international investors
这是一个专为外汇和全球市场交易者设计的实用时区显示指标,在图表右上角以清晰的表格形式实时显示三大主要金融中心的当前时间:东京、纽约和伦敦。
✨ 主要功能
🗾 东京时间 - 亚洲交易时段参考
🗽 纽约时间 - 美洲交易时段参考
🏛️ 伦敦时间 - 欧洲交易时段参考
📅 完整日期时间 - 显示格式:MM-DD HH:MM
🔄 自动夏令时 - 智能处理冬令时/夏令时切换
🎨 色彩区分 - 不同颜色标识不同时区
⚡ 实时更新 - 基于当前时间戳,准确无延迟
💼 适用场景
外汇交易者 - 把握各大金融中心开盘收盘时间
全球市场分析 - 了解不同时区的市场活跃度
新闻交易 - 掌握重要经济数据发布时间
多时区协调 - 国际投资者的时间管理工具

Marubozu Detector with Dynamic SL/TP
Strategy Overview:
This indicator detects a "Marubozu" bullish pattern or a “Marubozu” bearish pattern to suggest potential buy and sell opportunities. It uses dynamic Stop Loss (SL) and Take Profit (TP) management, based on either market volatility (ATR) or liquidity zones.
This tool is intended for educational and informational purposes only.
Key Features:
Entry: Based on detecting Marubozu bullish or bearish candle pattern.
Exit: Targets are managed through ATR multiples or previous liquidity levels (swing highs or swing lows).
Smart Liquidity: Optionally identify deeper liquidity targets.
Full Alerts: Buy and Sell signals supported with customizable alerts.
Visualized Trades: Entry, SL, and TP levels are plotted on the chart.
User Inputs:
ATR Length, ATR Multipliers
Take Profit Mode (Liquidity/ATR)
Swing Lookback and Strength
Toggleable Buy/Sell alerts
All Time Frames
📖 How to Use:
Add the Indicator:
Apply the script to your chart from the TradingView indicators panel.
Look for Buy Signals:
A buy signal is triggered when the script detects a "Marubozu" bullish pattern.
Entry, Stop Loss, and Take Profit levels are plotted automatically.
Look for Sell Signals:
A Sell signal is triggered when the script detects a "Marubozu" bearish pattern.
Entry, Stop Loss, and Take Profit levels are plotted automatically.
Choose Take Profit Mode:
ATR Mode: TP is based on a volatility target.
Liquidity Mode: TP is based on past swing highs.
Set Alerts (Optional):
Enable Buy/Sell alerts in the settings to receive real-time notifications.
Practice First:
Always backtest and paper trade before live use.
📜 Disclaimer:
This script does not offer financial advice.
No guarantees of profit or performance are made.
Use in demo accounts or backtesting first.
Always practice proper risk management and seek advice from licensed professionals if needed.
✅ Script Compliance:
This script is designed in full accordance with TradingView’s House Rules for educational tools.
No financial advice is provided, no performance is guaranteed, and users are encouraged to backtest thoroughly.

sHip Crypto Buy/Sell Pro BTC 15minThis is a 15min BTC buy sell indicator that is made by Ai. Have not tested yet but you can give it a go if you want.
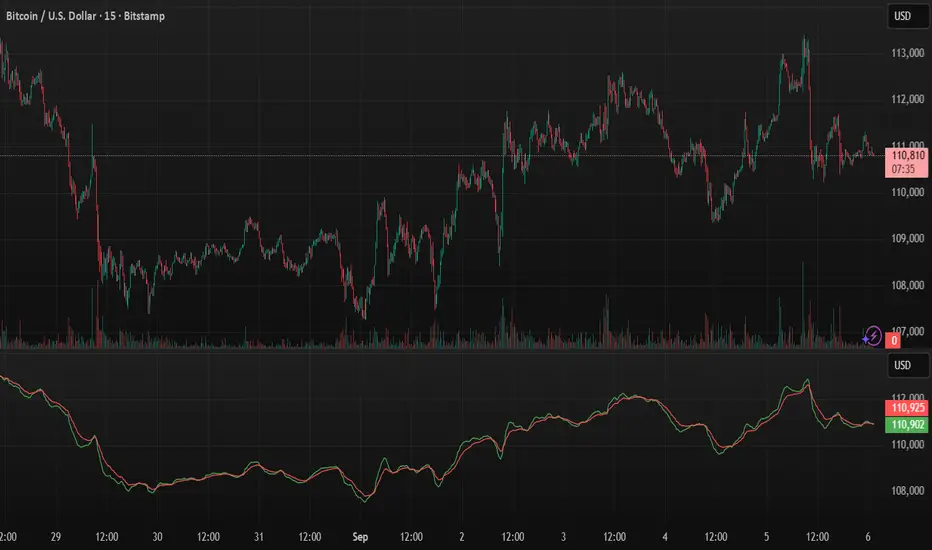
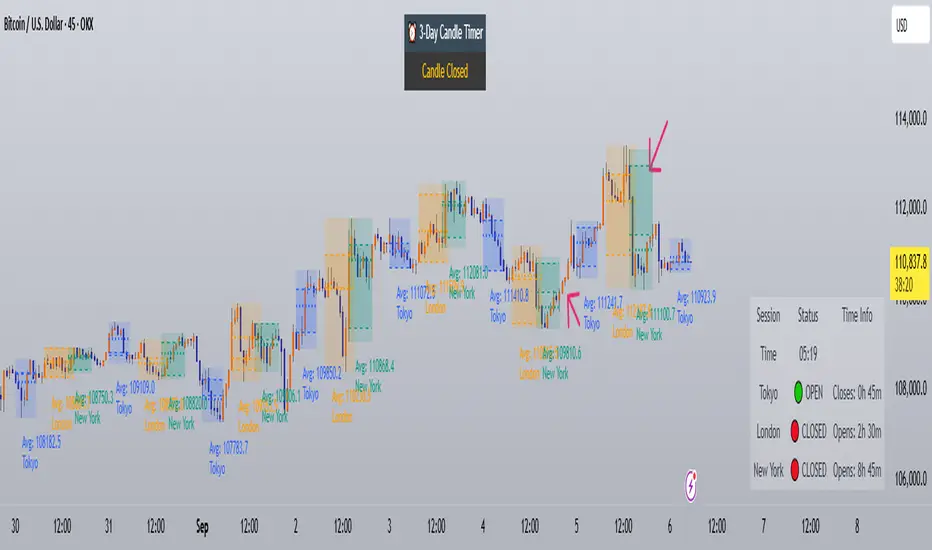
Trading Sessions with Holidays & Timer🌍 Trading Sessions Matter
Markets breathe in cycles. When Tokyo, London, or New York steps in, liquidity shifts and price often reacts fast.
Example: New York closed BTC at $110K, and when traders woke up, the price was already $113K. That gap says everything about overnight pressure and the next move.
⚡ Indicator Features
✅ Session boxes (Tokyo, London, NY) with custom colors & time zones
✅ Open/close lines → spot gaps & momentum
✅ Average price per session → see where pressure builds
✅ Tick range → quick volatility check
✅ 🏖 Holiday markers → avoid false quiet markets
✅ Live status table → session OPEN / CLOSED + countdown timer
🚀 How to Use
Works on intraday timeframes (1m–4h)
Watch session opens/closes → liquidity shift points
Compare ranges & averages between Tokyo, London, NY
Use the timer to prep before the next wave
This tool helps you visualize the heartbeat of global markets session by session.
🔖 #BTCUSDT #Forex #TradingSessions #Crypto #DayTrading
Savitzky-Golay Hampel Filter | AlphaNattSavitzky-Golay Hampel Filter | AlphaNatt
A revolutionary indicator combining NASA's satellite data processing algorithms with robust statistical outlier detection to create the most scientifically advanced trend filter available on TradingView.
"This is the same mathematics that processes signals from the Hubble Space Telescope and analyzes data from the Large Hadron Collider - now applied to financial markets."
━━━━━━━━━━━━━━━━━━━━━━━━━━━━━━━━━━━━━━━━
🚀 SCIENTIFIC PEDIGREE
Savitzky-Golay Filter Applications:
NASA: Satellite telemetry and space probe data processing
CERN: Particle physics data analysis at the LHC
Pharmaceutical: Chromatography and spectroscopy analysis
Astronomy: Processing signals from radio telescopes
Medical: ECG and EEG signal processing
Hampel Filter Usage:
Aerospace: Cleaning sensor data from aircraft and spacecraft
Manufacturing: Quality control in precision engineering
Seismology: Earthquake detection and analysis
Robotics: Sensor fusion and noise reduction
━━━━━━━━━━━━━━━━━━━━━━━━━━━━━━━━━━━━━━━━
🧬 THE MATHEMATICS
1. Savitzky-Golay Filter
The SG filter performs local polynomial regression on data points:
Fits a polynomial of degree n to a sliding window of data
Evaluates the polynomial at the center point
Preserves higher moments (peaks, valleys) unlike moving averages
Maintains derivative information for true momentum analysis
Originally published in Analytical Chemistry (1964)
Mathematical Properties:
Optimal smoothing in the least-squares sense
Preserves statistical moments up to polynomial order
Exact derivative calculation without additional lag
Superior frequency response vs traditional filters
2. Hampel Filter
A robust outlier detector based on Median Absolute Deviation (MAD):
Identifies outliers using robust statistics
Replaces spurious values with polynomial-fitted estimates
Resistant to up to 50% contaminated data
MAD is 1.4826 times more robust than standard deviation
Outlier Detection Formula:
|x - median| > k × 1.4826 × MAD
Where k is the threshold parameter (typically 3 for 99.7% confidence)
━━━━━━━━━━━━━━━━━━━━━━━━━━━━━━━━━━━━━━━━
💎 WHY THIS IS SUPERIOR
vs Moving Averages:
Preserves peaks and valleys (critical for catching tops/bottoms)
No lag penalty for smoothness
Maintains derivative information
Polynomial fitting > simple averaging
vs Other Filters:
Outlier immunity (Hampel component)
Scientifically optimal smoothing
Preserves higher-order features
Used in billion-dollar research projects
Unique Advantages:
Feature Preservation: Maintains market structure while smoothing
Spike Immunity: Ignores false breakouts and stop hunts
Derivative Accuracy: True momentum without additional indicators
Scientific Validation: 60+ years of academic research
━━━━━━━━━━━━━━━━━━━━━━━━━━━━━━━━━━━━━━━━
⚙️ PARAMETER OPTIMIZATION
1. Polynomial Order (2-5)
2 (Quadratic): Maximum smoothing, gentle curves
3 (Cubic): Balanced smoothing and responsiveness (recommended)
4-5 (Higher): More responsive, preserves more features
2. Window Size (7-51)
Must be odd number
Larger = smoother but more lag
Formula: 2×(desired smoothing period) + 1
Default 21 = analyzes 10 bars each side
3. Hampel Threshold (1.0-5.0)
1.0: Aggressive outlier removal (68% confidence)
2.0: Moderate outlier removal (95% confidence)
3.0: Conservative outlier removal (99.7% confidence) (default)
4.0+: Only extreme outliers removed
4. Final Smoothing (1-7)
Additional WMA smoothing after filtering
1 = No additional smoothing
3-5 = Recommended for most timeframes
7 = Ultra-smooth for position trading
━━━━━━━━━━━━━━━━━━━━━━━━━━━━━━━━━━━━━━━━
📊 TRADING STRATEGIES
Signal Recognition:
Cyan Line: Bullish trend with positive derivative
Pink Line: Bearish trend with negative derivative
Color Change: Trend reversal with polynomial confirmation
1. Trend Following Strategy
Enter when price crosses above cyan filter
Exit when filter turns pink
Use filter as dynamic stop loss
Best in trending markets
2. Mean Reversion Strategy
Enter long when price touches filter from below in uptrend
Enter short when price touches filter from above in downtrend
Exit at opposite band or filter color change
Excellent for range-bound markets
3. Derivative Strategy (Advanced)
The SG filter preserves derivative information
Acceleration = second derivative > 0
Enter on positive first derivative + positive acceleration
Exit on negative second derivative (momentum slowing)
━━━━━━━━━━━━━━━━━━━━━━━━━━━━━━━━━━━━━━━━
📈 PERFORMANCE CHARACTERISTICS
Strengths:
Outlier Immunity: Ignores stop hunts and flash crashes
Feature Preservation: Catches tops/bottoms better than MAs
Smooth Output: Reduces whipsaws significantly
Scientific Basis: Not curve-fitted or optimized to markets
Considerations:
Slight lag in extreme volatility (all filters have this)
Requires odd window sizes (mathematical requirement)
More complex than simple moving averages
Best with liquid instruments
━━━━━━━━━━━━━━━━━━━━━━━━━━━━━━━━━━━━━━━━
🔬 SCIENTIFIC BACKGROUND
Savitzky-Golay Publication:
"Smoothing and Differentiation of Data by Simplified Least Squares Procedures"
- Abraham Savitzky & Marcel Golay
- Analytical Chemistry, Vol. 36, No. 8, 1964
Hampel Filter Origin:
"Robust Statistics: The Approach Based on Influence Functions"
- Frank Hampel et al., 1986
- Princeton University Press
These techniques have been validated in thousands of scientific papers and are standard tools in:
NASA's Jet Propulsion Laboratory
European Space Agency
CERN (Large Hadron Collider)
MIT Lincoln Laboratory
Max Planck Institutes
━━━━━━━━━━━━━━━━━━━━━━━━━━━━━━━━━━━━━━━━
💡 ADVANCED TIPS
News Trading: Lower Hampel threshold before major events to catch spikes
Scalping: Use Order=2 for maximum smoothness, Window=11 for responsiveness
Position Trading: Increase Window to 31+ for long-term trends
Combine with Volume: Strong trends need volume confirmation
Multiple Timeframes: Use daily for trend, hourly for entry
Watch the Derivative: Filter color changes when first derivative changes sign
━━━━━━━━━━━━━━━━━━━━━━━━━━━━━━━━━━━━━━━━
⚠️ IMPORTANT NOTICES
Not financial advice - educational purposes only
Past performance does not guarantee future results
Always use proper risk management
Test settings on your specific instrument and timeframe
No indicator is perfect - part of complete trading system
━━━━━━━━━━━━━━━━━━━━━━━━━━━━━━━━━━━━━━━━
🏆 CONCLUSION
The Savitzky-Golay Hampel Filter represents the pinnacle of scientific signal processing applied to financial markets. By combining polynomial regression with robust outlier detection, traders gain access to the same mathematical tools that:
Guide spacecraft to other planets
Detect gravitational waves from black holes
Analyze particle collisions at near light-speed
Process signals from deep space
This isn't just another indicator - it's rocket science for trading .
"When NASA needs to separate signal from noise in billion-dollar missions, they use these exact algorithms. Now you can too."
━━━━━━━━━━━━━━━━━━━━━━━━━━━━━━━━━━━━━━━━
Developed by AlphaNatt
Version: 1.0
Release: 2025
Pine Script: v6
"Where Space Technology Meets Market Analysis"
Not financial advice. Always DYOR
