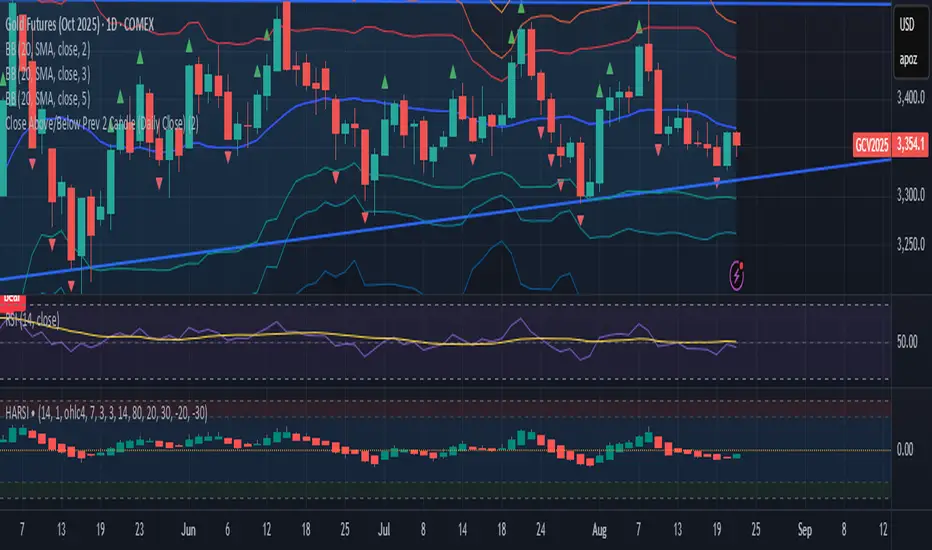
Close Above/Below Prev 2 Candle (Daily Close)This strategy identifies potential trend continuation or breakout signals by analyzing the daily candle closes relative to the previous two daily candles. It generates clear alerts and trade signals only after the daily candle has fully closed, reducing false intraday triggers.
How it works:
Long Entry (Bullish Signal): Triggered when the daily candle closes above the highs of the previous two daily candles.
Short Entry (Bearish Signal): Triggered when the daily candle closes below the lows of the previous two daily candles.
Visual Indicators: Green triangles indicate bullish signals, red triangles indicate bearish signals.
Strategy Features:
Optional long and short entries with configurable risk/reward ratio.
Automatic stop-loss and take-profit calculation based on candle structure.
Works on intraday charts using daily candle analysis.
Alerts:
Alerts trigger only after the daily candle closes above/below the previous two daily candles.
Helps traders receive precise notifications for potential breakout trades.
Benefits:
Reduces noise by using daily candle closes.
Easy to integrate with other swing or trend strategies.
Provides clear visual and alert signals for both bullish and bearish setups.
指標和策略
Strategy Sheet — Customizable 4x8 Table📖 Script Description
The Strategy Sheet — 4 Columns / 8 Rows is a compact and highly customizable table-based tool for traders who want to keep their trading plan, rules, and session settings directly visible on the chart.
🔹 Features:
• Up to 4 fully configurable columns and 8 rows
• Compact UI with per-column color overrides
• Dark / Light / Custom theme modes
• Support for zebra row backgrounds (alternating colors)
• Adjustable position, padding, spacing, and alignment
• Clean layout with borders and header styling
• Perfect for trade plans, ORB setups, session notes, or risk rules
🔹 Use cases:
• Documenting strategy rules directly on chart
• Displaying ORB session times and risk management
• Creating a structured overview of trading setups
• Quick reference without leaving the chart
This script does not generate signals – it’s a visual aid designed to organize and display trading information in a clear and professional way.

PDH/PDL (prev RTH) + Current ETH High/LowDescription:
This indicator automatically plots the key levels of PDH/PDL (Previous Day High/Low from regular trading hours – RTH) and ETH High/Low (Extended Hours: pre-market + after-hours) in real time.
• PDH/PDL: calculated at the close of RTH (09:30–16:00 NYSE) and anchored until the next day.
• ETH High/Low: updated live during extended hours (04:00–09:29 and 16:00–20:00 NYSE) and “frozen” at the RTH open for reference during the regular session.
• Customization options: colors, line styles (solid/dashed/dotted), thickness, labels, and the ability to extend lines to the right.
• Levels can also be displayed directly on the price scale.
This script is designed for traders who want a quick visualization of the most relevant levels from the previous day and extended hours, making it easier to identify supports, resistances, and potential reaction zones in price action.
By: Miguel Arenas

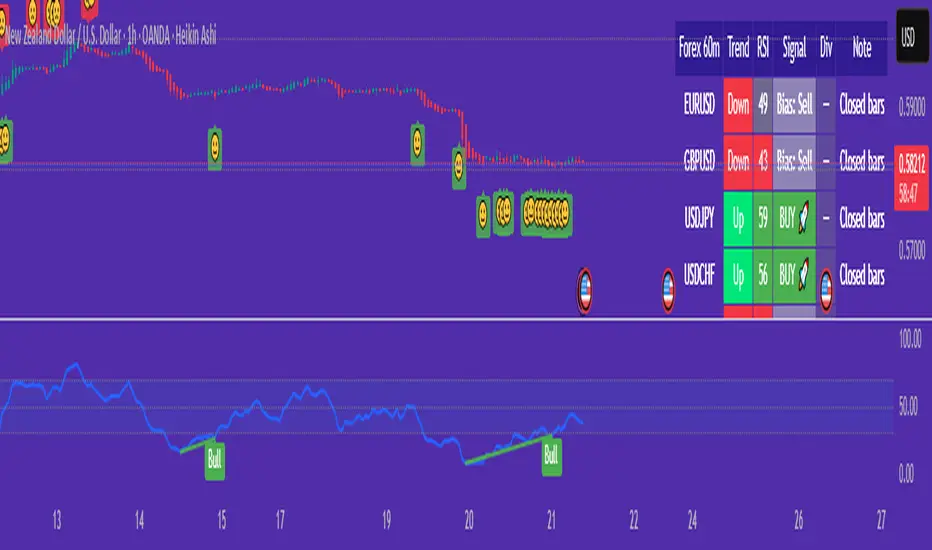
Forex 60m Simple Scanner + RSI Divergence“Forex 60m Simple Scanner + RSI Divergence”
This scanner helps beginner traders quickly identify trade opportunities across the top 10 forex pairs. It combines a simple EMA crossover system with an optional RSI filter to confirm trend direction, and adds RSI divergence detection to spot potential reversals early.
The built-in table shows each pair’s trend, RSI value, buy/sell signal, and divergence status—all in one place.
For beginners, this makes it easier to:
Avoid flipping between multiple charts.
See clear BUY/SELL 🚀 signals instead of guessing.
Spot high-probability setups with RSI divergence markers (😊/☹️).
It simplifies decision-making by turning complex signals into a straightforward dashboard that highlights where attention is needed most.
Forex 5m Simple Scanner + RSI DivergenceHello everyone. this is a easy to use indicator.
I wanted something very easy to visualize and understand. Great for the beginner's.
About this script:
“Forex 5m Simple Scanner + RSI Divergence”
This scanner helps beginner traders quickly identify trade opportunities across the top 10 forex pairs. It combines a simple EMA crossover system with an optional RSI filter to confirm trend direction, and adds RSI divergence detection to spot potential reversals early.
The built-in table shows each pair’s trend, RSI value, buy/sell signal, and divergence status—all in one place.
For beginners, this makes it easier to:
Avoid flipping between multiple charts.
See clear BUY/SELL 🚀 signals instead of guessing.
Spot high-probability setups with RSI divergence markers (😊/☹️).
It simplifies decision-making by turning complex signals into a straightforward dashboard that highlights where attention is needed most.

HH&LL / MSS Detector [Tek Tek Teknik Analiz]This indicator provides a safe trading opportunity by drawing Market Structure Shift levels to determine the direction of the market after capturing the peaks and valleys in the price flow.

Momentum Breakout StrategyBacktest a strategy where, when a candlestick on a timeframe rises more than a certain %, it enters a trade.

> 50% Body Candle A script that give the number of ATR of a candle. Good to mesure how explosive a move is.

Smart Money SignalsSmart Money Signals – Market Flow & Structure Visualizer
Overview
Smart Money Signals is a precision trading tool designed for traders who want to see market structure and momentum flow in real time. By detecting pivots, momentum imbalances, and dynamic support/resistance levels, the indicator transforms raw price action into a clear visual narrative of where capital is entering and exiting the market.
Instead of lagging averages or cluttered signals, Smart Money Signals highlights the moments that matter most—where bullish and bearish flows are confirmed, where support or resistance breaks, and where momentum zones show the true battleground between buyers and sellers. Its adaptive design makes it equally effective for scalpers seeking sharp entries, swing traders tracking reversals, and longer-term traders looking for confirmation of bias.
How It Works
The engine behind Smart Money Signals relies on swing detection and a configurable sensitivity filter. By monitoring directional momentum across recent bars, the system identifies bullish pivots (where downside exhaustion flips into strength) and bearish pivots (where upward thrust collapses into weakness).
When price confirms a pivot, the indicator draws flow lines to mark the breakout and labels them as either continuation or reversal events, depending on existing market bias. Momentum zones are automatically plotted, highlighting the critical areas where buyers defended price or sellers pressed it lower.
Dynamic support and resistance levels extend forward in time, updating live as price develops. These zones change color when broken, visually signaling whether structure has held or failed. Gradient background shading further emphasizes moments of extreme momentum, such as overbought or oversold surges, so that traders instantly see when market pressure intensifies.
Signals and Market Flows
Smart Money Signals provides visual cues that are both intuitive and actionable:
📈 Bullish Flow Signals appear when price breaks above a confirmed pivot, signaling continuation or reversal into strength.
📉 Bearish Flow Signals appear when price breaks below a confirmed pivot, indicating continuation or reversal into weakness.
Momentum Zones highlight the defended areas between pivots, giving traders a visual map of where structure is strongest.
Dynamic Support & Resistance lines extend across the chart, shifting from defense to failure when broken, ensuring that the most relevant levels are always visible.
Break Signals mark the exact bar where key levels give way, confirming structural violations in real time.
By filtering out noise and focusing on meaningful flow events, the system helps traders avoid overreaction and focus only on high-probability structural shifts.
Strategy Integration
Smart Money Signals is versatile across trading styles:
Trend Continuation : Enter in the direction of flow signals, using dynamic zones as both confirmation and stop-loss placement.
Reversal Trading : Watch for pivots tagged as reversal points, where market bias flips and new structure is created.
Momentum Zone Entries : Use the automatically drawn zones to identify low-risk entries on pullbacks or retests.
Bias Alignment : The integrated dashboard reveals the current market bias—bullish, bearish, or neutral—helping traders stay aligned with the dominant flow.
Stop-losses can be positioned beyond the dynamic zone on the opposite side, while take-profits may be guided by the width of zones or momentum-driven extensions. On higher timeframes, the indicator provides context for macro structure, while lower timeframes allow for tactical entry refinement.
Advanced Techniques
Traders seeking deeper precision can combine Smart Money Signals with volume or order flow tools to validate pivots and zone defenses. Monitoring the sequence of bullish and bearish flows helps identify trend maturity, while analyzing the success rate of pivots in the analytics panel builds a data-driven approach to confidence in signals.
Adjusting swing period and sensitivity allows the indicator to adapt to different market conditions, from volatile crypto pairs to steady forex majors. The flexible visual themes—Cyber, Ocean, Sunset, Matrix—ensure readability across setups, while gradient shading keeps the chart intuitive even under fast-moving conditions.
Why Use Smart Money Signals
Markets are driven by liquidity, momentum, and structure. Smart Money Signals uncovers these forces by translating price action into a clear visual map of flow. It shows:
Where structure was built.
Where it was defended.
Where it was broken.
And where momentum is likely to carry next.
By combining flow detection, dynamic zones, and a live analytics dashboard, the indicator provides traders with a complete framework for reading price action in real time.
Whether you trade crypto, forex, or indices, Smart Money Signals adapts seamlessly to any asset class, giving you clarity, precision, and confidence to execute without second-guessing.

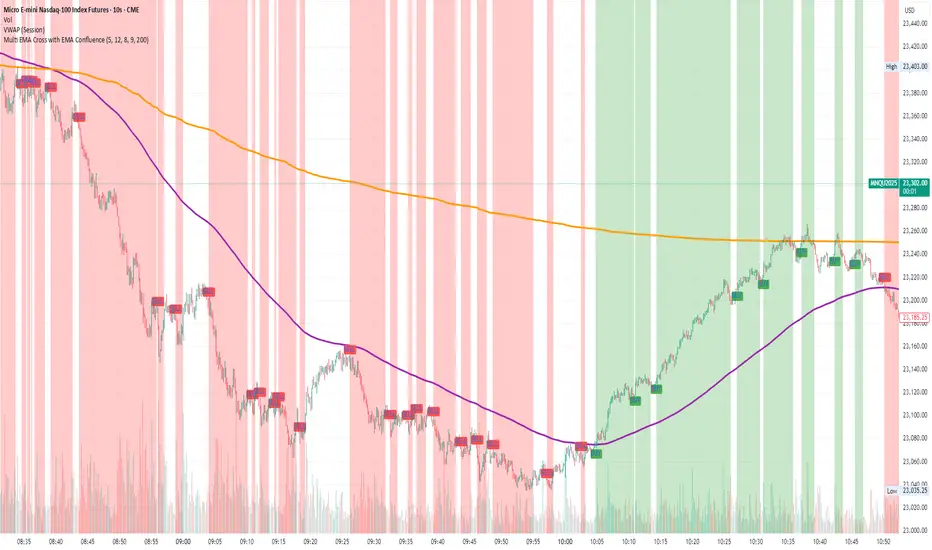
Multi EMA Cross with EMA ConfluenceMulti EMA Cross with EMA Confluence
This indicator combines the power of multiple EMA crossovers with a higher-timeframe confluence filter to help traders visualize potential bullish and bearish conditions on their charts.
Two groups of EMAs work together to establish alignment:
Group 1 (Fast / Slow Pair) – Shorter-term momentum shifts
Group 2 (Fast / Slow Pair) – Broader trend confirmation
On top of that, an optional Confluence EMA (default 200 EMA) acts as an additional filter, ensuring that signals align with the larger market trend.
Key features:
Customizable EMA lengths, colors, and confluence settings
Background highlighting when conditions align bullish or bearish
Clear buy/sell labels when new conditions trigger
Flexible enough to adapt across timeframes and trading styles
This tool is designed to enhance chart clarity and help you stay aligned with momentum and trend. It is not meant to replace your own analysis but rather to complement it.
Disclaimer: This script is for educational and informational purposes only. It is not financial advice. Trading involves risk, and you should always do your own research or consult with a licensed financial professional before making investment decisions.
Krish.Tradess - FX market masterit will help you to identify market sessions and identify overlapping sessions in market. You can mark your trading
CVD Absorption + Confirmation [Orderflow & Volume]This indicator detects bullish and bearish absorption setups by combining Cumulative Volume Delta (CVD) with price action, candlestick, and volume confirmations.
🔹 What is Absorption?
Absorption happens when aggressive buyers/sellers push CVD to new highs or lows, but price fails to follow through.
Bearish absorption: CVD makes a higher high, but price does not.
Bullish absorption: CVD makes a lower low, but price does not.
This often signals that limit orders are absorbing aggressive market orders, creating potential reversal points.
🔹 Confirmation Patterns
Absorption signals are only shown if they are validated by one of the following patterns:
Engulfing candle with low volume → reversal faces little resistance.
Engulfing candle with high volume → strong aggressive participation.
Pin bar with high volume → absorption visible in the wick.
CVD flattening / slope reversal → shift in aggressive order flow.
🔹 Signals
✅ Bullish absorption confirmed → Green label below the bar.
❌ Bearish absorption confirmed → Red label above the bar.
Each label represents a potential reversal setup after orderflow absorption is validated.
🔹 Alerts
Built-in alerts are included for both bullish and bearish confirmations, so you can track setups in real-time without watching the chart 24/7.
📌 How to Use:
Best applied at key levels (supply/demand, VWAP, OR, liquidity zones).
Look for confluence with your trading strategy before taking entries.
Works on all markets and timeframes where volume is reliable.

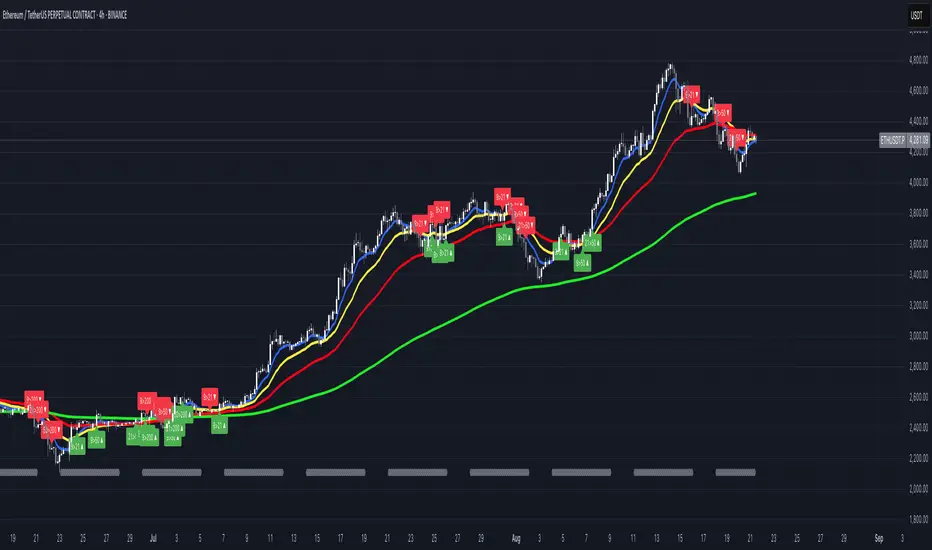
FUMO MA Cross Matrix 9/21/50/100/200 FUMO MA Cross Matrix is a flexible and advanced indicator designed for traders who rely on moving average crossovers as part of their strategy.
🔹 Key Features:
Supports 5 types of Moving Averages: EMA, SMA, SMMA (RMA), WMA, HMA.
Includes 5 standard MAs: 9, 21, 50, 100, 200 (toggle on/off individually).
Choose which MA crosses to monitor (9×21, 21×50, 50×100, 100×200, and 6 extended combinations).
On-chart signals (labels) when crosses occur.
Alerts system for every selected cross and also summary alerts (“Any Cross Up/Down”).
Option to trigger signals only on confirmed bars (no repaint).
Fully adjustable label visibility and signal style.
🔹 Use Cases:
Detect trend shifts (short-term vs long-term).
Build scalping, swing, or position trading strategies.
Combine with price action or volume analysis for stronger setups.
Quickly react to Golden Cross and Death Cross events.
🔹 How to Use:
Select your preferred MA type (EMA, SMA, etc.).
Enable the MAs (9, 21, 50, 100, 200) you want to plot.
Choose which crossovers to track in the settings.
Enable/disable on-chart labels for better visualization.
Set up alerts:
“CROSS UP/DOWN X>Y” for specific pairs.
“ANY CROSS UP/DOWN” for aggregated signals.
📌 Example Alerts
MA Cross UP 9>21 on BTCUSDT 15m @ 65432
Any selected MA cross DOWN on AAPL 1D @ 195.2
Trend Bar MarkerThis indicator identifies and highlights strong trend candles based on configurable body ratio, ATR multiplier, IBS range, and minimum price difference. It supports drawing lines for open, close, high, low, and midpoint levels, with customizable color, style, and extension. Marked candles can be color-coded for bullish and bearish bars, and optional shape markers can be added for quick visualization of strong trend positions.

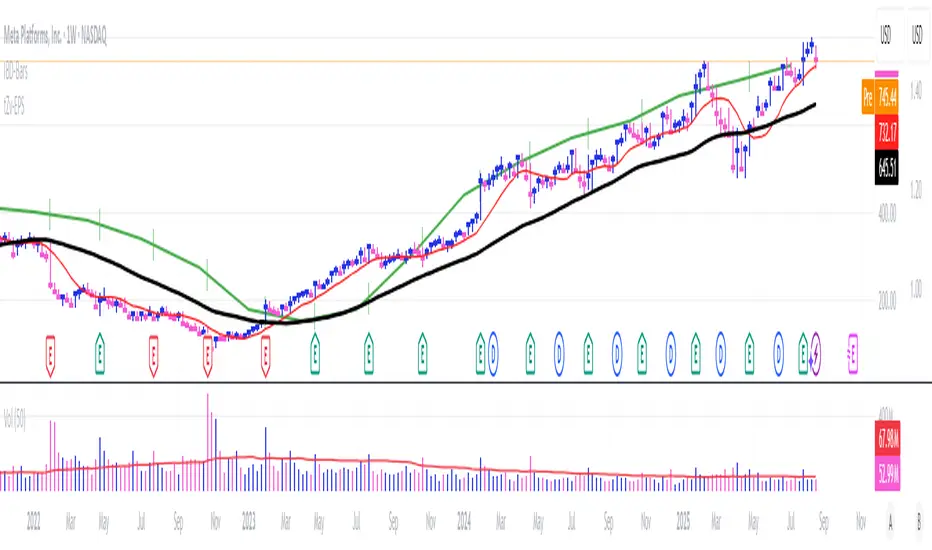
MarketSurge EPS Line [tradeviZion]MarketSurge EPS Line
EPS trend line overlay for TradingView charts, inspired by the IBD MarketSurge (formerly MarketSmith) EPS line style.
Displays EPS trend line on price charts
Uses 4-quarter earnings moving average
Shows earnings momentum over time
Works with actual, estimated, or standardized earnings data
Customizable line color and width
This script creates an EPS trend line overlay, similar to the EPS line feature in IBD MarketSurge (previously MarketSmith), allowing you to visualize earnings trends alongside price action.
Add script to chart
EPS line appears automatically
Adjust color and width in settings if needed
Hover over line for earnings details
Settings:
EPS data type (actual/estimate/standardized)
Line color and width
💡 Tip:
For the complete IBD Style experience, pair this EPS line with IBD Style Candles to visualize price action with clean bars like IBD Style
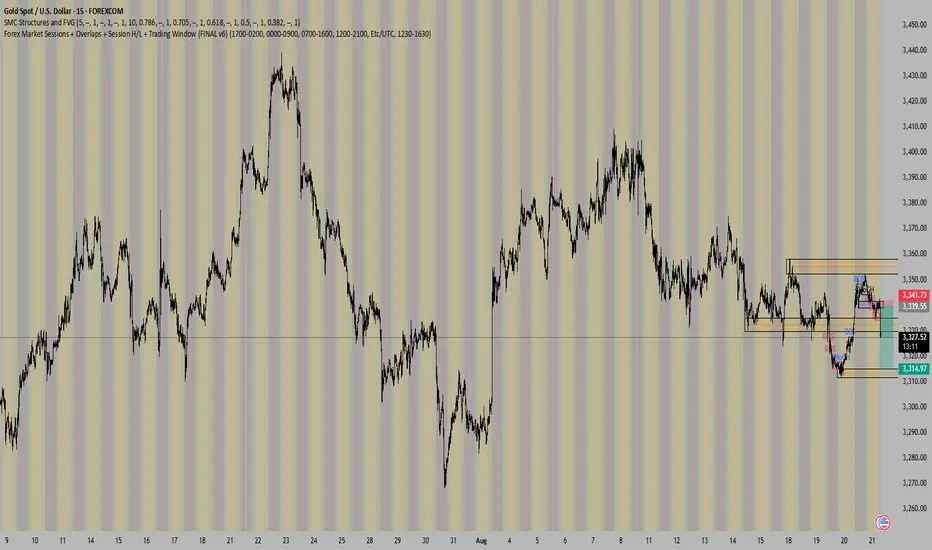
Three-Step 9:30 Range Scalping# Three-Step 9:30 Range Scalping Strategy Rules
## Step 1: Mark the Levels (9:30 AM)
- Wait for the **first 5-minute candle** starting at 9:30 AM EST to close
- Mark the **HIGH** and **LOW** of this candle
- Switch to **1-minute chart** for trading
## Step 2: Find Your Entry (Trade for 1 hour only: 9:30-10:30 AM)
### BREAK Entry
- Need: **Fair Value Gap (FVG)** + **ANY** of the 3 FVG candles closes outside the range
- FVG = Gap between candle wicks (3-candle pattern)
### TRAP Entry
- Need: Break outside range → Retest back inside → Close back outside again
### REVERSAL Entry
- Need: Failed break in one direction → Opposite FVG back into the range
## Step 3: Trade Management
### Stop Loss:
- **Break/Trap**: Low/High of first candle that closed outside the range
- **Reversal**: Low/High of first candle in the FVG pattern
### Take Profit:
- **Always 2:1 risk-to-reward ratio**
- If you risk $100, you make $200
## Key Rules:
- ✅ **Body close** outside range (not just wicks)
- ✅ Trade on **1-minute chart** only
- ✅ Only trade **first hour** (9:30-10:30 AM EST)
- ✅ **Fixed 2:1** take profit every time
- ✅ One strategy, stay consistent
**That's it. No complicated indicators, no higher timeframe bias, no guesswork.**

Forward P/E CalculatorI could not find a forward P/E indicator that gave me proper results. So here is mine.

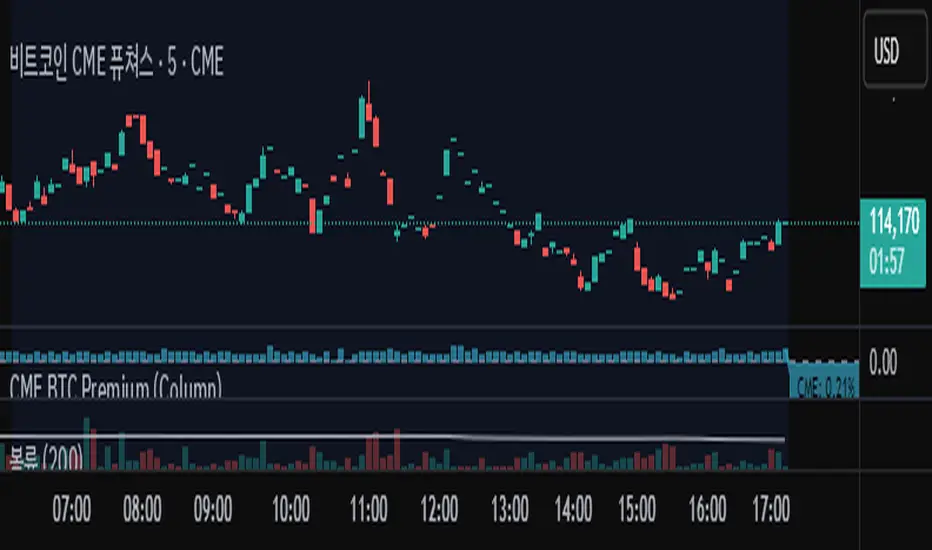
Bitcoin cme gap indicators, BINANCE vs CME exchanges premium gap
# CME BTC Premium Indicator Documentation CME:BTC1!
## 1. Overview
Indicator Name: CME BTC Premium
Platform: TradingView (Pine Script v6)
Type: Premium / Gap Analysis
Purpose:
* Visualize the CME BTC futures premium/discount relative to Binance BTCUSDT spot price.
* Detect gap-up or gap-down events on the daily chart.
* Assess short-term market sentiment and potential volatility through price discrepancies.
## 2. Key Features
1. CME Premium Calculation
* Formula:
CME Premium(%) = ((CME Price - Binance Price) / Binance Price) X 100
* Positive premium: CME futures are higher than spot → Color: Blue
* Negative premium: CME futures are lower than spot → Color: Purple
2. Premium Visualization Options
* `Column` (default)
* `Line`
3. Daily Gap Detection (Daily Chart Only)
* Gap Up: CME open > previous high × 1.0001 (≥ 0.01%)
* Gap Down: CME open < previous low × 0.9999 (≤ 0.01%)
* Visualization:
* Bar Color:
* Gap Up → Yellow (semi-transparent)
* Gap Down → Blue (semi-transparent)
* Background Color:
* Gap Up → Yellow (semi-transparent)
* Gap Down → Blue (semi-transparent)
4. Label Display
* If `Show CME Label` is enabled, the last bar displays a premium percentage label.
* Label color matches premium color; text color: Black.
* Style: `style_label_upper_left`, Size: `small`.
## 3. User Inputs
| Option Name | Description | Type / Default |
| -------------- | ------------------------- | --------------------------------------- |
| Show CME Label | Display CME premium label | Boolean / true |
| CME Plot Type | CME premium chart style | String / Column (Options: Column, Line) |
## 4. Data Sources
| Data Item | Symbol | Description |
| ------------- | ---------------- | ----------------------------- |
| Binance Price | BINANCE\:BTCUSDT | Spot BTC price |
| CME Price | CME\:BTC1! | CME BTC futures closing price |
| CME Open | CME\:BTC1! | CME BTC futures open price |
| CME Low | CME\:BTC1! | CME BTC futures low price |
| CME High | CME\:BTC1! | CME BTC futures high price |
## 5. Chart Display
1. Premium Column/Line
* Displays the CME premium percentage in real-time.
* Color: Premium ≥ 0 → Blue, Premium < 0 → Purple
2. Zero Line
* Indicates CME futures are at parity with spot for quick visual reference.
3. Gap Highlight
* Applied only on daily charts.
* Gap-up or gap-down is highlighted using bar and background colors.
4. Label
* Shows the latest CME premium percentage for quick monitoring.
## 6. Use Cases
* Analyze spot-futures premium to gauge CME market sentiment.
* Identify short-term volatility and potential trend reversals through daily gaps.
* Combine premium and gap analysis to support altcoin trend analysis and position strategy.
## 7. Limitations
* This indicator does not provide investment advice or trading recommendations; it is for informational purposes only.
* Data delays, API restrictions, or exchange differences may result in calculation discrepancies.
* Gap detection is meaningful only on daily charts; other timeframes may not provide valid signals.
ChopScore📝 Script Description: ChopScore – Candle-Based Choppiness Indicator
The ChopScore indicator helps traders assess the cleanliness and quality of recent price action by analyzing the relationship between candle body size and overall candle range (high-low).
Unlike traditional volatility or trend indicators, ChopScore does not assume trend direction. Instead, it focuses on how "clean" or "choppy" the price movement is, helping traders spot scrips and environments prone to shakeouts, fakeouts, or stop hunts.
📊 How It Works:
Calculates a custom choppiness score based on the ratio of the candle body to its full range (wicks included).
A smoothed average is plotted over a user-defined lookback period
.
The current score is displayed in a table on the chart, with colors indicating the choppiness level:
🔵 < 50: Cleaner price action (lower shakeout risk)
🟢 50–54.99: Moderate
🟠 55–59.99: Messier price action
🔴 ≥ 60: Very choppy (high shakeout potential)
⚙️ Inputs:
Lookback Period – Controls how many bars are used for averaging the choppiness.
Table Position – Choose where the score appears on the chart.
🎯 Use Case:
Use ChopScore to:
Identify scrips where price action is clean and decisive (e.g., safer entries).
Avoid scrips noise and shakeout potential.
Complement trend/momentum indicators without confusing direction with structure.
📌 Notes:
This script is for educational purposes and does not provide buy/sell signals.
Always confirm with additional tools or analysis before trading decisions.

BTC Evaluation IndicatorBTC Evaluation Indicator
The BTC Evaluation Indicator is a volatility-based tool designed to help traders evaluate Bitcoin’s price behavior relative to its moving average trend. It combines customizable moving averages with dynamic standard deviation bands to identify overbought and oversold conditions.
Key Features
Flexible Moving Averages: Choose between SMA, EMA, WMA, VWMA, HMA, or RMA for the baseline trend.
Dynamic Volatility Bands: Upper and lower bands are calculated using standard deviation, scaled by a user-defined multiplier.
Visual Clarity:
Orange line = central moving average (trend mean)
Green line = upper band (potential overbought zone)
Red line = lower band (potential oversold zone)
Shaded gray area = volatility range
Automatic Highlights: Background shading marks when price breaks above the upper band (overbought) or below the lower band (oversold).
How to Use
When price pushes above the upper band, it may indicate overextension or potential local overbought conditions.
When price falls below the lower band, it may signal undervaluation or potential oversold conditions.
The mean line acts as a dynamic equilibrium, often serving as short-term support/resistance.
This indicator is designed for Bitcoin evaluation, but it can be applied to any asset. By combining trend analysis with volatility context, it helps traders better understand when price may be stretched and when conditions are reverting to the mean.

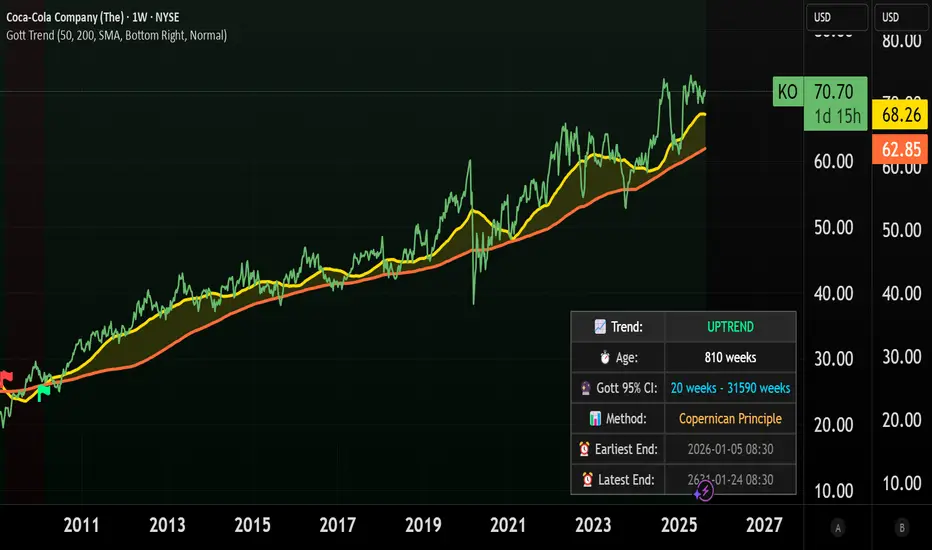
Gott's Copernican Trend PredictorThe Gott's Copernican Trend Predictor predicts trend duration using the Copernican Principle - Based on astrophysicist Richard Gott's temporal prediction method.
I had the idea to create this indicator after reading the book The Doomsday Calculation by William Poundstone.
Background & Theory
This indicator implements J. Richard Gott III's Copernican Principle - a statistical method that famously predicted the fall of the Berlin Wall and the duration of Broadway shows with remarkable accuracy.
The Copernican Principle Explained
Named after Copernicus who showed that Earth is not at the center of the universe, this principle assumes that you are not observing something at a special moment in time. When you observe a trend at any random point, you're statistically more likely to be seeing it during the "middle portion" of its lifetime rather than at its very beginning or end.
The Mathematics
Gott's formula provides a 95% confidence interval for how much longer a trend will continue:
Minimum remaining duration = Current Age ÷ 39
Maximum remaining duration = Current Age × 39
The factor of 39 comes from statistical analysis where:
There's only a 2.5% chance you're observing in the first 1/40th of the trend's life
There's only a 2.5% chance you're observing in the last 1/40th of the trend's life
This gives us 95% confidence that the trend will last between Age/39 and Age×39
How It Works
Trend Detection
The indicator uses dual moving averages (default: 50 & 200 period) to identify trend changes:
Bullish Cross: Fast MA crosses above Slow MA → Uptrend begins
Bearish Cross: Fast MA crosses below Slow MA → Downtrend begins
Real-Time Predictions
Once a trend is detected, the indicator continuously calculates:
Trend Age: How long the current trend has been active
Gott's 95% CI: Statistical range for remaining trend duration
Projected End Dates: Calendar dates when the trend might end
How to Use
Setup
Add the indicator to any timeframe (works on minutes, hours, days, weeks)
Customize MA periods and type (SMA, EMA, WMA)
Choose table position and font size for optimal viewing
Interpretation
Example: If a trend is 100 hours old:
Minimum duration: 100 ÷ 39 = ~3 more hours
Maximum duration: 100 × 39 = ~3,900 more hours
95% confidence: The trend will end between these times
This indicator might be useful for swing traders, trend followers, and quantitative analysts.
Coca-Cola example:
Coca-Cola's chart shows an uptrend spanning 810 weeks, approximately 15.5 years. According to Gott's Copernican Principle, this trend age generates a 95% confidence interval predicting the trend will continue for a minimum of 20 weeks and a maximum of 31,590 weeks.
On the other hand, a shorter trend age produces a proportionally smaller minimum duration and different risk profile in terms of statistical continuation probability. For this reason, more recent trends (and more recent companies) are likely to remain in trend for shorter.
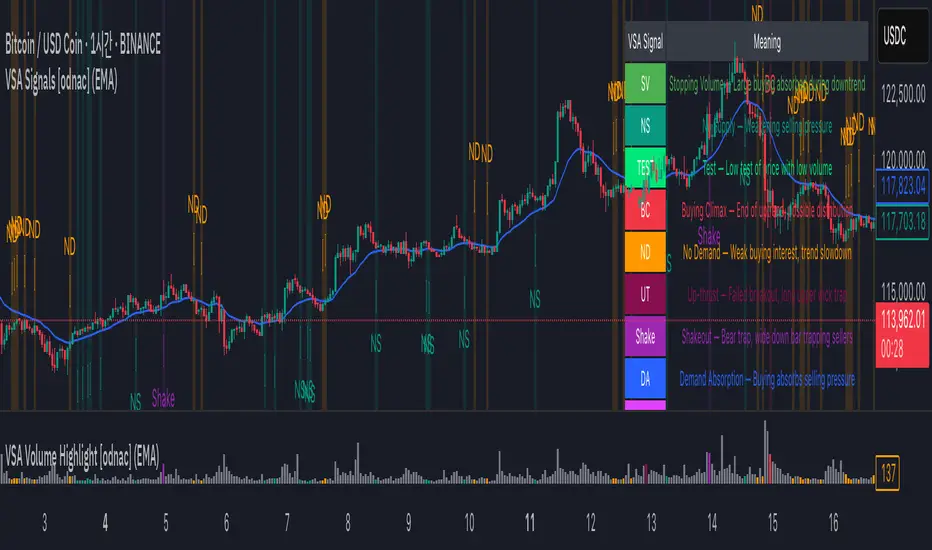
VSA Signals [odnac]This indicator applies Volume Spread Analysis (VSA) concepts to highlight important supply and demand events directly on the chart. It automatically detects common VSA patterns using price spread, relative volume, and candle structure, with optional trend filtering for higher accuracy.
Features:
Stopping Volume (SV): Signals potential end of a downtrend when heavy buying appears.
Buying Climax (BC): Indicates exhaustion of an uptrend with heavy volume near the top.
No Supply (NS): Weak selling pressure, often a bullish sign in an uptrend.
No Demand (ND): Weak buying interest, often a bearish sign in a downtrend.
Test: Low-volume test bar probing for supply.
Up-thrust (UT): Failed breakout with long upper wick, often a bearish trap.
Shakeout: Bear trap with high-volume wide down bar closing low.
Demand Absorption (DA): Demand absorbing heavy selling pressure.
Supply Absorption (SA): Supply absorbing heavy buying pressure.
Additional Options:
Background highlights for detected signals.
Configurable moving average (SMA, EMA, WMA, VWMA) as a trend filter.
Adjustable multipliers for volume and spread sensitivity.
Legend table for quick reference of signals and meanings.
Alerts available for all signals.
This tool is designed to help traders spot professional accumulation and distribution activity and to improve trade timing by recognizing supply/demand imbalances in the market.
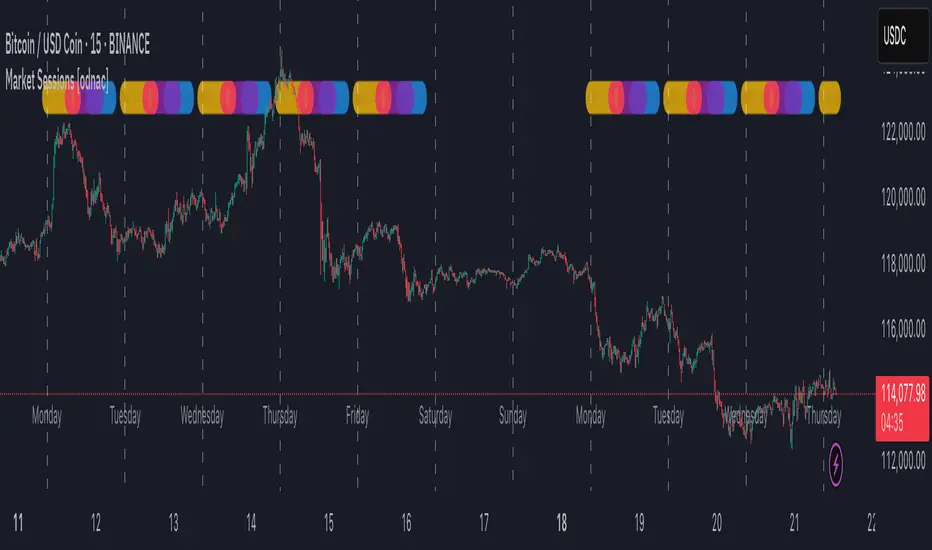
Market Sessions [odnac]
This indicator highlights the three main global market sessions (USA, Europe, Asia) and their overlaps directly on the chart.
It helps traders quickly identify active trading periods and potential high-liquidity overlaps.
Features:
Customizable start and end times for each session
Optional daily dividers with weekday labels
Session markers displayed as circles above the candles
Overlap sessions displayed in distinct colors
Adjustable opacity for better chart visibility
Option to hide weekends
Sessions included:
USA Market Session (default 13:30–20:00 UTC)
Europe Market Session (default 07:00–16:00 UTC)
Asia Market Session (default 00:00–09:00 UTC)
Overlaps: USA + Europe, USA + Asia, Europe + Asia
This tool is designed for intraday timeframes (1m–60m) and can be useful for scalping, day trading, or session-based strategies.