taLibrary "ta"
This library is a Pine Script™ programmer’s tool containing calcs for my oscillators and some helper functions.
buoyancy(src, targetPeriod, maxLookback)
Calculates buoyancy using a target of `src` summed over `targetPeriod` bars, not searching back farther than `maxLookback` bars. See:
Parameters:
src : (series float) The source value that is summed to constitute the target.
targetPeriod : (series int) The qty of bars to sum `src` for in order to calculate the target.
maxLookback : (simple int) The maximum number of bars back the function will search.
Returns: (series float) Buoyancy: the gap between the avg distance of past up and dn bars added to reach the target, divided by the max distance reached. Returns zero when an error condition occurs.
efficientWork(length)
Calculates Efficient Work on `length` bars. See:
Parameters:
length : (simple int) The length of the ALMA used to calculate the result.
Returns: (series float) A -1 to +1 value representing the efficiency of price travel, bar to bar.
ma(type, src, length)
Returns the `type` MA of the `src` over the `length`.
Parameters:
type : (simple string) The type of MA required (uses constants that must be defined earlier in the script).
src : (series float) The source value used to calculate the MA.
length : (simple int) The length value used to calculate the MA.
Returns: (series float) The MA value.
divergenceChannel(divergence, hiSrc, loSrc, breachHiSrc, breachLoSrc)
Calculates the levels and states of divergence channels, which are created when divergences occur.
Parameters:
divergence : (series bool) `true` on divergences, which can be defined any way. On breached channels it creates a new channel, otherwise, channel levels are expanded.
hiSrc : (series float) The price source used to set the channel's hi level when a divergence occurs.
loSrc : (series float) The price source used to set the channel's lo level when a divergence occurs.
breachHiSrc : (series float) The price source that must breach over the channel's `channelHi` level for a breach to occur.
breachLoSrc : (series float) The price source that must breach under the channel's `channelLo` level for a breach to occur.
Returns: A tuple containing the following values:
sourceStrToFloat(srcString)
Converts the name of a source in the `srcString` to its numerical equivalent.
Parameters:
srcString : (series string) The string representing the name of the source value to be returned.
Returns: (series float) The source's value.
指標和策略

fastlog2Library "fastlog2"
Description:
Returns the approximation of Log2 with the maximal error of: 0.000061011436
Reference:
www.anycodings.com
fastlog2(x)
Returns the approximation of Log2 with the maximal error of: 0.000061011436
Parameters:
x : float
Returns: float, log2 of x

EconomicCalendarLibrary "EconomicCalendar"
This library is a data provider for important dates and times from the Economic Calendar.
events()
Returns the list of dates supported by this library as a string array.
Returns: array : Names of events supported by this library
fomcMeetings()
Gets the FOMC Meeting Dates. The FOMC meets eight times a year to determine the course of monetary policy. The FOMC announces its decision on the federal funds rate at the conclusion of each meeting and also issues a statement that provides information on the economic outlook and the Committee's assessment of the risks to the outlook.
Returns: array : FOMC Meeting Dates as timestamps
fomcMinutes()
Gets the FOMC Meeting Minutes Dates. The FOMC Minutes are released three weeks after each FOMC meeting. The Minutes provide information on the Committee's deliberations and decisions at the meeting.
Returns: array : FOMC Meeting Minutes Dates as timestamps
ppiReleases()
Gets the Producer Price Index (PPI) Dates. The Producer Price Index (PPI) measures the average change over time in the selling prices received by domestic producers for their output. The PPI is a leading indicator of CPI, and CPI is a leading indicator of inflation.
Returns: array : PPI Dates as timestamps
cpiReleases()
Gets the Consumer Price Index (CPI) Rekease Dates. The Consumer Price Index (CPI) measures changes in the price level of a market basket of consumer goods and services purchased by households. The CPI is a leading indicator of inflation.
Returns: array : CPI Dates as timestamps
csiReleases()
Gets the CSI release dates. The Consumer Sentiment Index (CSI) is a survey of consumer attitudes about the economy and their personal finances. The CSI is a leading indicator of consumer spending.
Returns: array : CSI Dates as timestamps
cciReleases()
Gets the CCI release dates. The Conference Board's Consumer Confidence Index (CCI) is a survey of consumer attitudes about the economy and their personal finances. The CCI is a leading indicator of consumer spending.
Returns: array : CCI Dates as timestamps
nfpReleases()
Gets the NFP release dates. Nonfarm payrolls is an employment report released monthly by the Bureau of Labor Statistics (BLS) that measures the change in the number of employed people in the United States.
Returns: array : NFP Dates as timestamps

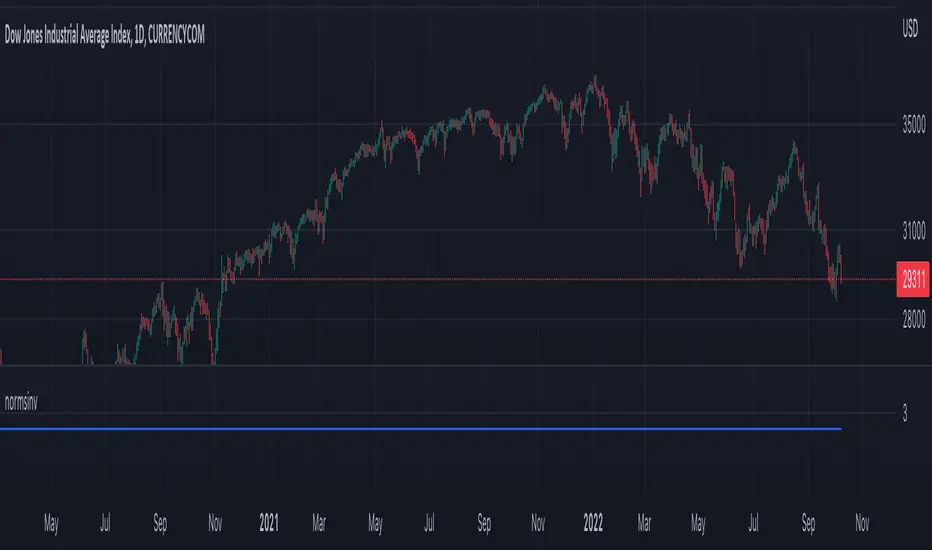
normsinvLibrary "normsinv"
Description:
Returns the inverse of the standard normal cumulative distribution.
The distribution has a mean of zero and a standard deviation of one; i.e.,
normsinv seeks that value z such that a normal distribtuion of mean of zero
and standard deviation one is equal to the input probability.
Reference:
github.com
normsinv(y0)
Returns the inverse of the standard normal cumulative distribution. The distribution has a mean of zero and a standard deviation of one.
Parameters:
y0 : float, probability corresponding to the normal distribution.
Returns: float, z-score
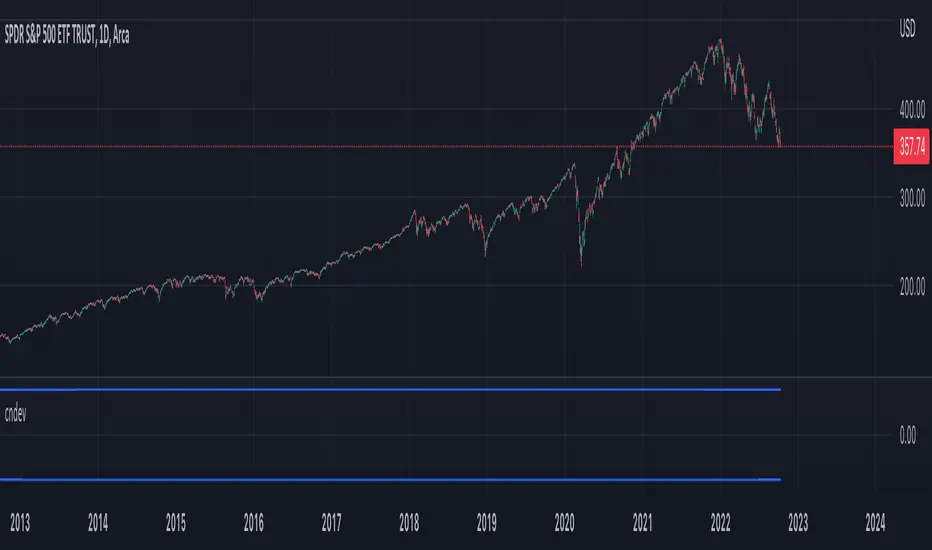
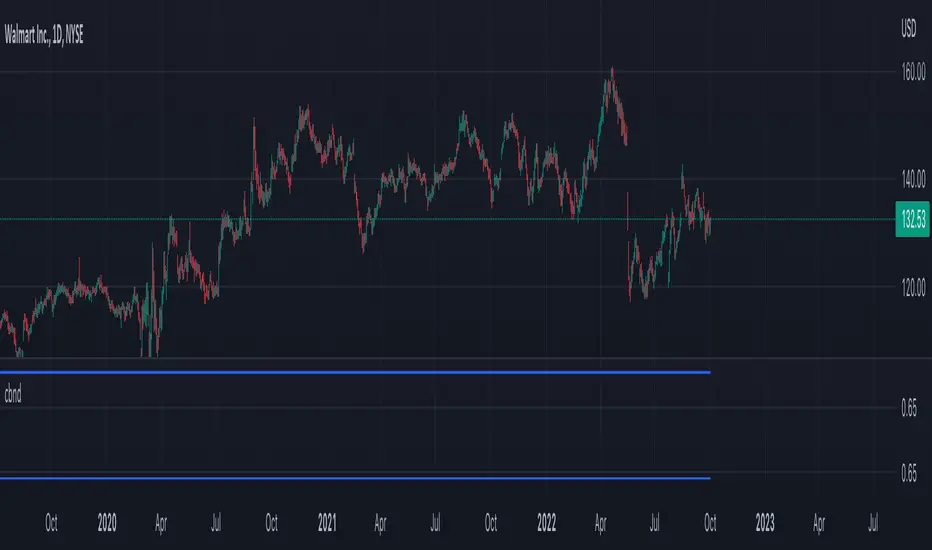
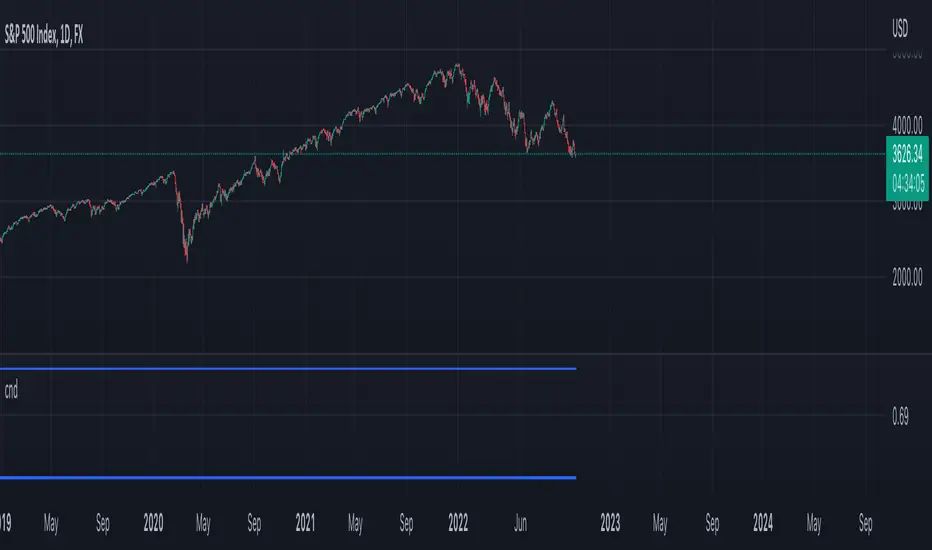
cndevLibrary "cndev"
This function returns the inverse of cumulative normal distribution function
Reference:
The Full Monte, by Boris Moro, Union Bank of Switzerland . RISK 1995(2)
CNDEV(U)
Returns the inverse of cumulative normal distribution function
Parameters:
U : float,
Returns: float.
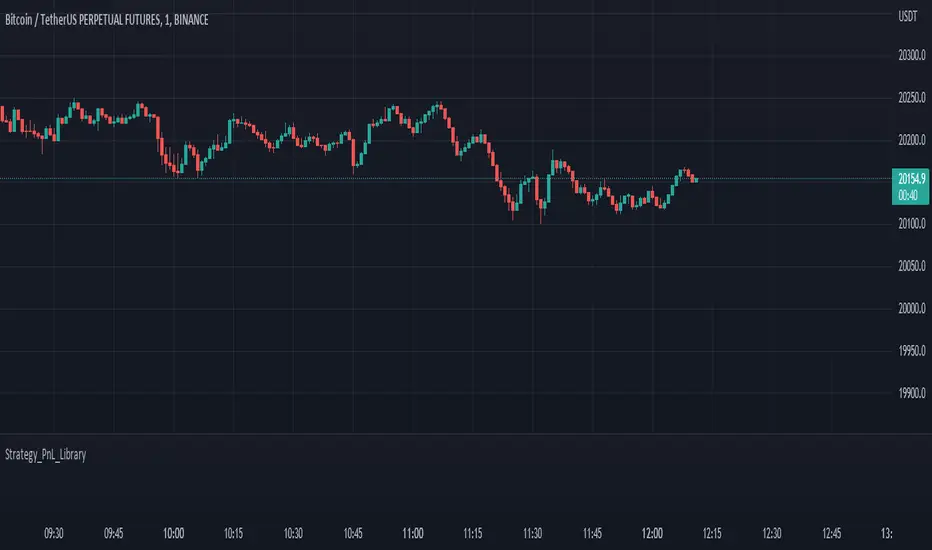
Strategy PnL LibraryLibrary "Strategy_PnL_Library"
TODO: This is a library that helps you learn current pnl of open position and use it to create your own dynamic take profit or stop loss rules based on current level of your profit. It should only be used with strategies.
inTrade()
inTrade: Checks if a position is currently open.
Returns: bool: true for yes, false for no.
notInTrade()
inTrade: Checks if a position is currently open. Interchangeable with inTrade but just here for simple semantics.
Returns: bool: true for yes, false for no.
pnl()
pnl: Calculates current profit or loss of position after the commission. If the strategy is not in trade it will always return na.
Returns: float: Current Profit or Loss of position, positive values for profit, negative values for loss.
entryBars()
entryBars: Checks how many bars it's been since the entry of the position.
Returns: int: Returns a int of strategy entry bars back. Minimum value is always corrected to 1 to avoid lookback errors.
pnlvelocity()
pnlvelocity: Calculates the velocity of pnl by following the change in open profit compared to previous bar. If the strategy is not in trade it will always return na.
Returns: float: Returns a float value of pnl velocity.
pnlacc()
pnlacc: Calculates the acceleration of pnl by following the change in profit velocity compared to previous bar. If the strategy is not in trade it will always return na.
Returns: float: Returns a float value of pnl acceleration.
pnljerk()
pnljerk: Calculates the jerk of pnl by following the change in profit acceleration compared to previous bar. If the strategy is not in trade it will always return na.
Returns: float: Returns a float value of pnl jerk.
pnlhigh()
pnlhigh: Calculates the highest value the pnl has reached since the start of the current position. If the strategy is not in trade it will always return na.
Returns: float: Returns a float highest value the pnl has reached.
pnllow()
pnllow: Calculates the lowest value the pnl has reached since the start of the current position. If the strategy is not in trade it will always return na.
Returns: float: Returns a float lowest value the pnl has reached.
pnldev()
pnldev: Calculates the deviance of the pnl since the start of the current position. If the strategy is not in trade it will always return na.
Returns: float: Returns a float deviance value of the pnl.
pnlvar()
pnlvar: Calculates the variance value of the pnl since the start of the current position. If the strategy is not in trade it will always return na.
Returns: float: Returns a float variance value of the pnl.
pnlstdev()
pnlstdev: Calculates the stdev value of the pnl since the start of the current position. If the strategy is not in trade it will always return na.
Returns: float: Returns a float stdev value of the pnl.
pnlmedian()
pnlmedian: Calculates the median value of the pnl since the start of the current position. If the strategy is not in trade it will always return na.
Returns: float: Returns a float median value of the pnl.
ctndLibrary "ctnd"
Description:
Double precision algorithm to compute the cumulative trivariate normal distribution
found in A.Genz, Numerical computation of rectangular bivariate and trivariate normal
and t probabilities”, Statistics and Computing, 14, (3), 2004. The cumulative trivariate
normal is needed to price window barrier options, see G.F. Armstrong, Valuation formulae
or window barrier options”, Applied Mathematical Finance, 8, 2001.
References:
link.springer.com
www.tandfonline.com
citeseerx.ist.psu.edu
The Complete Guide to Option Pricing Formulas, 2nd ed. (Espen Gaarder Haug)
CTND(LIMIT1, LIMIT2, LIMIT3, SIGMA1, SIGMA2, SIGMA3)
Returns the Cumulative Trivariate Normal Distribution
Parameters:
LIMIT1 : float,
LIMIT2 : float,
LIMIT3 : float,
SIGMA1 : float,
SIGMA2 : float,
SIGMA3 : float,
Returns: float.

AkselitoLibraryLibrary "AkselitoLibrary"
TODO: add library description here
fun(x)
TODO: add function description here
Parameters:
x : TODO: add parameter x description here
Returns: TODO: add what function returns
hi()

combinLibrary "combin"
Description:
The combin function is a the combination function
as it calculates the number of possible combinations for two given numbers.
This function takes two arguments: the number and the number_chosen.
For example, if the number is 5 and the number chosen is 1,
there are 5 combinations, giving 5 as a result.
Reference:
ideone.com
support.microsoft.com
combin(n, kin)
Returns the number of combinations for a given number of items. Use to determine the total possible number of groups for a given number of items.
Parameters:
n : int, The number of items.
kin : int, The number of items in each combination.
Returns: int.

norminvLibrary "norminv"
Description:
An inverse normal distribution is a way to work backwards
from a known probability to find an x-value. It is an informal term and
doesn't refer to a particular probability distribution. Returns the
value of the inverse normal distribution function for a specified value,
mean, and standard deviation.
Reference:
github.com
support.microsoft.com
norminv(x, mean, stdev)
Returns the value of the inverse normal distribution function for a specified value, mean, and standard deviation.
Parameters:
x : float, The input to the normal distribution function.
mean : float, The mean (mu) of the normal distribution function
stdev : float, The standard deviation (sigma) of the normal distribution function.
Returns: float.

cbndLibrary "cbnd"
Description:
A standalone Cumulative Bivariate Normal Distribution (CBND) functions that do not require any external libraries.
This includes 3 different CBND calculations: Drezner(1978), Drezner and Wesolowsky (1990), and Genz (2004)
Comments:
The standardized cumulative normal distribution function returns the probability that one random
variable is less than a and that a second random variable is less than b when the correlation
between the two variables is p. Since no closed-form solution exists for the bivariate cumulative
normal distribution, we present three approximations. The first one is the well-known
Drezner (1978) algorithm. The second one is the more efficient Drezner and Wesolowsky (1990)
algorithm. The third is the Genz (2004) algorithm, which is the most accurate one and therefore
our recommended algorithm. West (2005b) and Agca and Chance (2003) discuss the speed and
accuracy of bivariate normal distribution approximations for use in option pricing in
ore detail.
Reference:
The Complete Guide to Option Pricing Formulas, 2nd ed. (Espen Gaarder Haug)
CBND1(A, b, rho)
Returns the Cumulative Bivariate Normal Distribution (CBND) using Drezner 1978 Algorithm
Parameters:
A : float,
b : float,
rho : float,
Returns: float.
CBND2(A, b, rho)
Returns the Cumulative Bivariate Normal Distribution (CBND) using Drezner and Wesolowsky (1990) function
Parameters:
A : float,
b : float,
rho : float,
Returns: float.
CBND3(x, y, rho)
Returns the Cumulative Bivariate Normal Distribution (CBND) using Genz (2004) algorithm (this is the preferred method)
Parameters:
x : float,
y : float,
rho : float,
Returns: float.
cndLibrary "cnd"
Cumulative Normal Distribution
CND1(x)
Returns the Cumulative Normal Distribution (CND) using the Hart (1968) method. (preferred method, 14-18 decimal accuracy)
Parameters:
x : float,
Returns: float.
CND2(x)
Returns the Cumulative Normal Distribution (CND) using the Abromowitz and Stegun (1974) Polynomial Approximation.
Parameters:
x : float,
Returns: float.
CND3(x)
Returns the Cumulative Normal Distribution (CND) using Newton-Cotes method, Boole’s rule
Parameters:
x : float,
Returns: float.
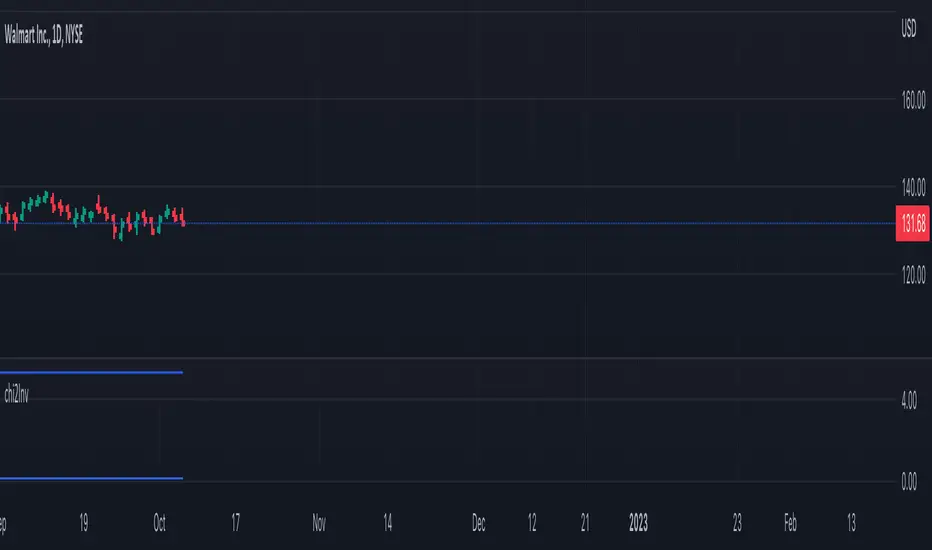
chi2InvLibrary "chi2Inv"
chi2Inv(p, n)
Returns the inverse cumulative distribution function (icdf) of the chi-square distribution with degrees of freedom nu, evaluated at the probability values in p. Goldstein approximation
Parameters:
p : float, probability
n : float, degress of freedom source.
Returns: float.
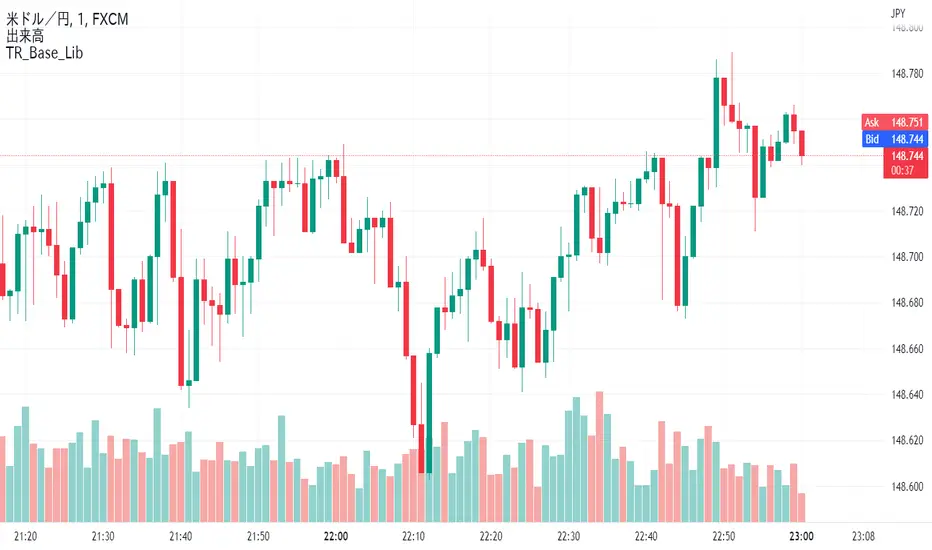
TR_Base_LibLibrary "TR_Base_Lib"
TODO: add library description here
SetHighLowArray()
ChangeHighLowArray()
ShowLabel(_Text, _X, _Y, _Style, _Size, _Yloc, _Color)
TODO: Function to display labels
Parameters:
_Text : TODO: text (series string) Label text.
_X : TODO: x (series int) Bar index.
_Y : TODO: y (series int/float) Price of the label position.
_Style : TODO: style (series string) Label style.
_Size : TODO: size (series string) Label size.
_Yloc : TODO: yloc (series string) Possible values are yloc.price, yloc.abovebar, yloc.belowbar.
_Color : TODO: color (series color) Color of the label border and arrow
Returns: TODO: No return values
GetColor(_Index)
TODO: Function to take out 12 colors in order
Parameters:
_Index : TODO: color number.
Returns: TODO: color code
Tbl_position(_Pos)
TODO: Table display position function
Parameters:
_Pos : TODO: position.
Returns: TODO: Table position
Tbl_position_JP(_Pos)
TODO: テーブル表示位置 日本語表示位置を定数に変換
Parameters:
_Pos : TODO: 日本語表示位置
Returns: TODO: _result:表示位置の定数を返す
TfInMinutes(_Tf)
TODO: 足変換、TimeFrameを分に変換
Parameters:
_Tf : TODO: TimeFrame文字
Returns: TODO: _result:TimeFrameを分に変換した値、_chartTf:チャートのTimeFrameを分に変換した値
TfName_JP(_tf)
TODO: TimeFrameを日本語足名に変換して返す関数 引数がブランクの時はチャートの日本語足名を返す
Parameters:
_tf : TODO: TimeFrame文字
Returns: TODO: _result:日本語足名
DeleteLine()
TODO: Delete Line
Parameters:
: TODO: No parameter
Returns: TODO: No return value
DeleteLabel()
TODO: Delete Label
Parameters:
: TODO: No parameter
Returns: TODO: No return value
SetSessionTimesLibrary "SetSessionTimes"
Indian exchanage time session library, might be useful to code indicator or strategy necessary to call exchange trading sessions at NSE and MCX.
SetSessionTimes()

SetSessionTimesIndiaLibrary "SetSessionTimesIndia"
This library might be useful to code an indicator or strategy that requires to call Indian trading sessions at NSE and MCX.
SetSessionTimes()
