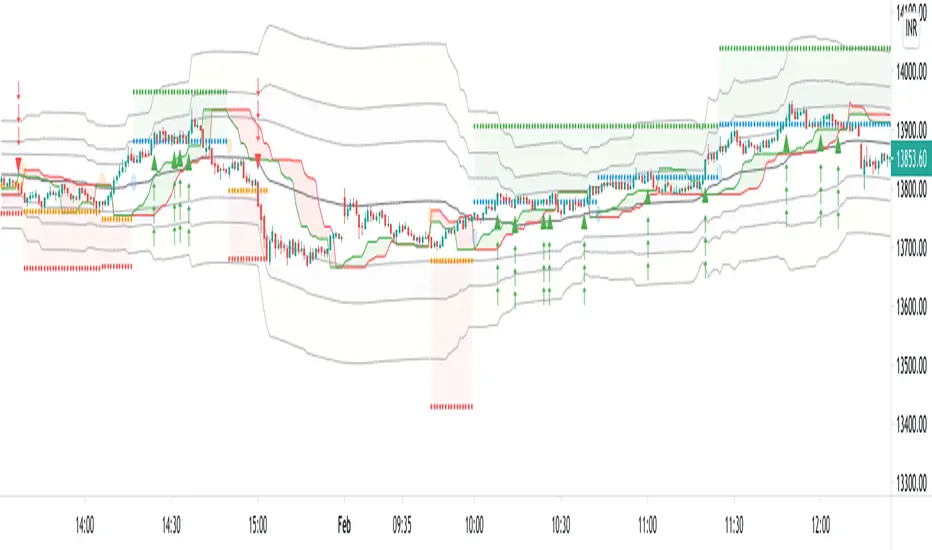
Ultimate Prime Hyper Oscillator Pro [TraderCloud]추세, 변동성, 모멘텀, 평균회귀 모든 분석과 원리를 분석할 수 있는 최고의 오실레이터.
맨 상단에는 고래의 매수와 매도 시그널을 보여준다.
중간에는 rsi, mfi, rci, cci 등의 과열/과냉 지표를 로지스틱 회귀 평활화로 복합 운영하는 종합 모멘텀 오실레이터이다. 단기, 중기, 장기 이렇게 3가지의 기간별 다이버전스와 히든 다이버전스를 시각화한다.
또한 오실레이터 중간에 있는 히스토그램은 lazybear의 squeeze momentum oscillator를 기반으로 제작한 히스토그램 지표이다.
주요 변동성 오실레이터 바로 상/하단에는 히스토그램과 UPO 오실레이터의 추세가 동일하거나, 잠재성을 가질 때를 시각화해서 보여준다.
아래에는 중단기 추세를 Chop Zone 형식으로 시각화해서 보여준다.
아래 얇은 막대의 자잘 자잘한 신호들은 중단기적 평균회귀 구간을 보여준다.
마지막으로 테이블은 타임별 오실레이터의 추세를 간략화해서 정리해준다.
“The ultimate oscillator capable of analyzing all aspects of trend, volatility, momentum, and mean reversion.”
At the very top, it displays whale buy and sell signals.
In the middle, it functions as a comprehensive momentum oscillator that combines and smooths overbought/oversold indicators such as RSI, MFI, RCI, and CCI through logistic regression. It visualizes three types of divergences — short-term, mid-term, and long-term — as well as hidden divergences.
The histogram located in the center of the oscillator is based on LazyBear’s Squeeze Momentum Oscillator.
Right above and below the main volatility oscillator, it visualizes when the histogram and UPO oscillator share the same trend or show potential correlation.
At the bottom, mid- to short-term trends are visualized in a Chop Zone style.
The small thin bars below indicate short- to mid-term mean reversion zones.
Finally, the table provides a simplified summary of each oscillator’s trend by timeframe.
Perfect

[UPRIGHT Trading] Awesome MACD+ (cc)Hello Traders,
I'd like to introduce you all to the Awesome MACD+ indicator.
As most of you know, the Moving Average Convergence Divergence, MACD, indicator is a one of the most popular indicator among traders. The MACD is a trend-momentum indicator that measures the relationship between moving averages and uses a signal line to show crossovers between the MACD line. The signal line is generally used as a trigger for buy/sell signals with a cross of the MACD line or confirmation when used with other strategies. More advanced traders will look for divergences; divergences can, for example, indicate a weakness in the current trend.
How the Awesome MACD+ is different:
This MACD uses several complex equations and filters to improve accuracy.
Multiple extremely accurate Buy/Sell signals not found on a traditional MACD indicator.
Ability to use 2 different background highlight signals and several different buy/sell signals.
Fully customizable (as always), ability to turn on or off any signals, change any of the colors to suit your needs.
***I've used Bitcoin in the chart above just to show that it is still extremely accurate using alt-coins as well.
On AAPL
Advanced algo trend filtering
Easy to read signals for every level of trader.
..Can work for the minimalist.
..Those that want every signal.
..Those that like a balance of signals.
Whatever your style or skill level, the Awesome MACD+ can be customized to fit your needs.
The above chart should look like this:
Good luck Traders.
Cheers,
Mike
(UPRIGHT Trading)

Boom Hunter ProBoom Hunter Pro is the ultimate indicator for targeting perfect long entries and epic shorts. Boom Hunter comes with a super fast oscillator that uses Ehlers Early Onset Trend (EOT). This is the Center Of Gravity Oscillator (COG) with a super smoothing filter and a roofing filter. This indicator is tuned for 1 hour charts but can be used on any time frame.
Colored bars can be turned on to assist in finding an entry. Purple signifies a drag and potential dump.
Fibonacci lines can be turned on to track price action and find entries/exit.
This indicator follows the same rules as COG. For more information please see my COG HOWTO here:

LSMA Wave RiderThe LSMA Wave Rider uses Least Squares Moving Average to make a fast oscillator ideal for scalping lower timeframe charts. Upper and lower bands contract during pullback and expand as it "booms". The perfect entry is the first crossover after bands expand. This is a great tool for entering trades.
The above image shows two examples of perfect entries:
1. The upper and lower bands contract getting tighter as it pulls back.
2. The upper and lower bands then begin to expand as it gets ready to fly.
3. The oscillator crosses over showing entry point.
* Please note that this strategy may not work during major downtrends. *
Oscillator 2 is used to detect diversions. Reduce the number to pick up shorter diversions and increase to 200 to pickup larger diversions.

FibBand, Perfect Trendline Trader and Target SystemSo, Dear Friends, I am open-sourcing one of my scripts which I created as a thesis project,
The Auto Trader System is a Scalping Tool , to be used mostly in intraday Setups!!
and is designed using,
1. Fibonacci Bands
Fibo Bands are Calculated by defining dynamic Fibonacci Pivots Lines over a history of Lookup values (Default is 89 periods lookback),
The bands help in identifying the Target Points for the setup
2. Perfect TrendLine Setup
The script uses PTS, as a filter to define the optimum entry and exit points
Which timeframe it works for ?
Works for Any Time Frame, but Intraday setups are good!
Who is this System for ?
Beginner and Intermediate Traders
Provision For Alerts
The Script has provision for both long and short alerts!!
Enjoy!
Ema System Ajeet v1.0This is a 5 min, Trend following system
using two Ema's: 20 and 50
Probability of hitting the target is high when both Ema's are:
Rising and almost parallel, for Buying
Falling and almost parallel, for Selling
This will decrease the number of entries but probability of hitting the target is 88%
(Tested on 8 months data for FnO scrips cash on 5 mins data)
Target fixed at 1% or you can trail
SL fixed at 1% or you can take close above Ema20 as stop for buying and vice versa
I tested it on FnO stocks Nseindia with 5 mins chart, you are free to explore
-Ajeet Singh

Divergence of DecisionPoint Breadth Swenlin Trading [LazyBear]// This source code is subject to the terms of the Mozilla Public License 2.0 at mozilla.org
// © 03.freeman
//This is indicator from LazyBear is very accurate for stocks and indexes.
//I added some code snippets for spot and draw divergences automatically
//
// @author LazyBear
//
//
Best use with daily time frame.
Enter when a divergence is found (Bull or Bear label) and wait at least a couple of candles before exit.
Next improvement: alerts ready made for webhooks and screener for multiple tickers.
Please use comment section for any feedback.

Patrick's Buy/Sell HistogramSimply look for a 12 point long bar and that's a perfect time to buy the security
