BTC Future CME Cross-Market DetectorProject Spec: BTC CME Cross-Market Detector
1. Project Overview
Indicator Name
CME Cross-Market Detector
Objective
To identify high-probability trade setups by detecting and confirming "smart money" activity across two distinct market venues simultaneously: a primary crypto exchange (e.g., Bybit, Binance) and the institutional CME futures market.
Core Philosophy
Price movements are often preceded by the positioning of large, institutional players ("smart money"). While their activity can be seen on any single exchange, the signal becomes exceptionally reliable when the same footprint appears at the same time in both the broader crypto derivatives market and the highly regulated institutional futures market. This dual-market confirmation acts as a powerful noise filter, isolating signals that have a higher probability of follow-through.
2. Key Concepts & Signal Logic
The indicator's entire foundation rests on confirming that specific conditions are met on two datasets at the same time: (1) The user's current chart (e.g., BYBIT:BTCUSDT) and (2) The CME Bitcoin Futures chart (CME:BTC1!).
Smart Volume Analysis
To gauge buying vs. selling pressure, the total volume of a single candle is algorithmically split. This is not a perfect science but an effective estimation based on the candle's structure.
Buying Pressure is considered proportional to the distance the price closed from the low. Buying Pressure ≈ Total Volume × ((Close - Low) / (High - Low))
Selling Pressure is considered proportional to the distance the price closed from the high. Selling Pressure ≈ Total Volume × ((High - Close) / (High - Low))
Signal Trigger Conditions
For a potential signal to be identified on each market independently, two conditions must be met:
Volume Spike: The volume of the current candle must be significantly higher than the recent average volume (e.g., >150% of the 20-period moving average). This shows a sudden, high level of interest.
Pressure Imbalance: The estimated buying pressure must overwhelm the selling pressure by a certain factor (e.g., 3x), or vice versa for a sell signal. This indicates a clear directional intent.
The Final Confirmed Signal
A signal is only considered valid and plotted on the chart when the Signal Trigger Conditions (both Volume Spike and Pressure Imbalance) are met on both the primary chart and the CME chart on the very same candle.
3. Signal Strength Calculation
The percentage shown on the chart is a Signal Strength Score (0-100%), which rates the quality and conviction of the confirmed signal.
The score is calculated as follows:
Base Score Calculation (0-100 points): A base score is calculated for each market (primary and CME) by combining two factors:
Volume Component (0-50 pts): Measures the intensity of the volume spike. A 300% volume spike will score higher than a 150% spike.
Imbalance Component (0-50 pts): Measures the intensity of the buy/sell pressure ratio. A 5x imbalance will score higher than a 3x imbalance.
Advanced Modifiers (Bonus Points): The base score is then enhanced with bonus points for favorable conditions:
Trend Alignment (+10 pts): A buy signal that occurs during a clear uptrend receives extra points.
Candle Structure (+10 pts): A buy signal on a candle with a long lower wick (indicating rejection of lower prices) receives extra points.
Final Averaged Score: The final percentage you see is the average of the two individual strength scores calculated for the primary exchange and the CME market.
4. Visualization
Energy Waves: Signals are displayed as circles. Green for Buy Signals (below the candle) and Red for Sell Signals (above the candle).
Dynamic Sizing: The size of the circle directly reflects the Signal Strength Score, categorized into four distinct levels (e.g., 10%+, 40%+, 60%+, and 80%+) for at-a-glance interpretation.
Percentage Labels: Each signal is plotted with its precise, final strength score for clear analysis.
5. Summary: Steps to Replicate the Logic
To recreate this indicator, follow these high-level steps for each candle on the chart:
Gather Data: Fetch the Open, High, Low, Close, and Volume data for the primary chart asset AND for the corresponding CME Bitcoin Futures symbol (CME:BTC1!).
Calculate Buy/Sell Pressure: For both datasets, use the "Smart Volume Analysis" formula to estimate the buying and selling pressure for the current candle.
Check for Volume Spikes: For both datasets, calculate a simple moving average of the volume. Check if the current candle's volume exceeds this average by a set threshold (e.g., 150%).
Check for Pressure Imbalance: For both datasets, check if the buying pressure is greater than the selling pressure by a set multiplier (e.g., 3.0), or vice versa.
Confirm the Signal: A final signal is only valid if the conditions from both Step 3 and Step 4 are true for both datasets on the same candle.
Calculate Strength: If a signal is confirmed, compute a strength score (0-100) for each dataset based on the intensity of the volume spike and pressure imbalance. Add bonus points for confluence factors like trend alignment.
Finalize and Plot: Average the two strength scores from each market. Plot a colored, sized circle on the chart that visually represents this final averaged score, and display the score as a text label.
Last but not least, the idea of the indicator is inspired by 52SIGNAL
Perpetual

Spot-Futures SpreadSpot-Futures Spread Indicator
A comprehensive indicator that automatically calculates and visualizes the percentage spread between spot and perpetual futures prices across multiple exchanges.
Key Features:
Automatic Exchange Detection - Automatically detects your current exchange and finds the corresponding spot/futures pair
Smart Fallback System - If the counterpart isn't available on your exchange, it automatically searches across 7+ major exchanges (Binance, Bybit, OKX, Gate.io, MEXC, KuCoin, HTX) and uses the first valid match
Multi-Exchange Support - Works with 14 exchanges including Binance, Bybit, OKX, MEXC, BitGet, Gate.io, KuCoin, and more
Clear Exchange Attribution - Shows exactly which exchanges are providing spot and futures data in the statistics table
Configurable Moving Average - Track the average spread with customizable period
Standard Deviation Bands - Identify unusual spread conditions with Bollinger-style bands
Built-in Alerts - Get notified when spread crosses bands or zero (parity)
Statistics Table - Real-time stats showing current spread, MA, std dev, and bands
Manual Override Options - Advanced users can manually specify exchanges and symbols
How It Works:
The indicator calculates the spread as: (Futures Price - Spot Price) / Spot Price × 100
Positive spread = Futures trading at a premium (contango)
Negative spread = Futures trading at a discount (backwardation)
Zero = Parity between spot and futures
Use Cases:
Funding Rate Analysis - Correlates with perpetual funding rates
Arbitrage Opportunities - Identify significant spot-futures divergences
Market Sentiment - Premium/discount indicates bullish/bearish positioning
Cross-Exchange Analysis - Compare spreads when spot and futures are on different exchanges
Smart Features:
Works whether you're viewing a spot or futures chart
Automatically handles exchange-specific perpetual contract naming (.P, PERP, SWAP, etc.)
Color-coded visualization (green for premium, red for discount)
Customizable colors and display options
Background shading based on spread direction
Perfect For:
Crypto traders monitoring funding rates, arbitrage traders, market makers, and anyone interested in spot-futures dynamics across multiple exchanges.
Getting Started:
Simply add the indicator to any spot or perpetual futures chart. It will automatically detect the exchange and find the corresponding pair. The statistics table shows which exchanges are being used for maximum transparency.
Note: The indicator automatically ignores invalid symbols, so you'll never see errors even if a specific pair doesn't exist on a particular exchange.
Kudos to @AlekMel that made the "Spot - Fut Spread v2" indicator that I enhance the Automatic detection feature which was not working in some case.

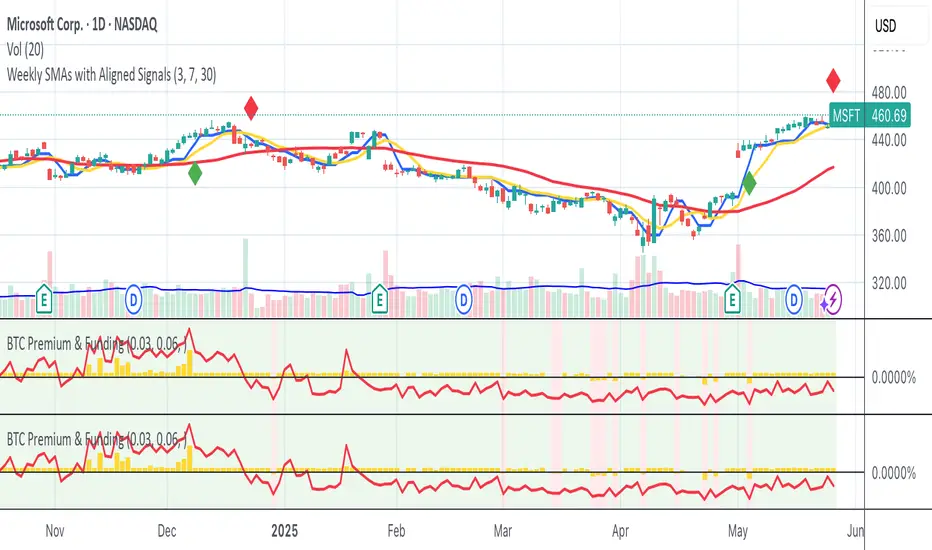
Qullamagi EMA Breakout Autotrade (Crypto Futures L+S)Title: Qullamagi EMA Breakout – Crypto Autotrade
Overview
A crypto-focused, Qullamagi-style EMA breakout strategy built for autotrading on futures and perpetual swaps.
It combines a 5-MA trend stack (EMA 10/20, SMA 50/100/200), volatility contraction boxes, volume spikes and an optional higher-timeframe 200-MA filter. The script supports both long and short trades, partial take profit, trailing MA exits and percent-of-equity position sizing for automated crypto futures trading.
Key Features (Crypto)
Qullamagi MA Breakout Engine – trades only when price is aligned with a strong EMA/SMA trend and breaks out of a tight consolidation range. Longs use: Close > EMA10 > EMA20 > SMA50 > SMA100 > SMA200. Shorts are the mirror condition with all MAs sloping in the trend direction.
Strict vs Loose Modes – Strict (Daily) is designed for cleaner swing trades on 1H–4H (full MA stack, box+ATR and volume filters, optional HTF filter). Loose (Intraday) focuses on 10/20/50 alignment with relaxed filters for more frequent 15m–30m signals.
Volatility & Volume Filters for Crypto – ATR-based box height limit to detect volatility contraction, wide-candle filter to avoid chasing exhausted breakouts, and a volume spike condition requiring current volume to exceed an SMA of volume.
Higher-Timeframe Trend Filter (Optional) – uses a 200-period SMA on a higher timeframe (default: 1D). Longs only when HTF close is above the HTF 200-SMA, shorts only when it is below, helping avoid trading against dominant crypto trends.
Autotrade-Oriented Trade Management – position size as % of equity, initial stop anchored to a chosen MA (EMA10 / EMA20 / SMA50) with optional buffer, partial take profit at a configurable R-multiple, trailing MA exit for the remainder, and an optional cooldown after a full exit.
Markets & Timeframes
Best suited for BTC, ETH and major altcoin futures/perpetuals (Binance, Bybit, OKX, etc.).
Strict preset: 1H–4H charts for classic Qullamagi-style trend structure and fewer fake breakouts.
Loose preset: 15m–30m charts for higher trade frequency and more active intraday trading.
Always retune ATR length, box length, volume multiplier and position size for each symbol and exchange.
Strategy Logic (Quick Summary)
Long (Strict): MA stack in bullish alignment with all MAs sloping up → tight volatility box (ATR-based) → volume spike above SMA(volume) × multiplier → breakout above box high (close or intrabar) → optional HTF close above 200-SMA.
Short: Mirror logic: bearish MA stack, tight box, volume spike and breakdown below box low with optional HTF downtrend.
Best Practices for Crypto
Backtest on each symbol and timeframe you plan to autotrade, including commissions and slippage.
Start on higher timeframes (1H/4H) to learn the behavior, then move to 15m–30m if you want more signals.
Use the higher-timeframe filter when markets are strongly trending to reduce counter-trend trades.
Keep position-size percentage conservative until you fully understand the drawdowns.
Forward-test / paper trade before connecting to live futures accounts.
Webhook / Autotrade Integration
Designed to work with TradingView webhooks and external crypto trading bots.
Alert messages include structured fields such as: EVENT=ENTRY / SCALE_OUT / EXIT, SIDE=LONG / SHORT, STRATEGY=Qullamagi_MA.
Map each EVENT + SIDE combination to your bot logic (open long/short, partial close, full close, etc.) on your preferred exchange.
Important Notes & Disclaimer
Crypto markets are highly volatile and can change regime quickly. Backtest and forward-test thoroughly before using real capital. Higher timeframes generally produce cleaner MA structures and fewer fake breakouts.
This strategy is for educational and informational purposes only and does not constitute financial advice. Trading leveraged crypto products involves substantial risk of loss. Always do your own research, manage risk carefully, and never trade with money you cannot afford to lose.

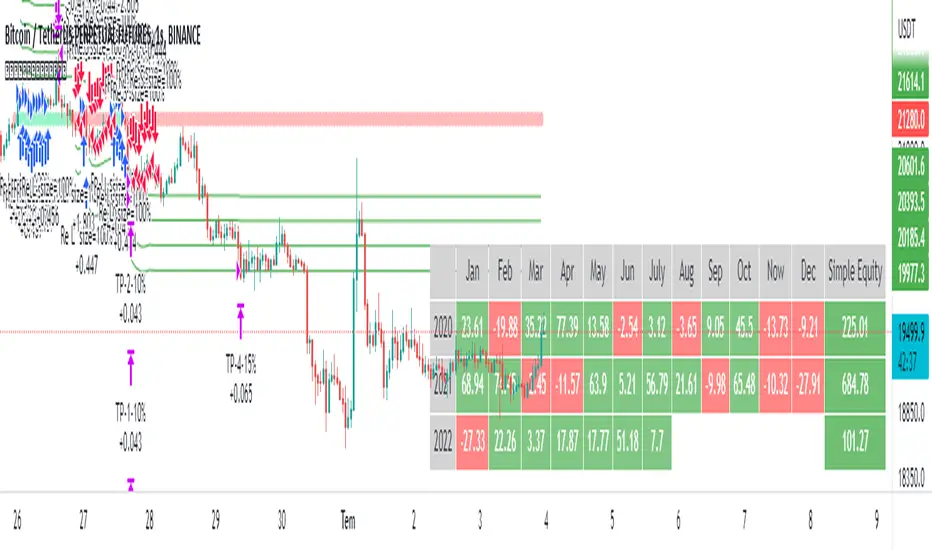
Crypto Perp Calc v1Advanced Perpetual Position Calculator for TradingView
Description
A comprehensive position sizing and risk management tool designed specifically for perpetual futures trading. This indicator eliminates the confusion of calculating leveraged positions by providing real-time position metrics directly on your chart.
Key Features:
Interactive Price Selection: Click directly on chart to set entry, stop loss, and take profit levels
Accurate Lot Size Calculation: Instantly calculates the exact position size needed for your margin and leverage
Multiple Entry Support: DCA into positions with up to 3 entry points with customizable allocation
Multiple Take Profit Levels: Scale out of positions with up to 3 TP targets
Comprehensive Risk Metrics: Shows dollar P&L, account risk percentage, and liquidation price
Visual Risk/Reward: Color-coded boxes and lines display your trade setup clearly
Real-time Info Table: All critical position data in one organized panel
Perfect for traders using perpetual futures who need precise position sizing with leverage.
---------
How to Use
Quick Start (3 Clicks)
1. Add the indicator to your chart
2. Click three times when prompted:
First click: Set your entry price
Second click: Set your stop loss
Third click: Set your take profit
3. Read the TOTAL LOTS value from the info table (highlighted in yellow)
4. Use this lot size in your exchange when placing the trade
Detailed Setup
Step 1: Configure Your Account
Enter your account balance (total USDT in account)
Set your margin amount (how much USDT to risk on this trade)
Choose your leverage (1x to 125x)
Select Long or Short position
Step 2: Set Price Levels
Main levels use interactive clicking (Entry, SL, TP)
For multiple entries or TPs, use the settings panel to manually input prices and percentages
Step 3: Read the Results
The info table shows:
TOTAL LOTS - The position size to enter on your exchange
Margin Used - Your actual capital at risk
Notional - Total position value (margin × leverage)
Max Risk - Dollar amount you'll lose at stop loss
Total Profit - Dollar amount you'll gain at take profit
R:R Ratio - Risk to reward ratio
Account Risk - Percentage of account at risk
Liquidation - Price where position gets liquidated
Step 4: Advanced Features (Optional)
Multiple Entries (DCA):
Enable "Use Multiple Entries"
Set up to 3 entry prices
Allocate percentage for each (must total 100%)
See individual lot sizes for each entry
Multiple Take Profits:
Enable "Use Multiple TPs"
Set up to 3 TP levels
Allocate percentage to close at each level (must total 100%)
View profit at each target
Visual Elements
Blue lines/labels: Entry points
Red lines/labels: Stop loss
Green lines/labels: Take profit targets
Colored boxes: Visual risk (red) and reward (green) zones
Info table: Can be positioned anywhere on screen
Alerts
Set price alerts for:
Entry zones reached
Stop loss approached
Take profit levels hit
Works with TradingView's alert system
Tips for Best Results
Always verify the lot size matches your intended risk
Check the liquidation price stays far from your stop loss
Monitor the account risk percentage (recommended: keep under 2-3%)
Use the warning indicators if risk exceeds margin
For quick trades, use single entry/TP; for complex strategies, use multiple levels
Example Workflow
Find your trade setup using your analysis
Add this indicator and click to set levels
Check risk metrics in the table
Copy the TOTAL LOTS value
Enter this exact position size on your exchange
Set alerts for key levels if desired
This tool bridges the gap between TradingView charting and exchange execution, ensuring your position sizing is always accurate when trading with leverage.
Disclaimer, this was coded with help of AI, double check calculations if they are off.

Precision Trend Shot | JeffreyTimmermansPrecision Trend Shot
The "Precision Trend Shot" Indicator is an advanced technical tool designed to provide a dynamic and adaptive view of market trends. By combining three core components—RSI Oscillator, LSMA ATR, and Adaptable Trend—this indicator delivers precise signals that help traders identify market direction, volatility, and potential trend reversals. The calculated total score, derived from these components, provides a clear, actionable view of market conditions.
Key Features
Multi-Component Analysis: Integrates three key indicators (RSI, LSMA ATR, and Adaptable Trend) for a comprehensive view of market trends.
Dynamic Trend Classification: Categorizes market states as "Bullish" or "Bearish", based on a combined score.
Standard Deviation Bands: Displays standard deviation bands around the score line for enhanced volatility visualization.
Gradient Background Coloring: Visually highlights market phases with gradient colors, aiding quick interpretation.
Customizable Visuals: Offers extensive settings for coloring, background gradients, and signal visibility.
Real-Time Alerts: Generates alerts for significant trend changes or transitions between market states.
Inputs & Settings
RSI Settings:
RSI Source: Default: Close price. Defines the data source for RSI calculation.
RSI Length: Default: 10. Sets the period for calculating RSI.
LSMA ATR Settings:
LSMA Source: Default: Close price. Defines the data source for LSMA calculation.
LSMA Length: Default: 21. Sets the period for calculating the Least Squares Moving Average.
ATR Length: Default: 12. Sets the period for calculating the Average True Range.
Adaptable Trend Settings:
Trend Length: Default: 5. Sets the period for calculating the trend.
Smoothing Length: Default: 5. Controls the smoothing of trend volatility.
Sensitivity: Default: 1.5. Adjusts the sensitivity of trend bands.
Standard Deviation Settings:
Enable Standard Deviation Bands: Default: True. Toggles the display of standard deviation bands.
Standard Deviation Length: Default: 20. Sets the period for standard deviation calculation.
Standard Deviation Multiplier: Default: 2.0. Adjusts the width of the bands.
Smoothing Length: Default: 5. Controls the smoothing of standard deviation bands.
Visual Settings:
Enable Candle Coloring: Default: True. Colors candles based on market state (Bullish or Bearish).
Enable Background Gradient: Default: True. Applies gradient coloring to the background based on trend direction.
Score Line Colors: Customize colors for bullish or bearish score lines.
Calculation Process
RSI Calculation:
Computes the Relative Strength Index (RSI) of the selected source data.
Signals bullish (RSI > 50) or bearish (RSI < 50) conditions.
LSMA ATR Calculation:
Computes LSMA for trend direction and ATR for volatility measurement.
Generates buy and sell signals based on crossover and crossunder of ATR bands.
Adaptable Trend Calculation:
Calculates dynamic trend levels using EMA and standard deviation bands.
Classifies trend states as Bullish or Bearish.
Combined Signal Calculation:
Averages the signals from RSI, LSMA ATR, and Adaptable Trend to generate a total score.
Classifies the market as "Bullish" or "Bearish" based on this score.
Standard Deviation Bands:
Plots standard deviation bands around the combined signal for enhanced volatility analysis.
Gradient Background Coloring:
Colors the chart background based on the identified market state (Bullish or Bearish).
How to Use the Precision Trend Shot Indicator
Identifying Market States:
Bullish Market: Total score > 0, gradient background green.
Bearish Market: Total score < 0, gradient background red.
Confirming Signals:
Use RSI and LSMA ATR signals for early indications.
Use Trend Recon for confirming longer-term trend direction.
Visualizing Volatility:
Standard deviation bands highlight potential reversal zones.
Dynamic Alerts
The Precision Trend Shot Indicator includes a robust alert system for real-time market transitions:
Bullish to Bearish: Market shifts from a bullish to bearish trend.
Bearish to Bullish: Market shifts from a bearish to bullish trend.
Conclusion
The Precision Trend Shot Indicator is an advanced, versatile tool for identifying market trends, visualizing volatility, and generating actionable signals. With customizable settings, dynamic alerts, and clear visual representation, it is an essential addition to any trader’s toolkit.
-Jeffrey

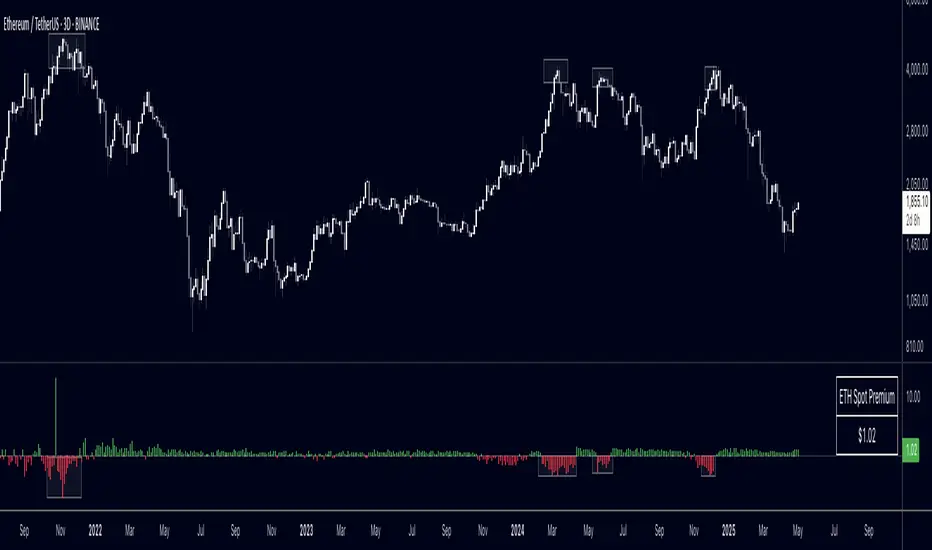
Spot Vs Perp PremiumThis indicator visualizes the price premium or discount between spot and perpetual futures markets for any crypto asset, using data from Binance, OKX, and Bybit. It helps traders track sentiment shifts, uncover arbitrage signals, and identify potential short-term reversals or continuation moves based on how aggressively traders are positioned in derivatives relative to the spot market.
What It Does
- Calculates the premium:
The difference between spot price and perp price is shown as a histogram. A positive premium (spot > perp) suggests cautious or bearish perp traders, while a negative premium (perp > spot) may indicate aggressive long positioning or speculative activity.
Supports multiple venues:
You can toggle between Binance, OKX, Bybit, or view a 3-exchange average for a more smoothed view.
Automatic pair detection:
The script auto-detects the base and quote currency from your active chart, dynamically tracking the correct spot and perp contracts for the asset you're analyzing.
Invert option:
Flip the calculation to view the perp premium instead of the spot premium, useful for comparing directional funding bias or for personal preference in visual analysis.
Optional moving average:
Smooth the premium signal over time to track sustained shifts in sentiment and filter out noise.
Table display:
Displays the real-time premium value in the corner of the chart for clarity.
Why It's Useful
This tool gives insight into derivatives trader behavior vs real market pricing. Spot prices reflect actual buying/selling of assets, while perpetual futures are often driven by speculation, leverage, and short-term positioning. When these diverge significantly, it often precedes market inflection points:
- Perp trading above spot (negative premium): excessive long exposure, potential for mean reversion or liquidations.
- Perp trading below spot (positive premium): risk-off behavior or hedging, potential for squeeze or unwind.
You can use this indicator to:
- Anticipate liquidation-driven moves
- Spot early signs of trend exhaustion
- Confirm breakout strength with perp alignment
- Monitor crowd positioning in real-time
Inputs
- Exchange – Select from Binance, OKX, Bybit, or average all three
- Inverse Premium – Flip the calculation to see perp - spot instead
- Show MA – Overlay a moving average for premium smoothing
- Show Table – Toggle live premium table display
- MA Period – Customize the smoothing window
Enjoy! Please comment and like!
BINANCE-BYBIT Cross Chart: Spot-Perpetual CorrelationName: "Binance-Bybit Cross Chart: Spot-Perpetual Correlation"
Category: Scalping, Trend Analysis
Timeframe: 1M, 5M, 30M, 1D (depending on the specific technique)
Technical analysis: This indicator facilitates a comparison between the price movements shown on the Binance spot chart and the Bybit perpetual chart, with the aim of discerning the correlation between the two charts and identifying the dominant market trends. It automatically generates the corresponding chart based on the ticker selected in the primary chart. When a Binance pair is selected in the main chart, the indicator replicates the Bybit perpetual chart for the same pair and timeframe, and vice versa, selecting the Bybit perpetual chart as the primary chart generates the Binance spot chart.
Suggested use: You can utilize this tool to conduct altcoin trading on Binance or Bybit, facilitating the comparison of price actions and real-time monitoring of trigger point sensitivity across both exchanges. We recommend prioritizing the Binance Spot chart in the main panel due to its typically longer historical data availability compared to Bybit.
The primary objective is to efficiently and automatically manage the following three aspects:
- Data history analysis for higher timeframes, leveraging the extensive historical data of the Binance spot market. Variations in indicators such as slow moving averages may arise due to differences in historical data between exchanges.
- Assessment of coin liquidity on both exchanges by observing candlestick consistency on smaller timeframes or the absence of gaps. In the crypto market, clean charts devoid of gaps indicate dominance and offer enhanced reliability.
- Identification of precise trigger point levels, including daily, previous day, or previous week highs and lows, which serve as sensitive areas for breakout or reversal operations.
All-Time High (ATH) and All-Time Low (ATL) levels may vary significantly across exchanges due to disparities in historical data series.
This tool empowers traders to make informed decisions by leveraging historical data, liquidity insights, and precise trigger point identification across Binance Spot and Bybit Perpetual market.
Configuration:
EMA length:
- EMA 1: Default 5, user configurable
- EMA 2: Default 10, user configurable
- EMA 3: Default 60, user configurable
- EMA 4: Default 223, user configurable
- Additional Average: Optional display of an additional average, such as a 20-period average.
Chart Elements:
- Session separator: Indicates the beginning of the current session (in blue)
- Background: Indicates an uptrend (60 > 223) with a green background and a downtrend (60 < 223) with a red background.
Instruments:
- EMA Daily: Shows daily averages on an intraday timeframe.
- EMA levels 1h - 30m: Shows the levels of the 1g-30m EMAs.
- EMA Levels Highest TF: Provides the option to select additional EMA levels from the major timeframes, customizable via the drop-down menu.
- "Hammer Detector: Marks hammers with a green triangle and inverted hammers with a red triangle on the chart
- "Azzeramento" signal on TF > 30m: Indicates a small candlestick on the EMA after a dump.
- "No Fomo" signal on TF < 30m: Indicates a hyperextended movement.
Trigger Points:
- Today's highs and lows: Shows the opening price of the day's candlestick, along with the day's highs and lows (high in purple, low in red, open in green).
- Yesterday's highs and lows: Displays the opening price of the daily candlestick, along with the previous day's highs and lows (high in yellow, low in red).
You can customize the colors in "Settings" > "Style".
It is best used with the Scalping The Bull indicator on the main panel.
Credits:
@tumiza999: for tests and suggestions.
Thanks for your attention, happy to support the TradingView community.

Aggregated Funding RateAFR - A tool designed for traders who demand real-time, comprehensive insights into funding rates across various exchanges. This script stands out in its ability to aggregate and analyze funding rates from 9 different exchanges , offering unparalleled depth and breadth in market analysis.
Key Features:
Real-Time Monitoring Across Multiple Exchanges: Seamlessly tracks funding rates from top exchanges including Binance, Bybit, Bitmex, Bitget, OKX, and more, ensuring a broad market view.
Sophisticated Algorithms for Accurate Calculations: Each exchange has unique algorithms for funding rate calculation. This script accounts for these variations, providing precise, reliable data. It is important to note that exact calculations are not possible on TradingView due to data limitations; there is no direct access to order books, so for some parts, generalizations have been made.
Dual Modes for Enhanced Understanding:
Standard Mode: Displays the current funding rate as is, for immediate insight.
Annualized Mode: Projects the funding rate on an annual basis, offering a perspective on long-term trends and impacts.
Weighted Analysis Options:
Average Mode: Treats each exchange equally, providing a balanced overview.
Weighted Mode: Adjusts the influence of each exchange based on their perpetual trading volume, offering a nuanced, market-relevant view.
Customizable Exchange Selection: Users have the flexibility to include or exclude specific exchanges from the calculation, allowing for tailored analysis based on personal trading strategies.
User-Friendly Visualization: The script features clear, intuitive plots and color-coded visuals to make data interpretation straightforward and effective.
Versatility in Timeframes: Designed to be adaptable across any timeframe, this tool is equally effective whether you are looking at a 1-minute interval or longer durations. This makes it an indispensable tool for both high-frequency traders and those analyzing broader market trends.
As always, use this indicator in tandem with other tools. This is a very useful indicator, but one should always rely on self-made, backtested and forward tested strategies

Lines and Table for risk managementABOUT THIS INDICATOR
This is a simple indicator that can help you manage the risk when you are trading, and especially if you are leverage trading. The indicator can also be used to help visualize and to find trades within a suitable or predefined trading range.
This script calculates and draws six “profit and risk lines” (levels) that show the change in percentage from the current price. The values are also shown in a table, to help you get a quick overview of risk before you trade.
ABOUT THE LINES/VALUES
This indicator draws seven percentage-lines, where the dotted line in the middle represents the current price. The other three lines on top of and below the middle line shows the different levels of change in percentage from current price (dotted line). The values are also shown in a table.
DEFAULT VALUES AND SETTINGS
By default the indicator draw lines 0.5%, 1.0%, and 1.5% from current price (step size = 0.5).
The default setting for leverage in this indicator = 1 (i.e. no leverage).
The line closest to dotted line (current price) is calculated by step size (%) * leverage (x) = % from price.
Pay attention to the %-values in the table, they represent the distance from the current price (dotted line) to where the lines are drawn.
* Be aware! If you change the leverage, the distance from the closest lines to the dotted line showing the current price increase.
SETTINGS
1. Leverage: set the leverage for what you are planning to trade on (1 = no leverage, 2 = 2 x leverage, 5 = 5 x leverage...).
2. Stepsize is used to set the distance between the lines and price.
EXAMPLES WITH DIFFERENT SETTINGS
1) Leverage = 1 (no leverage, default setting) and step size 0.5 (%). Lines plotted at (0.5%, 1%, 1.5%, and –0.5%, –1%, –1,5%) from the current price.
2) Leverage = 3 and stepsize 0.5(%). Lines plotted at (1.5%, 3.0%, 4.5%, and –1.5%, –3.0%, –4.5%) from the current price.
3) Leverage = 3 and stepsize 1(%). Lines plotted at (3%, 6%, 9%, and –3%, –6%, –9%) from the current price.
The distance to the nearest line from the current price is always calculated by the formula: Leverage * step size (%) = % to the nearest line from the current price.

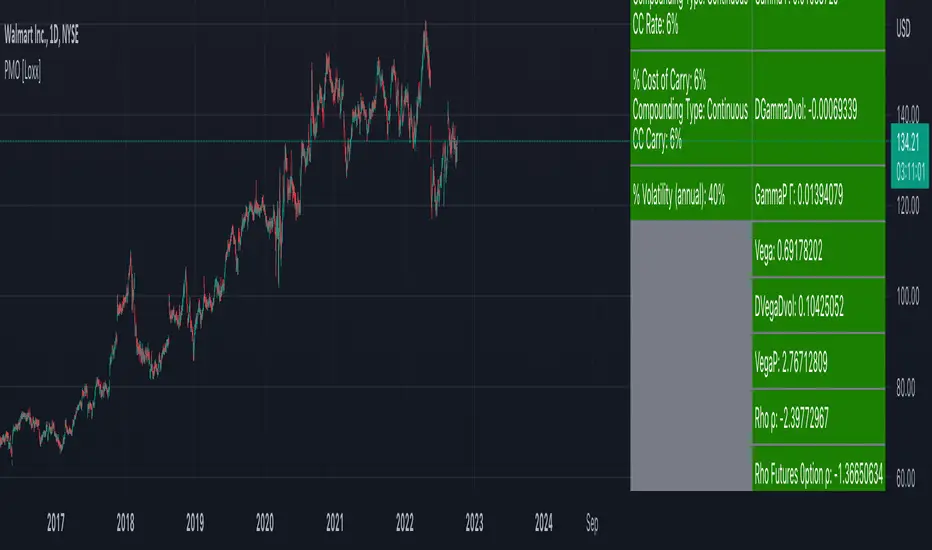
Perpetual American Options [Loxx]Perpetual American Options is Perpetual American Options pricing model. This indicator also includes numerical greeks.
American Perpetual Options
While there in general is no closed-form solution for American options (except for non-dividend-paying stock call options) it is possible to find a closed-form solution for options with an infinite time to expiration. The reason is that the time to expiration will always be the same: infinite. The time to maturity, therefore, does not depend on at what point in time we look at the valuation problem, which makes the valuation problem independent of time McKean (1965) and Merton (1973) gives closed-form solutions for American perpetual options. For a call option we have
c = (X / (y1 - 1)) * ((y1 - 1)/y1 * S/X)^y1
where
y1 = 1/2 - b/v^2 + ((b/v^2 - 1/2)^2 + 2*r/v^2)^0.5
If b >= r, then there is never optimal to exercise a call option. In the case of an American perpetual put, we have
p = X/(1-y2) * (((y2 - 1) / y2) * S/X)^y2
where
y2 = 1/2 - b/v^2 - ((b/v^2 - 1/2)^2 + 2*r/v^2)^0.5
In practice, one can naturally discuss if there is such a thing as infinite time to maturity. For instance, credit risk could play an important role: Even when you are buying an option from an AAA bank, there is no guarantee the bank will be around forever.
b=r options on non-dividend paying stock
b=r-q options on stock or index paying a dividend yield of q
b=0 options on futures
b=r-rf currency options (where rf is the rate in the second currency)
Inputs
S = Stock price.
K = Strike price of option.
T = Time to expiration in years.
r = Risk-free rate
c = Cost of Carry
V = Variance of the underlying asset price
cnd1(x) = Cumulative Normal Distribution
cbnd3(x) = Cumulative Bivariate Normal Distribution
nd(x) = Standard Normal Density Function
convertingToCCRate(r, cmp ) = Rate compounder
Numerical Greeks or Greeks by Finite Difference
Analytical Greeks are the standard approach to estimating Delta, Gamma etc... That is what we typically use when we can derive from closed form solutions. Normally, these are well-defined and available in text books. Previously, we relied on closed form solutions for the call or put formulae differentiated with respect to the Black Scholes parameters. When Greeks formulae are difficult to develop or tease out, we can alternatively employ numerical Greeks - sometimes referred to finite difference approximations. A key advantage of numerical Greeks relates to their estimation independent of deriving mathematical Greeks. This could be important when we examine American options where there may not technically exist an exact closed form solution that is straightforward to work with. (via VinegarHill FinanceLabs)
Things to know
Only works on the daily timeframe and for the current source price.
You can adjust the text size to fit the screen
WhaleCrew Crypto Open InterestUse Crypto Open Interest Data available on TradingView to your advantage.
Features
Auto-Detect Symbol (based on chart)
Preset Symbols (BTC, ETH, BNB, XRP, LUNA, ADA, SOL, AVAX and DOT)
Exchanges ( Binance and BitMex )
Inverse and USDT Pairs
Override Data Option to use any OI Data on TradingView
Customizable Candles

Open Interest Auto SpaceManBTCOpen Interest Auto SpaceManBTC
This is an extension to the script, it aims to provide the data in a less hands on way by providing the basis for automatic calculation on which symbol the data is being pulled from.
Changelog:
Automatic Data retrieval on a percoin basis.
Ability to hide or show symbol.
Coloring choices for the user.

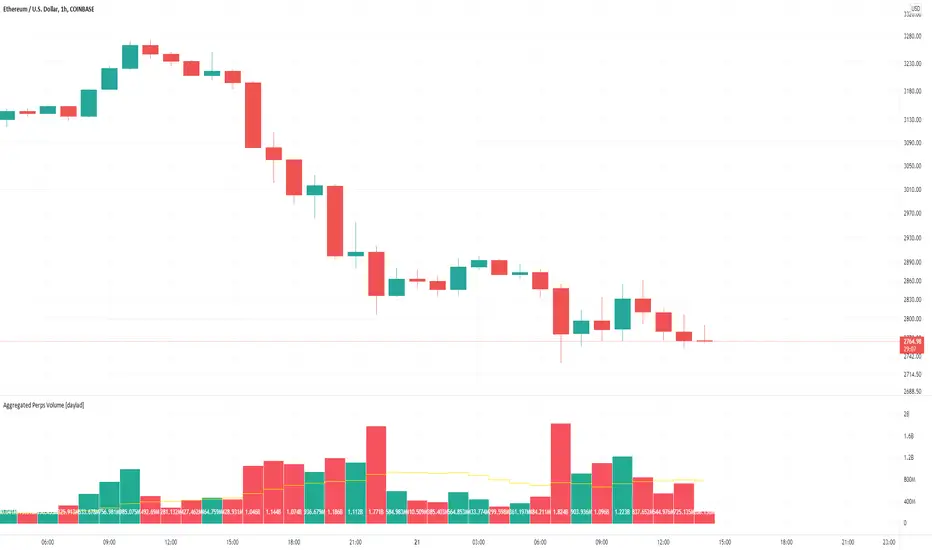
Aggregated Perps Volume [daylad]Same thing as my aggregated spot volume indicator, but for crypto perpetual futures contracts ().
Works with any crypto chart! No need to manually update symbols, this indicator will detect if there is a matching symbol and add it automatically!
The price labels display the total volume per bar in USD.
Pulls data for the following pairs (when available):
BINANCE: + base_symbol + PERP
BINANCE: + base_symbol + BUSDPERP
BINANCE: + base_symbol + USDTPERP
OKEX: + base_symbol + USDTPERP
OKEX: + base_symbol + PERP
FTX: + base_symbol + PERP
PHEMEX: + base_symbol + USD
BYBIT: + base_symbol + USD
BYBIT: + base_symbol + USDT
DERIBIT: + base_symbol + PERP
HUOBI: + base_symbol + PERP
BTSE: + base_symbol + PFC
EXAMPLE -- If you're looking at the COINBASE:SOLUSD chart the indicator will automatically aggregate the volume from BINANCE:SOLPERP, FTX:SOLPERP...etc... BYBIT:SOLUSDT...etc... BTSE:SOLPFC. If an exchange does not have a corresponding pair, then that pair returns 0 and does not add to the total.
If you have any questions feel free to ask. Happy trading!
Bitmex BTC Perpetual Premium and FundingThis script tracks the premium (default red line) and the funding rate (default yellow area) of the Bitmex XBTUSD pair perpetual contract.
The calculations are based on the 8H TWAP of interest rates and premium index from Bitmex.
MyTradePartnerMyTradePartner strategy makes the cryptocurrency markets buy and sell automatically. 5 stoploss, fixed profit take and stoploss level can be customized from strategy settings. There are 4 separate strategies that you can set in the strategy. First of them, there are strategies that decide long and short positions in accordance with your settings at the pivot levels, second of the super trend, third of the potential return levels, third of the up and down breaks. Pyramiding can offer multiple entry points. Strategy back tests can be adjusted to the desired time period and can be used as spot or term if desired. Frostybot is set to work fully compatible with js when the necessary inputs are made from these strategy settings. When installing an alarm for FROSTYBOT JS, the alarm message field is {{strategy.order.alert_message}}.
FEATURES:
-Fully compatibly with Frostybot
-High Percent Profitable strategy up to %60
-İnclude five level Trailing Stoploss, fixed stoploss and takeprofit with position size management
-include four strategy mentably in one strategy use one, use two or both
-All settings are customizable. Create your unique strategy with settings.

Bitcoin Perpetual SwapsThis script track most important Bitcoin Perpetual Swaps vs SPOT (Coinbase).
When strong green color emerge implies that Swaps are trading at premium to spot.
When strong red color emerge implies that Swaps are trading at discount to spot.
These information is useful because it give leading information towards where funding rates are heading.
When trading at premium it will push towards Positive Funding Rates (Longs pay Shorts)
When trading at discount it will push towards Negative Funding Rates (Shorts pay Longs)
It's can also be used to give identify potential local tops or bots when values get too extreme.

BTC Multi Exchange Perpetual PremiumThis script tracks the premium/discount of Bitcoin perpetual contracts at various exchanges.
The premium/discount is calculated against an index price. The index price is calculated from spot exchange prices and are weighted as follows:
Bitstamp:28,81%
Bittrex:5,5%
Coinbase: 38,07%
Gemini: 7,34%
Kraken: 20,28
The difference between this script and other available scripts, is that exciting script seems to only focus on one exchange. This script is also open source.

Binance Z VolumeBTC perpetual volume on Binance is about 4x spot volume.
Comparing spot and perpetual volumes could provide useful insights into market sentiment.
Abnormal increases in the spot market could be associated with accumulation. Abnormal increases in the perpetual market, on the other hand, could predict volatility as well lows and highs.
This script represents a Z-score of the volume of perpetual and 4xspot on Binance.
High values above 0 mean that the volume is skewed towards perpetual contracts. Values below 0 mean that the volume is skewed towards spot contracts.
Feel free to suggest changes and improvements of this script.
Translated with www.DeepL.com (free version)
BIO

Bitmex BTC Perpetual PremiumThis script tracks the premium of the Bitcoin Perpetual futures at Bimex exchange relative to 3 different reference prices.
The difference between this script and already published scripts is that it tracks the premium relative to 3 different reference prices. This tends to produce slightly different results.
This script is also open source, so you can verify the calculations, or use it as a basis for your own script.
The 3 plots uses the following reference prices:
Blue Area:
Bitmex Index price, ticker: BITMEX:XBT
Red line:
Bitmex Perpetual Premium, ticker XBTUSDPI
(This one is not used as reference, but simply plots the ticker*100)
Orange line:
The reference here is a price calculated by the tickers in trading view based on the Bitmex indices with weighing as follows:
Bitstamp:28,81%
Bittrex:5,5%
Coinbase: 38,07%
Gemini: 7,34%
Kraken: 20,28
Please note that Bitmex changes the bases of its indices regularly. Bitmex might also "rule out" on of these exchanges if there is a short term problem.

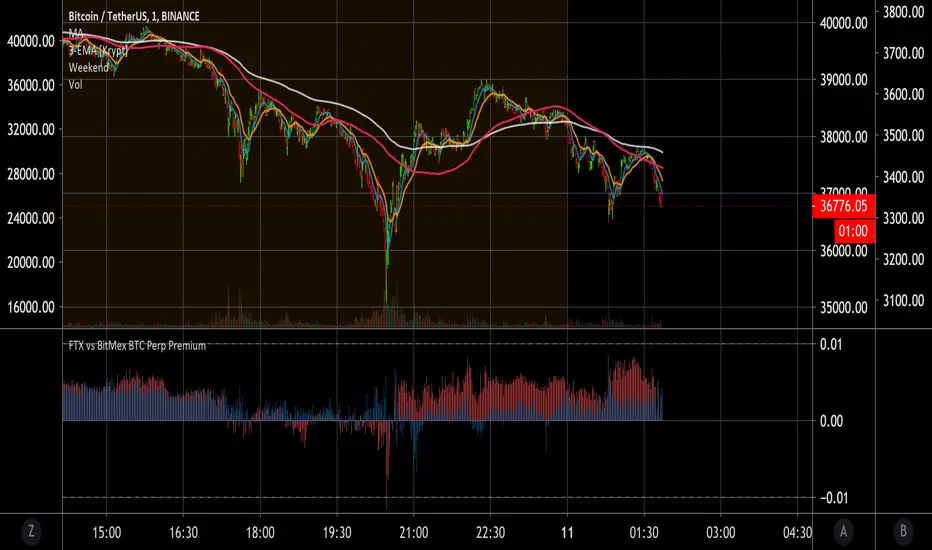
FTX vs BitMex BTC Perp PremiumThis script compares FTX BTC/PERP (BTC perpetual futures contract) price to Binance BTC/USDT spot and colors it red. It also plots Bitmex's BTC perpetual futures compared to Binance spot and colors it blue.
FTX = red
Bitmex = blue
Now you can easily see that you can get a 1% discount on FTX perpetuals when it is tanking. This tells you that you can set your limit buy orders extra low if you like to catch crashes. Also, you can see what your average trader on each platform is willing to pay above or below the spot premium. In general you want to do the opposite of what the average trading is doing on these exchanges unless you're in the main bull or mania phase of the Bitcoin cycle.
If you want to use Bitstamp or your favorite exchange it can be changed in the settings. Let me know if you find any settings that work well for you.
May you profit and enjoy! :)
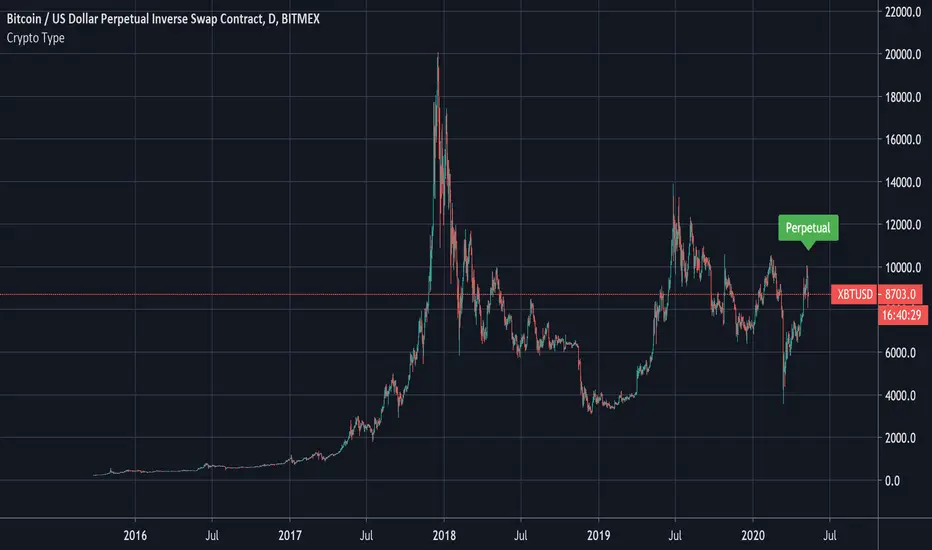
Crypto Type: Regular, Perpetual, Or Futures?A simple way to find out if the security in question is a regular, perpetual, or futures pair.
This reads the data of the security's description and sees if the word perpetual or futures is mentioned.
The method to check if a string has the letters we seek was first introduced by MichelT .
Thank you for checking this out and I hope this helps unlocking new hidden potential.
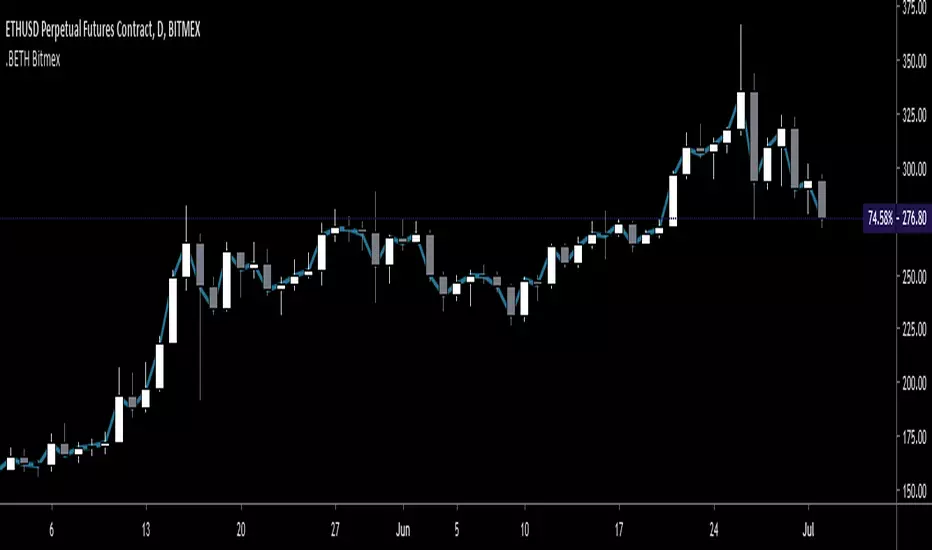
.BETH Ethereum Price Index - for BitMEX - Gyro.BETH script as seen on the BitMEX built-in chart.
This is not created by, authorized by or in any type of affiliation with BitMEX whatsoever.
This is not financial advice. Use at your own risk.
Tips are appreciated if you find this useful:
3BMEXty68scwEPfGGb4zkS23JdBCi3vtkh
See my other scripts for .BXBT!
Thanks