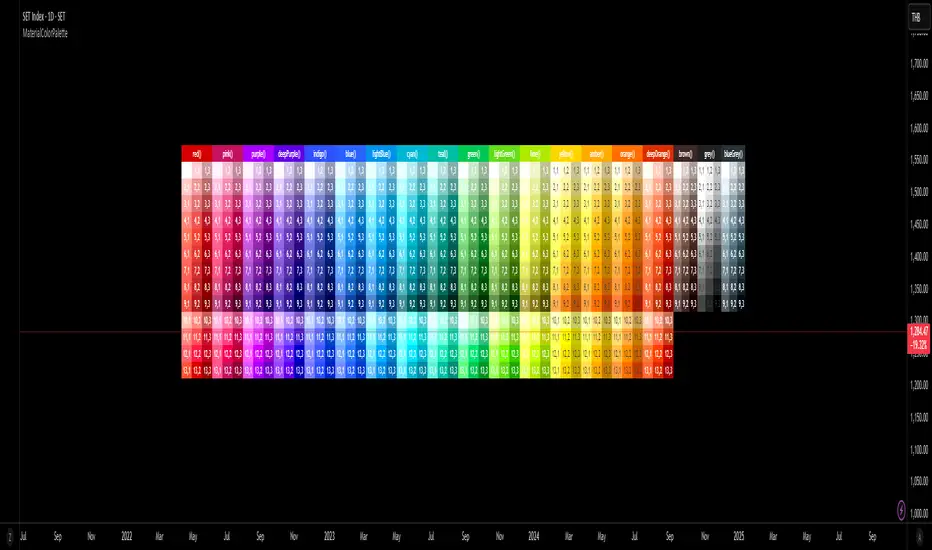
Material Color Palette Library█ OVERVIEW
Unlock a world of color in your Pine Script® projects with the Material Color Palette Library . This library provides a comprehensive and structured color system based on Google's Material Design palette, making it incredibly easy to create visually appealing and professional-looking indicators and strategies.
Forget about guessing hex codes. With this library, you have access to 19 distinct color families, each offering a wide range of shades. Every color can be fine-tuned with saturation, darkness, and opacity levels, giving you precise control over your script's appearance.
To make development even easier, the library includes a visual cheatsheet. Simply add the script to your chart to display a full table of all available colors and their corresponding parameters.
█ KEY FEATURES
Vast Spectrum: 19 distinct color families, from vibrant reds and blues to subtle greys and browns.
Fine-Tuned Control: Each color function accepts parameters for `saturationLevel` (1-13 or 1-9) and `darkLevel` (1-3) to select the perfect shade.
Opacity Parameter: Easily add transparency to any color for fills, backgrounds, or lines.
Quick Access Tones: A simple `tone()` function to grab base colors by name.
Visual Cheatsheet: An on-chart table displays the entire color palette, serving as a handy reference guide during development.
█ HOW TO USE
As a library, this script is meant to be imported into your own indicators or strategies.
1. Import the Library
Add the following line to the top of your script. Remember to replace `YourUsername` with your TradingView username.
import mastertop/ColorPalette/1 as colors
2. Call a Color Function
You can now use any of the exported functions to set colors for your plots, backgrounds, tables, and more.
The primary functions take three arguments: `functionName(saturationLevel, darkLevel, opacity)`
`saturationLevel`: An integer that controls the intensity of the color. Ranges from 1 (lightest) to 13 (most vibrant) for most colors, and 1-9 for `brown`, `grey`, and `blueGrey`.
`darkLevel`: An integer from 1 to 3 (1: light, 2: medium, 3: dark).
`opacity`: An integer from 0 (opaque) to 100 (invisible).
Example Usage:
Let's plot a moving average with a specific shade of teal.
// Import the library
import mastertop/ColorPalette/1 as colors
indicator("My Script with Custom Colors", overlay = true)
// Calculate a moving average
ma = ta.sma(close, 20)
// Plot the MA using a color from the library
// We'll use teal with saturation level 7, dark level 2, and 0% opacity
plot(ma, "MA", color = colors.teal(7, 2, 0), linewidth = 2)
3. Using the `tone()` Function
For quick access to a base color, you can use the `tone()` function.
// Set a red background with 85% transparency
bgcolor(colors.tone('red', 85))
█ VISUAL REFERENCE
To see all available colors at a glance, you can add this library script directly to your chart. It will display a comprehensive table showing every color variant. This makes it easy to pick the exact shade you need without guesswork.
This library is designed for fellow Pine Script® developers to streamline their workflow and enhance the visual quality of their scripts. Enjoy!
Pine實用程式
FiniteStateMachine🟩 OVERVIEW
A flexible framework for creating, testing and implementing a Finite State Machine (FSM) in your script. FSMs use rules to control how states change in response to events.
This is the first Finite State Machine library on TradingView and it's quite a different way to think about your script's logic. Advantages of using this vs hardcoding all your logic include:
• Explicit logic : You can see all rules easily side-by-side.
• Validation : Tables show your rules and validation results right on the chart.
• Dual approach : Simple matrix for straightforward transitions; map implementation for concurrent scenarios. You can combine them for complex needs.
• Type safety : Shows how to use enums for robustness while maintaining string compatibility.
• Real-world examples : Includes both conceptual (traffic lights) and practical (trading strategy) demonstrations.
• Priority control : Explicit control over which rules take precedence when multiple conditions are met.
• Wildcard system : Flexible pattern matching for states and events.
The library seems complex, but it's not really. Your conditions, events, and their potential interactions are complex. The FSM makes them all explicit, which is some work. However, like all "good" pain in life, this is front-loaded, and *saves* pain later, in the form of unintended interactions and bugs that are very hard to find and fix.
🟩 SIMPLE FSM (MATRIX-BASED)
The simple FSM uses a matrix to define transition rules with the structure: state > event > state. We look up the current state, check if the event in that row matches, and if it does, output the resulting state.
Each row in the matrix defines one rule, and the first matching row, counting from the top down, is applied.
A limitation of this method is that you can supply only ONE event.
You can design layered rules using widlcards. Use an empty string "" or the special string "ANY" for any state or event wildcard.
The matrix FSM is foruse where you have clear, sequential state transitions triggered by single events. Think traffic lights, or any logic where only one thing can happen at a time.
The demo for this FSM is of traffic lights.
🟩 CONCURRENT FSM (MAP-BASED)
The map FSM uses a more complex structure where each state is a key in the map, and its value is an array of event rules. Each rule maps a named condition to an output (event or next state).
This FSM can handle multiple conditions simultaneously. Rules added first have higher priority.
Adding more rules to existing states combines the entries in the map (if you use the supplied helper function) rather than overwriting them.
This FSM is for more complex scenarios where multiple conditions can be true simultaneously, and you need to control which takes precedence. Like trading strategies, or any system with concurrent conditions.
The demo for this FSM is a trading strategy.
🟩 HOW TO USE
Pine Script libraries contain reusable code for importing into indicators. You do not need to copy any code out of here. Just import the library and call the function you want.
For example, for version 1 of this library, import it like this:
import SimpleCryptoLife/FiniteStateMachine/1
See the EXAMPLE USAGE sections within the library for examples of calling the functions.
For more information on libraries and incorporating them into your scripts, see the Libraries section of the Pine Script User Manual.
🟩 TECHNICAL IMPLEMENTATION
Both FSM implementations support wildcards using blank strings "" or the special string "ANY". Wildcards match in this priority order:
• Exact state + exact event match
• Exact state + empty event (event wildcard)
• Empty state + exact event (state wildcard)
• Empty state + empty event (full wildcard)
When multiple rules match the same state + event combination, the FIRST rule encountered takes priority. In the matrix FSM, this means row order determines priority. In the map FSM, it's the order you add rules to each state.
The library uses user-defined types for the map FSM:
• o_eventRule : Maps a condition name to an output
• o_eventRuleWrapper : Wraps an array of rules (since maps can't contain arrays directly)
Everything uses strings for maximum library compatibility, though the examples show how to use enums for type safety by converting them to strings.
Unlike normal maps where adding a duplicate key overwrites the value, this library's `m_addRuleToEventMap()` method *combines* rules, making it intuitive to build rule sets without breaking them.
🟩 VALIDATION & ERROR HANDLING
The library includes comprehensive validation functions that catch common FSM design errors:
Error detection:
• Empty next states
• Invalid states not in the states array
• Duplicate rules
• Conflicting transitions
• Unreachable states (no entry/exit rules)
Warning detection:
• Redundant wildcards
• Empty states/events (potential unintended wildcards)
• Duplicate conditions within states
You can display validation results in tables on the chart, with tooltips providing detailed explanations. The helper functions to display the tables are exported so you can call them from your own script.
🟩 PRACTICAL EXAMPLES
The library includes four comprehensive demos:
Traffic Light Demo (Simple FSM) : Uses the matrix FSM to cycle through traffic light states (red → red+amber → green → amber → red) with timer events. Includes pseudo-random "break" events and repair logic to demonstrate wildcards and priority handling.
Trading Strategy Demo (Concurrent FSM) : Implements a realistic long-only trading strategy using BOTH FSM types:
• Map FSM converts multiple technical conditions (EMA crosses, gaps, fractals, RSI) into prioritised events
• Matrix FSM handles state transitions (idle → setup → entry → position → exit → re-entry)
• Includes position management, stop losses, and re-entry logic
Error Demonstrations : Both FSM types include error demos with intentionally malformed rules to showcase the validation system's capabilities.
🟩 BRING ON THE FUNCTIONS
f_printFSMMatrix(_mat_rules, _a_states, _tablePosition)
Prints a table of states and rules to the specified position on the chart. Works only with the matrix-based FSM.
Parameters:
_mat_rules (matrix)
_a_states (array)
_tablePosition (simple string)
Returns: The table of states and rules.
method m_loadMatrixRulesFromText(_mat_rules, _rulesText)
Loads rules into a rules matrix from a multiline string where each line is of the form "current state | event | next state" (ignores empty lines and trims whitespace).
This is the most human-readable way to define rules because it's a visually aligned, table-like format.
Namespace types: matrix
Parameters:
_mat_rules (matrix)
_rulesText (string)
Returns: No explicit return. The matrix is modified as a side-effect.
method m_addRuleToMatrix(_mat_rules, _currentState, _event, _nextState)
Adds a single rule to the rules matrix. This can also be quite readble if you use short variable names and careful spacing.
Namespace types: matrix
Parameters:
_mat_rules (matrix)
_currentState (string)
_event (string)
_nextState (string)
Returns: No explicit return. The matrix is modified as a side-effect.
method m_validateRulesMatrix(_mat_rules, _a_states, _showTable, _tablePosition)
Validates a rules matrix and a states array to check that they are well formed. Works only with the matrix-based FSM.
Checks: matrix has exactly 3 columns; no empty next states; all states defined in array; no duplicate states; no duplicate rules; all states have entry/exit rules; no conflicting transitions; no redundant wildcards. To avoid slowing down the script unnecessarily, call this method once (perhaps using `barstate.isfirst`), when the rules and states are ready.
Namespace types: matrix
Parameters:
_mat_rules (matrix)
_a_states (array)
_showTable (bool)
_tablePosition (simple string)
Returns: `true` if the rules and states are valid; `false` if errors or warnings exist.
method m_getStateFromMatrix(_mat_rules, _currentState, _event, _strictInput, _strictTransitions)
Returns the next state based on the current state and event, or `na` if no matching transition is found. Empty (not na) entries are treated as wildcards if `strictInput` is false.
Priority: exact match > event wildcard > state wildcard > full wildcard.
Namespace types: matrix
Parameters:
_mat_rules (matrix)
_currentState (string)
_event (string)
_strictInput (bool)
_strictTransitions (bool)
Returns: The next state or `na`.
method m_addRuleToEventMap(_map_eventRules, _state, _condName, _output)
Adds a single event rule to the event rules map. If the state key already exists, appends the new rule to the existing array (if different). If the state key doesn't exist, creates a new entry.
Namespace types: map
Parameters:
_map_eventRules (map)
_state (string)
_condName (string)
_output (string)
Returns: No explicit return. The map is modified as a side-effect.
method m_addEventRulesToMapFromText(_map_eventRules, _configText)
Loads event rules from a multiline text string into a map structure.
Format: "state | condName > output | condName > output | ..." . Pairs are ordered by priority. You can have multiple rules on the same line for one state.
Supports wildcards: Use an empty string ("") or the special string "ANY" for state or condName to create wildcard rules.
Examples: " | condName > output" (state wildcard), "state | > output" (condition wildcard), " | > output" (full wildcard).
Splits lines by , extracts state as key, creates/appends to array with new o_eventRule(condName, output).
Call once, e.g., on barstate.isfirst for best performance.
Namespace types: map
Parameters:
_map_eventRules (map)
_configText (string)
Returns: No explicit return. The map is modified as a side-effect.
f_printFSMMap(_map_eventRules, _a_states, _tablePosition)
Prints a table of map-based event rules to the specified position on the chart.
Parameters:
_map_eventRules (map)
_a_states (array)
_tablePosition (simple string)
Returns: The table of map-based event rules.
method m_validateEventRulesMap(_map_eventRules, _a_states, _a_validEvents, _showTable, _tablePosition)
Validates an event rules map to check that it's well formed.
Checks: map is not empty; wrappers contain non-empty arrays; no duplicate condition names per state; no empty fields in o_eventRule objects; optionally validates outputs against matrix events.
NOTE: Both "" and "ANY" are treated identically as wildcards for both states and conditions.
To avoid slowing down the script unnecessarily, call this method once (perhaps using `barstate.isfirst`), when the map is ready.
Namespace types: map
Parameters:
_map_eventRules (map)
_a_states (array)
_a_validEvents (array)
_showTable (bool)
_tablePosition (simple string)
Returns: `true` if the event rules map is valid; `false` if errors or warnings exist.
method m_getEventFromConditionsMap(_currentState, _a_activeConditions, _map_eventRules)
Returns a single event or state string based on the current state and active conditions.
Uses a map of event rules where rules are pre-sorted by implicit priority via load order.
Supports wildcards using empty string ("") or "ANY" for flexible rule matching.
Priority: exact match > condition wildcard > state wildcard > full wildcard.
Namespace types: series string, simple string, input string, const string
Parameters:
_currentState (string)
_a_activeConditions (array)
_map_eventRules (map)
Returns: The output string (event or state) for the first matching condition, or na if no match found.
o_eventRule
o_eventRule defines a condition-to-output mapping for the concurrent FSM.
Fields:
condName (series string) : The name of the condition to check.
output (series string) : The output (event or state) when the condition is true.
o_eventRuleWrapper
o_eventRuleWrapper wraps an array of o_eventRule for use as map values (maps cannot contain collections directly).
Fields:
a_rules (array) : Array of o_eventRule objects for a specific state.

Bar Index & TimeLibrary to convert a bar index to a timestamp and vice versa.
Utilizes runtime memory to store the 𝚝𝚒𝚖𝚎 and 𝚝𝚒𝚖𝚎_𝚌𝚕𝚘𝚜𝚎 values of every bar on the chart (and optional future bars), with the ability of storing additional custom values for every chart bar.
█ PREFACE
This library aims to tackle some problems that pine coders (from beginners to advanced) often come across, such as:
I'm trying to draw an object with a 𝚋𝚊𝚛_𝚒𝚗𝚍𝚎𝚡 that is more than 10,000 bars into the past, but this causes my script to fail. How can I convert the 𝚋𝚊𝚛_𝚒𝚗𝚍𝚎𝚡 to a UNIX time so that I can draw visuals using xloc.bar_time ?
I have a diagonal line drawing and I want to get the "y" value at a specific time, but line.get_price() only accepts a bar index value. How can I convert the timestamp into a bar index value so that I can still use this function?
I want to get a previous 𝚘𝚙𝚎𝚗 value that occurred at a specific timestamp. How can I convert the timestamp into a historical offset so that I can use 𝚘𝚙𝚎𝚗 ?
I want to reference a very old value for a variable. How can I access a previous value that is older than the maximum historical buffer size of 𝚟𝚊𝚛𝚒𝚊𝚋𝚕𝚎 ?
This library can solve the above problems (and many more) with the addition of a few lines of code, rather than requiring the coder to refactor their script to accommodate the limitations.
█ OVERVIEW
The core functionality provided is conversion between xloc.bar_index and xloc.bar_time values.
The main component of the library is the 𝙲𝚑𝚊𝚛𝚝𝙳𝚊𝚝𝚊 object, created via the 𝚌𝚘𝚕𝚕𝚎𝚌𝚝𝙲𝚑𝚊𝚛𝚝𝙳𝚊𝚝𝚊() function which basically stores the 𝚝𝚒𝚖𝚎 and 𝚝𝚒𝚖𝚎_𝚌𝚕𝚘𝚜𝚎 of every bar on the chart, and there are 3 more overloads to this function that allow collecting and storing additional data. Once a 𝙲𝚑𝚊𝚛𝚝𝙳𝚊𝚝𝚊 object is created, use any of the exported methods:
Methods to convert a UNIX timestamp into a bar index or bar offset:
𝚝𝚒𝚖𝚎𝚜𝚝𝚊𝚖𝚙𝚃𝚘𝙱𝚊𝚛𝙸𝚗𝚍𝚎𝚡(), 𝚐𝚎𝚝𝙽𝚞𝚖𝚋𝚎𝚛𝙾𝚏𝙱𝚊𝚛𝚜𝙱𝚊𝚌𝚔()
Methods to retrieve the stored data for a bar index:
𝚝𝚒𝚖𝚎𝙰𝚝𝙱𝚊𝚛𝙸𝚗𝚍𝚎𝚡(), 𝚝𝚒𝚖𝚎𝙲𝚕𝚘𝚜𝚎𝙰𝚝𝙱𝚊𝚛𝙸𝚗𝚍𝚎𝚡(), 𝚟𝚊𝚕𝚞𝚎𝙰𝚝𝙱𝚊𝚛𝙸𝚗𝚍𝚎𝚡(), 𝚐𝚎𝚝𝙰𝚕𝚕𝚅𝚊𝚛𝚒𝚊𝚋𝚕𝚎𝚜𝙰𝚝𝙱𝚊𝚛𝙸𝚗𝚍𝚎𝚡()
Methods to retrieve the stored data at a number of bars back (i.e., historical offset):
𝚝𝚒𝚖𝚎(), 𝚝𝚒𝚖𝚎𝙲𝚕𝚘𝚜𝚎(), 𝚟𝚊𝚕𝚞𝚎()
Methods to retrieve all the data points from the earliest bar (or latest bar) stored in memory, which can be useful for debugging purposes:
𝚐𝚎𝚝𝙴𝚊𝚛𝚕𝚒𝚎𝚜𝚝𝚂𝚝𝚘𝚛𝚎𝚍𝙳𝚊𝚝𝚊(), 𝚐𝚎𝚝𝙻𝚊𝚝𝚎𝚜𝚝𝚂𝚝𝚘𝚛𝚎𝚍𝙳𝚊𝚝𝚊()
Note: the library's strong suit is referencing data from very old bars in the past, which is especially useful for scripts that perform its necessary calculations only on the last bar.
█ USAGE
Step 1
Import the library. Replace with the latest available version number for this library.
//@version=6
indicator("Usage")
import n00btraders/ChartData/
Step 2
Create a 𝙲𝚑𝚊𝚛𝚝𝙳𝚊𝚝𝚊 object to collect data on every bar. Do not declare as `var` or `varip`.
chartData = ChartData.collectChartData() // call on every bar to accumulate the necessary data
Step 3
Call any method(s) on the 𝙲𝚑𝚊𝚛𝚝𝙳𝚊𝚝𝚊 object. Do not modify its fields directly.
if barstate.islast
int firstBarTime = chartData.timeAtBarIndex(0)
int lastBarTime = chartData.time(0)
log.info("First `time`: " + str.format_time(firstBarTime) + ", Last `time`: " + str.format_time(lastBarTime))
█ EXAMPLES
• Collect Future Times
The overloaded 𝚌𝚘𝚕𝚕𝚎𝚌𝚝𝙲𝚑𝚊𝚛𝚝𝙳𝚊𝚝𝚊() functions that accept a 𝚋𝚊𝚛𝚜𝙵𝚘𝚛𝚠𝚊𝚛𝚍 argument can additionally store time values for up to 500 bars into the future.
//@version=6
indicator("Example `collectChartData(barsForward)`")
import n00btraders/ChartData/1
chartData = ChartData.collectChartData(barsForward = 500)
var rectangle = box.new(na, na, na, na, xloc = xloc.bar_time, force_overlay = true)
if barstate.islast
int futureTime = chartData.timeAtBarIndex(bar_index + 100)
int lastBarTime = time
box.set_lefttop(rectangle, lastBarTime, open)
box.set_rightbottom(rectangle, futureTime, close)
box.set_text(rectangle, "Extending box 100 bars to the right. Time: " + str.format_time(futureTime))
• Collect Custom Data
The overloaded 𝚌𝚘𝚕𝚕𝚎𝚌𝚝𝙲𝚑𝚊𝚛𝚝𝙳𝚊𝚝𝚊() functions that accept a 𝚟𝚊𝚛𝚒𝚊𝚋𝚕𝚎𝚜 argument can additionally store custom user-specified values for every bar on the chart.
//@version=6
indicator("Example `collectChartData(variables)`")
import n00btraders/ChartData/1
var map variables = map.new()
variables.put("open", open)
variables.put("close", close)
variables.put("open-close midpoint", (open + close) / 2)
variables.put("boolean", open > close ? 1 : 0)
chartData = ChartData.collectChartData(variables = variables)
var fgColor = chart.fg_color
var table1 = table.new(position.top_right, 2, 9, color(na), fgColor, 1, fgColor, 1, true)
var table2 = table.new(position.bottom_right, 2, 9, color(na), fgColor, 1, fgColor, 1, true)
if barstate.isfirst
table.cell(table1, 0, 0, "ChartData.value()", text_color = fgColor)
table.cell(table2, 0, 0, "open ", text_color = fgColor)
table.merge_cells(table1, 0, 0, 1, 0)
table.merge_cells(table2, 0, 0, 1, 0)
for i = 1 to 8
table.cell(table1, 0, i, text_color = fgColor, text_halign = text.align_left, text_font_family = font.family_monospace)
table.cell(table2, 0, i, text_color = fgColor, text_halign = text.align_left, text_font_family = font.family_monospace)
table.cell(table1, 1, i, text_color = fgColor)
table.cell(table2, 1, i, text_color = fgColor)
if barstate.islast
for i = 1 to 8
float open1 = chartData.value("open", 5000 * i)
float open2 = i < 3 ? open : -1
table.cell_set_text(table1, 0, i, "chartData.value(\"open\", " + str.tostring(5000 * i) + "): ")
table.cell_set_text(table2, 0, i, "open : ")
table.cell_set_text(table1, 1, i, str.tostring(open1))
table.cell_set_text(table2, 1, i, open2 >= 0 ? str.tostring(open2) : "Error")
• xloc.bar_index → xloc.bar_time
The 𝚝𝚒𝚖𝚎 value (or 𝚝𝚒𝚖𝚎_𝚌𝚕𝚘𝚜𝚎 value) can be retrieved for any bar index that is stored in memory by the 𝙲𝚑𝚊𝚛𝚝𝙳𝚊𝚝𝚊 object.
//@version=6
indicator("Example `timeAtBarIndex()`")
import n00btraders/ChartData/1
chartData = ChartData.collectChartData()
if barstate.islast
int start = bar_index - 15000
int end = bar_index - 100
// line.new(start, close, end, close) // !ERROR - `start` value is too far from current bar index
start := chartData.timeAtBarIndex(start)
end := chartData.timeAtBarIndex(end)
line.new(start, close, end, close, xloc.bar_time, width = 10)
• xloc.bar_time → xloc.bar_index
Use 𝚝𝚒𝚖𝚎𝚜𝚝𝚊𝚖𝚙𝚃𝚘𝙱𝚊𝚛𝙸𝚗𝚍𝚎𝚡() to find the bar that a timestamp belongs to.
If the timestamp falls in between the close of one bar and the open of the next bar,
the 𝚜𝚗𝚊𝚙 parameter can be used to determine which bar to choose:
𝚂𝚗𝚊𝚙.𝙻𝙴𝙵𝚃 - prefer to choose the leftmost bar (typically used for closing times)
𝚂𝚗𝚊𝚙.𝚁𝙸𝙶𝙷𝚃 - prefer to choose the rightmost bar (typically used for opening times)
𝚂𝚗𝚊𝚙.𝙳𝙴𝙵𝙰𝚄𝙻𝚃 (or 𝚗𝚊) - copies the same behavior as xloc.bar_time uses for drawing objects
//@version=6
indicator("Example `timestampToBarIndex()`")
import n00btraders/ChartData/1
startTimeInput = input.time(timestamp("01 Aug 2025 08:30 -0500"), "Session Start Time")
endTimeInput = input.time(timestamp("01 Aug 2025 15:15 -0500"), "Session End Time")
chartData = ChartData.collectChartData()
if barstate.islastconfirmedhistory
int startBarIndex = chartData.timestampToBarIndex(startTimeInput, ChartData.Snap.RIGHT)
int endBarIndex = chartData.timestampToBarIndex(endTimeInput, ChartData.Snap.LEFT)
line1 = line.new(startBarIndex, 0, startBarIndex, 1, extend = extend.both, color = color.new(color.green, 60), force_overlay = true)
line2 = line.new(endBarIndex, 0, endBarIndex, 1, extend = extend.both, color = color.new(color.green, 60), force_overlay = true)
linefill.new(line1, line2, color.new(color.green, 90))
// using Snap.DEFAULT to show that it is equivalent to drawing lines using `xloc.bar_time` (i.e., it aligns to the same bars)
startBarIndex := chartData.timestampToBarIndex(startTimeInput)
endBarIndex := chartData.timestampToBarIndex(endTimeInput)
line.new(startBarIndex, 0, startBarIndex, 1, extend = extend.both, color = color.yellow, width = 3)
line.new(endBarIndex, 0, endBarIndex, 1, extend = extend.both, color = color.yellow, width = 3)
line.new(startTimeInput, 0, startTimeInput, 1, xloc.bar_time, extend.both, color.new(color.blue, 85), width = 11)
line.new(endTimeInput, 0, endTimeInput, 1, xloc.bar_time, extend.both, color.new(color.blue, 85), width = 11)
• Get Price of Line at Timestamp
The pine script built-in function line.get_price() requires working with bar index values. To get the price of a line in terms of a timestamp, convert the timestamp into a bar index or offset.
//@version=6
indicator("Example `line.get_price()` at timestamp")
import n00btraders/ChartData/1
lineStartInput = input.time(timestamp("01 Aug 2025 08:30 -0500"), "Line Start")
chartData = ChartData.collectChartData()
var diagonal = line.new(na, na, na, na, force_overlay = true)
if time <= lineStartInput
line.set_xy1(diagonal, bar_index, open)
if barstate.islastconfirmedhistory
line.set_xy2(diagonal, bar_index, close)
if barstate.islast
int timeOneWeekAgo = timenow - (7 * timeframe.in_seconds("1D") * 1000)
// Note: could also use `timetampToBarIndex(timeOneWeekAgo, Snap.DEFAULT)` and pass the value directly to `line.get_price()`
int barsOneWeekAgo = chartData.getNumberOfBarsBack(timeOneWeekAgo)
float price = line.get_price(diagonal, bar_index - barsOneWeekAgo)
string formatString = "Time 1 week ago: {0,number,#} - Equivalent to {1} bars ago 𝚕𝚒𝚗𝚎.𝚐𝚎𝚝_𝚙𝚛𝚒𝚌𝚎(): {2,number,#.##}"
string labelText = str.format(formatString, timeOneWeekAgo, barsOneWeekAgo, price)
label.new(timeOneWeekAgo, price, labelText, xloc.bar_time, style = label.style_label_lower_right, size = 16, textalign = text.align_left, force_overlay = true)
█ RUNTIME ERROR MESSAGES
This library's functions will generate a custom runtime error message in the following cases:
𝚌𝚘𝚕𝚕𝚎𝚌𝚝𝙲𝚑𝚊𝚛𝚝𝙳𝚊𝚝𝚊() is not called consecutively, or is called more than once on a single bar
Invalid 𝚋𝚊𝚛𝚜𝙵𝚘𝚛𝚠𝚊𝚛𝚍 argument in the 𝚌𝚘𝚕𝚕𝚎𝚌𝚝𝙲𝚑𝚊𝚛𝚝𝙳𝚊𝚝𝚊() function
Invalid 𝚟𝚊𝚛𝚒𝚊𝚋𝚕𝚎𝚜 argument in the 𝚌𝚘𝚕𝚕𝚎𝚌𝚝𝙲𝚑𝚊𝚛𝚝𝙳𝚊𝚝𝚊() function
Invalid 𝚕𝚎𝚗𝚐𝚝𝚑 argument in any of the functions that accept a number of bars back
Note: there is no runtime error generated for an invalid 𝚝𝚒𝚖𝚎𝚜𝚝𝚊𝚖𝚙 or 𝚋𝚊𝚛𝙸𝚗𝚍𝚎𝚡 argument in any of the functions. Instead, the functions will assign 𝚗𝚊 to the returned values.
Any other runtime errors are due to incorrect usage of the library.
█ NOTES
• Function Descriptions
The library source code uses Markdown for the exported functions. Hover over a function/method call in the Pine Editor to display formatted, detailed information about the function/method.
//@version=6
indicator("Demo Function Tooltip")
import n00btraders/ChartData/1
chartData = ChartData.collectChartData()
int barIndex = chartData.timestampToBarIndex(timenow)
log.info(str.tostring(barIndex))
• Historical vs. Realtime Behavior
Under the hood, the data collector for this library is declared as `var`. Because of this, the 𝙲𝚑𝚊𝚛𝚝𝙳𝚊𝚝𝚊 object will always reflect the latest available data on realtime updates. Any data that is recorded for historical bars will remain unchanged throughout the execution of a script.
//@version=6
indicator("Demo Realtime Behavior")
import n00btraders/ChartData/1
var map variables = map.new()
variables.put("open", open)
variables.put("close", close)
chartData = ChartData.collectChartData(variables)
if barstate.isrealtime
varip float initialOpen = open
varip float initialClose = close
varip int updateCount = 0
updateCount += 1
float latestOpen = open
float latestClose = close
float recordedOpen = chartData.valueAtBarIndex("open", bar_index)
float recordedClose = chartData.valueAtBarIndex("close", bar_index)
string formatString = "# of updates: {0} 𝚘𝚙𝚎𝚗 at update #1: {1,number,#.##} 𝚌𝚕𝚘𝚜𝚎 at update #1: {2,number,#.##} "
+ "𝚘𝚙𝚎𝚗 at update #{0}: {3,number,#.##} 𝚌𝚕𝚘𝚜𝚎 at update #{0}: {4,number,#.##} "
+ "𝚘𝚙𝚎𝚗 stored in memory: {5,number,#.##} 𝚌𝚕𝚘𝚜𝚎 stored in memory: {6,number,#.##}"
string labelText = str.format(formatString, updateCount, initialOpen, initialClose, latestOpen, latestClose, recordedOpen, recordedClose)
label.new(bar_index, close, labelText, style = label.style_label_left, force_overlay = true)
• Collecting Chart Data for Other Contexts
If your use case requires collecting chart data from another context, avoid directly retrieving the 𝙲𝚑𝚊𝚛𝚝𝙳𝚊𝚝𝚊 object as this may exceed memory limits .
//@version=6
indicator("Demo Return Calculated Results")
import n00btraders/ChartData/1
timeInput = input.time(timestamp("01 Sep 2025 08:30 -0500"), "Time")
var int oneMinuteBarsAgo = na
// !ERROR - Memory Limits Exceeded
// chartDataArray = request.security_lower_tf(syminfo.tickerid, "1", ChartData.collectChartData())
// oneMinuteBarsAgo := chartDataArray.last().getNumberOfBarsBack(timeInput)
// function that returns calculated results (a single integer value instead of an entire `ChartData` object)
getNumberOfBarsBack() =>
chartData = ChartData.collectChartData()
chartData.getNumberOfBarsBack(timeInput)
calculatedResultsArray = request.security_lower_tf(syminfo.tickerid, "1", getNumberOfBarsBack())
oneMinuteBarsAgo := calculatedResultsArray.size() > 0 ? calculatedResultsArray.last() : na
if barstate.islast
string labelText = str.format("The selected timestamp occurs 1-minute bars ago", oneMinuteBarsAgo)
label.new(bar_index, hl2, labelText, style = label.style_label_left, size = 16, force_overlay = true)
• Memory Usage
The library's convenience and ease of use comes at the cost of increased usage of computational resources. For simple scripts, using this library will likely not cause any issues with exceeding memory limits. But for large and complex scripts, you can reduce memory issues by specifying a lower 𝚌𝚊𝚕𝚌_𝚋𝚊𝚛𝚜_𝚌𝚘𝚞𝚗𝚝 amount in the indicator() or strategy() declaration statement.
//@version=6
// !ERROR - Memory Limits Exceeded using the default number of bars available (~20,000 bars for Premium plans)
//indicator("Demo `calc_bars_count` parameter")
// Reduce number of bars using `calc_bars_count` parameter
indicator("Demo `calc_bars_count` parameter", calc_bars_count = 15000)
import n00btraders/ChartData/1
map variables = map.new()
variables.put("open", open)
variables.put("close", close)
variables.put("weekofyear", weekofyear)
variables.put("dayofmonth", dayofmonth)
variables.put("hour", hour)
variables.put("minute", minute)
variables.put("second", second)
// simulate large memory usage
chartData0 = ChartData.collectChartData(variables)
chartData1 = ChartData.collectChartData(variables)
chartData2 = ChartData.collectChartData(variables)
chartData3 = ChartData.collectChartData(variables)
chartData4 = ChartData.collectChartData(variables)
chartData5 = ChartData.collectChartData(variables)
chartData6 = ChartData.collectChartData(variables)
chartData7 = ChartData.collectChartData(variables)
chartData8 = ChartData.collectChartData(variables)
chartData9 = ChartData.collectChartData(variables)
log.info(str.tostring(chartData0.time(0)))
log.info(str.tostring(chartData1.time(0)))
log.info(str.tostring(chartData2.time(0)))
log.info(str.tostring(chartData3.time(0)))
log.info(str.tostring(chartData4.time(0)))
log.info(str.tostring(chartData5.time(0)))
log.info(str.tostring(chartData6.time(0)))
log.info(str.tostring(chartData7.time(0)))
log.info(str.tostring(chartData8.time(0)))
log.info(str.tostring(chartData9.time(0)))
if barstate.islast
result = table.new(position.middle_right, 1, 1, force_overlay = true)
table.cell(result, 0, 0, "Script Execution Successful ✅", text_size = 40)
█ EXPORTED ENUMS
Snap
Behavior for determining the bar that a timestamp belongs to.
Fields:
LEFT : Snap to the leftmost bar.
RIGHT : Snap to the rightmost bar.
DEFAULT : Default `xloc.bar_time` behavior.
Note: this enum is used for the 𝚜𝚗𝚊𝚙 parameter of 𝚝𝚒𝚖𝚎𝚜𝚝𝚊𝚖𝚙𝚃𝚘𝙱𝚊𝚛𝙸𝚗𝚍𝚎𝚡().
█ EXPORTED TYPES
Note: users of the library do not need to worry about directly accessing the fields of these types; all computations are done through method calls on an object of the 𝙲𝚑𝚊𝚛𝚝𝙳𝚊𝚝𝚊 type.
Variable
Represents a user-specified variable that can be tracked on every chart bar.
Fields:
name (series string) : Unique identifier for the variable.
values (array) : The array of stored values (one value per chart bar).
ChartData
Represents data for all bars on a chart.
Fields:
bars (series int) : Current number of bars on the chart.
timeValues (array) : The `time` values of all chart (and future) bars.
timeCloseValues (array) : The `time_close` values of all chart (and future) bars.
variables (array) : Additional custom values to track on all chart bars.
█ EXPORTED FUNCTIONS
collectChartData()
Collects and tracks the `time` and `time_close` value of every bar on the chart.
Returns: `ChartData` object to convert between `xloc.bar_index` and `xloc.bar_time`.
collectChartData(barsForward)
Collects and tracks the `time` and `time_close` value of every bar on the chart as well as a specified number of future bars.
Parameters:
barsForward (simple int) : Number of future bars to collect data for.
Returns: `ChartData` object to convert between `xloc.bar_index` and `xloc.bar_time`.
collectChartData(variables)
Collects and tracks the `time` and `time_close` value of every bar on the chart. Additionally, tracks a custom set of variables for every chart bar.
Parameters:
variables (simple map) : Custom values to collect on every chart bar.
Returns: `ChartData` object to convert between `xloc.bar_index` and `xloc.bar_time`.
collectChartData(barsForward, variables)
Collects and tracks the `time` and `time_close` value of every bar on the chart as well as a specified number of future bars. Additionally, tracks a custom set of variables for every chart bar.
Parameters:
barsForward (simple int) : Number of future bars to collect data for.
variables (simple map) : Custom values to collect on every chart bar.
Returns: `ChartData` object to convert between `xloc.bar_index` and `xloc.bar_time`.
█ EXPORTED METHODS
method timestampToBarIndex(chartData, timestamp, snap)
Converts a UNIX timestamp to a bar index.
Namespace types: ChartData
Parameters:
chartData (series ChartData) : The `ChartData` object.
timestamp (series int) : A UNIX time.
snap (series Snap) : A `Snap` enum value.
Returns: A bar index, or `na` if unable to find the appropriate bar index.
method getNumberOfBarsBack(chartData, timestamp)
Converts a UNIX timestamp to a history-referencing length (i.e., number of bars back).
Namespace types: ChartData
Parameters:
chartData (series ChartData) : The `ChartData` object.
timestamp (series int) : A UNIX time.
Returns: A bar offset, or `na` if unable to find a valid number of bars back.
method timeAtBarIndex(chartData, barIndex)
Retrieves the `time` value for the specified bar index.
Namespace types: ChartData
Parameters:
chartData (series ChartData) : The `ChartData` object.
barIndex (int) : The bar index.
Returns: The `time` value, or `na` if there is no `time` stored for the bar index.
method time(chartData, length)
Retrieves the `time` value of the bar that is `length` bars back relative to the latest bar.
Namespace types: ChartData
Parameters:
chartData (series ChartData) : The `ChartData` object.
length (series int) : Number of bars back.
Returns: The `time` value `length` bars ago, or `na` if there is no `time` stored for that bar.
method timeCloseAtBarIndex(chartData, barIndex)
Retrieves the `time_close` value for the specified bar index.
Namespace types: ChartData
Parameters:
chartData (series ChartData) : The `ChartData` object.
barIndex (series int) : The bar index.
Returns: The `time_close` value, or `na` if there is no `time_close` stored for the bar index.
method timeClose(chartData, length)
Retrieves the `time_close` value of the bar that is `length` bars back from the latest bar.
Namespace types: ChartData
Parameters:
chartData (series ChartData) : The `ChartData` object.
length (series int) : Number of bars back.
Returns: The `time_close` value `length` bars ago, or `na` if there is none stored.
method valueAtBarIndex(chartData, name, barIndex)
Retrieves the value of a custom variable for the specified bar index.
Namespace types: ChartData
Parameters:
chartData (series ChartData) : The `ChartData` object.
name (series string) : The variable name.
barIndex (series int) : The bar index.
Returns: The value of the variable, or `na` if that variable is not stored for the bar index.
method value(chartData, name, length)
Retrieves a variable value of the bar that is `length` bars back relative to the latest bar.
Namespace types: ChartData
Parameters:
chartData (series ChartData) : The `ChartData` object.
name (series string) : The variable name.
length (series int) : Number of bars back.
Returns: The value `length` bars ago, or `na` if that variable is not stored for the bar index.
method getAllVariablesAtBarIndex(chartData, barIndex)
Retrieves all custom variables for the specified bar index.
Namespace types: ChartData
Parameters:
chartData (series ChartData) : The `ChartData` object.
barIndex (series int) : The bar index.
Returns: Map of all custom variables that are stored for the specified bar index.
method getEarliestStoredData(chartData)
Gets all values from the earliest bar data that is currently stored in memory.
Namespace types: ChartData
Parameters:
chartData (series ChartData) : The `ChartData` object.
Returns: A tuple:
method getLatestStoredData(chartData, futureData)
Gets all values from the latest bar data that is currently stored in memory.
Namespace types: ChartData
Parameters:
chartData (series ChartData) : The `ChartData` object.
futureData (series bool) : Whether to include the future data that is stored in memory.
Returns: A tuple:

nineLivesUtilLibLibrary "nineLivesUtilLib"
isDateInRange(currentTime, useTimeFilter, startDate, endDate)
Checks if the current time is within the specified date range.
Parameters:
currentTime (int) : The current bar's time (time).
useTimeFilter (bool) : Bool 📅: Enable the date range filter.
startDate (int) : Timestamp 📅: The start date for the filter.
endDate (int) : Timestamp 📅: The end date for the filter.
Returns: True if the current time is within the range or filtering is disabled, false otherwise.
@example
inDateRange = nineLivesUtilLib.isDateInRange(time, useTimeFilter, startDate, endDate)
if inDateRange
// Execute trading logic
checkVolumeCondition(currentVolume, useVolumeFilter, volumeThresholdMultiplier, volumeLength)
Checks if the current volume meets the threshold condition.
Parameters:
currentVolume (float) : The current bar's volume (volume).
useVolumeFilter (bool) : Bool 📊: Enable the volume filter.
volumeThresholdMultiplier (float) : Float 📊: Volume threshold relative to average (e.g., 1.5 for 1.5x average).
volumeLength (int) : Int 📊: Lookback length for the volume average.
Returns: True if the volume condition is met or filtering is disabled, false otherwise.
@example
volumeOk = nineLivesUtilLib.checkVolumeCondition(volume, useVolumeFilter, volumeThreshold, volumeLength)
if volumeOk
// Proceed with trading logic
checkMultiTimeframeCondition(currentClose, currentOpen, htfClose, htfOpen, useMultiTimeframe, alignment)
Checks alignment with higher timeframe direction.
Parameters:
currentClose (float) : Float: The current bar's closing price (close).
currentOpen (float) : Float: The current bar's opening price (open).
htfClose (float) : Float: The closing price from the higher timeframe (must be fetched by the calling script using request.security).
htfOpen (float) : Float: The opening price from the higher timeframe (must be fetched by the calling script using request.security).
useMultiTimeframe (bool) : Bool ⏱️: Enable multi-timeframe analysis.
alignment (string) : String ⏱️: Desired alignment ("same", "opposite", "any").
Returns: True if the timeframe alignment condition is met or analysis is disabled, false otherwise.
@example
// In the calling script:
= request.security(syminfo.tickerid, higherTimeframe, )
tfOk = nineLivesUtilLib.checkMultiTimeframeCondition(close, open, htfClose, htfOpen, useMultiTimeframe, tfAlignment)
if tfOk
// Proceed with trading logic
checkMarketRegime(useMarketRegime, regimeIndicator, regimeThreshold, regimeLength, regimeMode)
Detects the market regime (trending or ranging) and checks if trading is allowed.
Parameters:
useMarketRegime (bool) : Bool 🔍: Enable market regime detection.
regimeIndicator (string) : String 🔍: Indicator to use ("ADX" or "Volatility").
regimeThreshold (int) : Int 🔍: Threshold for trend strength/volatility.
regimeLength (simple int) : Int 🔍: Lookback length for the indicator.
regimeMode (string) : String 🔍: Trading mode based on regime ("trend_only", "range_only", "adaptive").
Returns: A tuple containing:
: conditionMet (bool) - True if trading is allowed based on the regime mode and detection, false otherwise.
: inTrendingRegime (bool) - True if the current regime is trending based on the indicator and threshold.
@example
= nineLivesUtilLib.checkMarketRegime(useMarketRegime, regimeIndicator, regimeThreshold, regimeLength, regimeMode)
if regimeOk
// Proceed with trading logic
applyCooldown(buySignal, sellSignal, cooldownBars)
Applies a cooldown period after a signal.
Parameters:
buySignal (bool) : Bool: Buy signal (potentially after primary entry logic).
sellSignal (bool) : Bool: Sell signal (potentially after primary entry logic).
cooldownBars (int) : Int ⏳: The number of bars to wait after a signal before allowing another.
Returns: A tuple containing:
: cooldownFilteredBuy (bool) - Buy signal after cooldown filter.
: cooldownFilteredSell (bool) - Sell signal after cooldown filter.
@example
= nineLivesUtilLib.applyCooldown(rawBuySignal, rawSellSignal, iCool)
applyAllFilters(rawBuy, rawSell, inDateRange, tradeDirection, volumeOk, tfOk, regimeOk, drawdownOk, cooldownOkBuy, cooldownOkSell)
Applies all filtering conditions to the buy and sell signals.
Parameters:
rawBuy (bool) : Bool: The initial buy signal candidate (from primary entry logic, e.g., after cooldown).
rawSell (bool) : Bool: The initial sell signal candidate (from primary entry logic, e.g., after cooldown).
inDateRange (bool) : Bool 📅: Result from isDateInRange.
tradeDirection (string) : String 🔄: Overall trade direction preference ("longs_only", "shorts_only", "both").
volumeOk (bool) : Bool 📊: Result from checkVolumeCondition.
tfOk (bool) : Bool ⏱️: Result from checkMultiTimeframeCondition.
regimeOk (bool) : Bool 🔍: Result from checkMarketRegime.
drawdownOk (bool) : Bool 📉: Result from checkDrawdownExceeded (or equivalent).
cooldownOkBuy (bool) : Bool ⏳: Result from applyCooldown for buy.
cooldownOkSell (bool) : Bool ⏳: Result from applyCooldown for sell.
Returns: A tuple containing:
: finalBuySignal (bool) - The final buy signal after all filters.
: finalSellSignal (bool) - The final sell signal after all filters.
@example
= nineLivesUtilLib.applyAllFilters(cooldownBuy, cooldownSell, inDateRange, tradeDirection, volumeOk, tfOk, regimeOk, !drawdownExceeded, cooldownBuy, cooldownSell)
NOTE: This function filters signals generated by your primary entry logic (e.g., EMA crossover).
checkDrawdownExceeded(currentEquity, useMaxDrawdown, maxDrawdownPercent)
Tracks maximum equity and checks if current drawdown exceeds a threshold.
Parameters:
currentEquity (float) : Float: The strategy's current equity (strategy.equity).
useMaxDrawdown (bool) : Bool 📉: Enable max drawdown protection.
maxDrawdownPercent (float) : Float 📉: The maximum allowed drawdown as a percentage.
Returns: True if drawdown protection is enabled and the current drawdown exceeds the threshold, false otherwise.
@example
drawdownExceeded = nineLivesUtilLib.checkDrawdownExceeded(strategy.equity, useMaxDrawdown, maxDrawdownPercent)
if drawdownExceeded
// Consider stopping entries or exiting positions in the strategy script
calculateExitPrice(positionAvgPrice, percentage, isStop, isLong)
Calculates a stop loss or take profit price based on a percentage from the average entry price.
Parameters:
positionAvgPrice (float) : Float: The average price of the current position (strategy.position_avg_price).
percentage (float) : Float: The stop loss or take profit percentage (e.g., 2.0 for 2%).
isStop (bool) : Bool: True if calculating a stop loss price, false if calculating a take profit price.
isLong (bool) : Bool: True if the position is long, false if short.
Returns: The calculated stop price or take profit price, or na if no position or percentage is invalid.
@example
longSL = nineLivesUtilLib.calculateExitPrice(strategy.position_avg_price, stopLossPercent, true, true)
shortTP = nineLivesUtilLib.calculateExitPrice(strategy.position_avg_price, takeProfitPercent, false, false)
calculateTrailingStopLevel(positionAvgPrice, trailOffsetPercent, trailPercent, currentHigh, currentLow, isLong)
Calculates the current trailing stop level for a position.
Parameters:
positionAvgPrice (float) : Float: The average price of the current position (strategy.position_avg_price).
trailOffsetPercent (float) : Float 🔄: The percentage price movement to activate the trailing stop.
trailPercent (float) : Float 🔄: The percentage distance the stop trails behind the price.
currentHigh (float) : Float: The current bar's high (high).
currentLow (float) : Float: The current bar's low (low).
isLong (bool) : Bool: True if the position is long, false if short.
Returns: The calculated trailing stop price if active, otherwise na.
@example
longTrailStop = nineLivesUtilLib.calculateTrailingStopLevel(strategy.position_avg_price, trailOffset, trailPercent, high, low, true)
shortTrailStop = nineLivesUtilLib.calculateTrailingStopLevel(strategy.position_avg_price, trailOffset, trailPercent, high, low, false)
if not na(longTrailStop)
strategy.exit("Long Trail", from_entry="Long", stop=longTrailStop)
JsonAlertJsonAlert Library – Convert TradingView Alerts to JSON for Server Processing! 📡
🚀 The JsonAlert library makes it easy to send TradingView alerts as structured JSON to your server, allowing seamless integration with automated trading systems, databases, or webhook-based services.
📌 Features:
✅ Converts TradingView alert data into JSON format
✅ Supports custom key-value pairs for flexibility
✅ Allows frequency control (once per bar, once per bar close, every update)
✅ Easy to integrate with server-side PHP or other languages
Note that you have to pass one string array for keys and one string array for values , also you should pass alert frequency .
📖 Example Usage in Pine Script:
//@version=6
indicator("My script" , overlay = true)
import Penhan/JsonAlert/1 as alrt
if high > low
var array keys = array.from("ticker", "timeframe", "pattern")
var array values = array.from( syminfo.ticker , timeframe.period , str.tostring(123.45) )
alrt.alarm (keys, values , alert.freq_once_per_bar)
📡 Json Output Example:
{"ticker": "BTCUSDT","timeframe": "1","pattern": "123.45"}
🖥️ Server-Side PHP Example:
There you can integrate JsonAlert with your server in seconds! :)

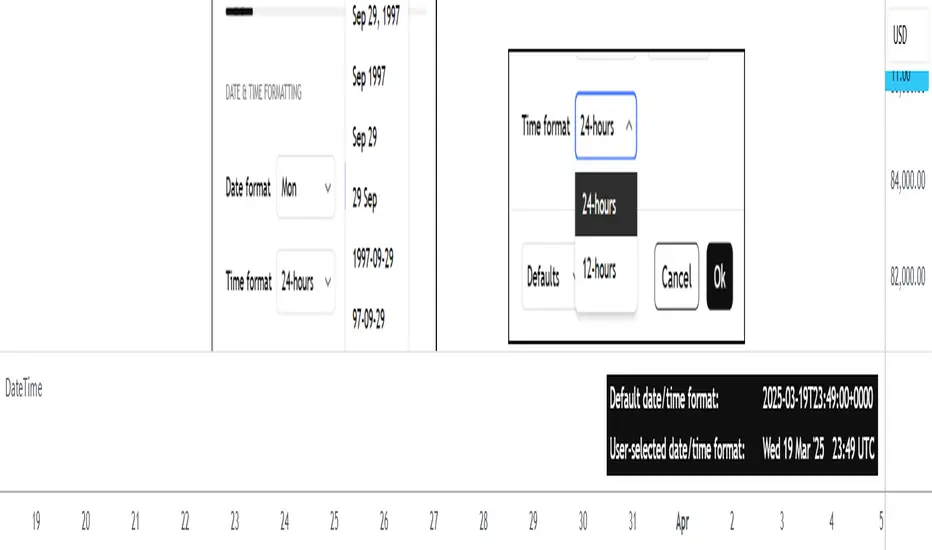
DateTimeLibrary with enums that can be used as script inputs to allow users to set their preferred date and/or time formats. The user-selected formats can be passed to the library functions (which use 𝚜𝚝𝚛.𝚏𝚘𝚛𝚖𝚊𝚝_𝚝𝚒𝚖𝚎() under the hood) to get formatted date and time strings from a UNIX time.
PREFACE
The target audience of this publication is users creating their own indicators/strategies.
Sometimes a date and/or time needs to be displayed to the user. As a Pine Coder, it is natural to focus our initial attention on the primary calculations or functions of a script, which can lead to the display format of dates and times being an afterthought. While it may not be crucial for the main use case of a script, increased customizability can help push indicators/strategies to the next level in the eyes of the user.
The purpose of this library is to provide an easy-to-use mechanism for allowing script users to choose the formats of dates and times that are displayed to them. Not only is this helpful for users from around the world who may be accustomed to different date/time formats, but it also makes it easier for the script author because it offloads the date/time formatting decision from the author to the user.
HOW TO USE
Step 1
Import the library. Replace with the latest available version number for this library.
//@version=6
indicator("Example")
import n00btraders/DateTime/ as dt
Step 2
Select a date format and/or time format enum to be used as an input.
dateFormatInput = input.enum(dt.DateFormat.FORMAT_3, "Date format")
timeFormatInput = input.enum(dt.TimeFormat.TWENTY_FOUR_HOURS, "Time hours format")
Step 3
Pass the user's selection as the `format` parameter in the formatting functions from this library. The `timestamp` & `timezone` parameters can be any value that would otherwise be used in 𝚜𝚝𝚛.𝚏𝚘𝚛𝚖𝚊𝚝_𝚝𝚒𝚖𝚎(𝚝𝚒𝚖𝚎, 𝚏𝚘𝚛𝚖𝚊𝚝, 𝚝𝚒𝚖𝚎𝚣𝚘𝚗𝚎).
string formattedDate = dt.formatDate(timestamp, dateFormatInput, timezone)
string formattedTime = dt.formatTime(timestamp, timeFormatInput, timezone)
LIMITATIONS
The library's ease-of-use comes at a few costs:
Fixed date/time formats.
Using the library's pre-defined date & time formats means that additional custom formats cannot be utilized. For example, this library does not include seconds or fractional seconds in formatted time strings. If a script's use case requires displaying the 'seconds' from a time of day, then 𝚜𝚝𝚛.𝚏𝚘𝚛𝚖𝚊𝚝_𝚝𝚒𝚖𝚎() must be used directly.
Fixed time zone offset format.
The `formatTime()` function of this library can optionally add the time zone offset at the end of the time string, but the format of the offset cannot be specified. Note: if the default format for time zone offset is not sufficient, the Timezone library can be imported directly to get the time zone offset string in a preferred format.
ADVANTAGES
There are benefits to utilizing this library instead of directly using 𝚜𝚝𝚛.𝚏𝚘𝚛𝚖𝚊𝚝_𝚝𝚒𝚖𝚎():
Easy to use from the user's perspective.
The date & time format enums provide a similar look and feel to the "Date format" and "Time hours format" options that already exist in the TradingView chart settings.
Easy to use from the author's perspective.
The exported functions from this library are modeled to behave similarly to the 𝚜𝚝𝚛.𝚏𝚘𝚛𝚖𝚊𝚝_𝚝𝚒𝚖𝚎(𝚝𝚒𝚖𝚎, 𝚏𝚘𝚛𝚖𝚊𝚝, 𝚝𝚒𝚖𝚎𝚣𝚘𝚗𝚎) built-in function from Pine Script.
Format quarter of the year.
The date formatting function from this library can display a fiscal quarter if it's included in the user-selected format. This is currently not possible with the built-in 𝚜𝚝𝚛.𝚏𝚘𝚛𝚖𝚊𝚝_𝚝𝚒𝚖𝚎().
EXPORTED ENUM TYPES
This section will list the available date/time formats that can be used as a script input. Each enum type has a detailed //@𝚏𝚞𝚗𝚌𝚝𝚒𝚘𝚗 description in the source code to help determine the best choice for your scripts.
Date Format Enums:
𝙳𝚊𝚝𝚎𝙵𝚘𝚛𝚖𝚊𝚝
𝙳𝚊𝚝𝚎𝙵𝚘𝚛𝚖𝚊𝚝𝙳𝚊𝚢𝙾𝚏𝚆𝚎𝚎𝚔𝙰𝚋𝚋𝚛
𝙳𝚊𝚝𝚎𝙵𝚘𝚛𝚖𝚊𝚝𝙳𝚊𝚢𝙾𝚏𝚆𝚎𝚎𝚔𝙵𝚞𝚕𝚕
𝙲𝚞𝚜𝚝𝚘𝚖𝙳𝚊𝚝𝚎𝙵𝚘𝚛𝚖𝚊𝚝
Supporting Date Enums:
𝙳𝚊𝚝𝚎𝙿𝚛𝚎𝚏𝚒𝚡
Time Format Enums:
𝚃𝚒𝚖𝚎𝙵𝚘𝚛𝚖𝚊𝚝
Supporting Time Enums:
𝚃𝚒𝚖𝚎𝙰𝚋𝚋𝚛𝚎𝚟𝚒𝚊𝚝𝚒𝚘𝚗
𝚃𝚒𝚖𝚎𝚂𝚎𝚙𝚊𝚛𝚊𝚝𝚘𝚛
𝚃𝚒𝚖𝚎𝙿𝚘𝚜𝚝𝚏𝚒𝚡
Note: all exported enums have custom titles for each field. This means that the supporting enums could also be exposed to the end-user as script inputs if necessary. The supporting enums are used as optional parameters in this library's formatting functions to allow further customizability.
EXPORTED FUNCTIONS
formatDate(timestamp, format, timezone, prefix, trim)
Converts a UNIX time into a date string formatted according to the selected `format`.
Parameters:
timestamp (series int) : A UNIX time.
format (series DateFormat) : A date format.
timezone (series string) : A UTC/GMT offset or IANA time zone identifier.
prefix (series DatePrefix) : Optional day of week prefix.
trim (series bool) : Optional truncation of numeric month / day.
Returns: Calendar date string using the selected format.
⸻⸻⸻⸻⸻⸻⸻⸻
Required parameters: `timestamp`, `format`.
Note: there is a version of this function for each Date Format enum type. The only difference is the type of the `format` parameter.
Tip: hover over the `formatDate()` function in the Pine Editor to display useful details:
Function description
Parameter descriptions + default values
Example function usage
formatTime(timestamp, format, timezone, trim, separator, postfix, space, offset)
Converts a UNIX time into a formatted time string using the 24-hour clock or 12-hour clock.
Parameters:
timestamp (series int) : A UNIX time.
format (series TimeFormat) : A time format.
timezone (series string) : A UTC/GMT offset or IANA time zone identifier.
trim (series TimeAbbreviation) : Optional truncation of the hour and minute portion.
separator (series TimeSeparator) : Optional time separator.
postfix (series TimePostfix) : Optional format for the AM/PM postfix.
space (series bool) : Optional space between the time and the postfix.
offset (series bool) : Optional UTC offset as a suffix.
Returns: Time of day string using the selected format.
⸻⸻⸻⸻⸻⸻⸻⸻
Required parameters: `timestamp`, `format`.
Note: the `trim`, `postfix`, and `space` optional parameters are not applicable and will be ignored when using the 24-hour clock (`format` = TimeFormat.TWENTY_FOUR_HOURS).
Tip: hover over the `formatTime()` function in the Pine Editor to display useful details:
Function description
Parameter descriptions + default values
Example function usage
Example outputs for combinations of TimeFormat.* enum values & optional parameters
NOTES
This library can be used in conjunction with the Timezone library to increase the usability of scripts that can benefit from allowing the user to input their preferred time zone.
Credits to HoanGhetti for publishing an informative Markdown resource which I referenced to create the formatted function descriptions that pop up when hovering over `formatDate()` and `formatTime()` function calls in the Pine Editor.
csv_series_libraryThe CSV Series Library is an innovative tool designed for Pine Script developers to efficiently parse and handle CSV data for series generation. This library seamlessly integrates with TradingView, enabling the storage and manipulation of large CSV datasets across multiple Pine Script libraries. It's optimized for performance and scalability, ensuring smooth operation even with extensive data.
Features:
Multi-library Support: Allows for distribution of large CSV datasets across several libraries, ensuring efficient data management and retrieval.
Dynamic CSV Parsing: Provides robust Python scripts for reading, formatting, and partitioning CSV data, tailored specifically for Pine Script requirements.
Extensive Data Handling: Supports parsing CSV strings into Pine Script-readable series, facilitating complex financial data analysis.
Automated Function Generation: Automatically wraps CSV blocks into distinct Pine Script functions, streamlining the process of integrating CSV data into Pine Script logic.
Usage:
Ideal for traders and developers who require extensive data analysis capabilities within Pine Script, especially when dealing with large datasets that need to be partitioned into manageable blocks. The library includes a set of predefined functions for parsing CSV data into usable series, making it indispensable for advanced trading strategy development.
Example Implementation:
CSV data is transformed into Pine Script series using generated functions.
Multiple CSV blocks can be managed and parsed, allowing for flexible data series creation.
The library includes comprehensive examples demonstrating the conversion of standard CSV files into functional Pine Script code.
To effectively utilize the CSV Series Library in Pine Script, it is imperative to initially generate the correct data format using the accompanying Python program. Here is a detailed explanation of the necessary steps:
1. Preparing the CSV Data:
The Python script provided with the CSV Series Library is designed to handle CSV files that strictly contain no-space, comma-separated single values. It is crucial that your CSV file adheres to this format to ensure compatibility and correctness of the data processing.
2. Using the Python Program to Generate Data:
Once your CSV file is prepared, you need to use the Python program to convert this file into a format that Pine Script can interpret. The Python script performs several key functions:
Reads the CSV file, ensuring that it matches the required format of no-space, comma-separated values.
Formats the data into blocks, where each block is a string of data that does not exceed a specified character limit (default is 4,000 characters). This helps manage large datasets by breaking them down into manageable chunks.
Wraps these blocks into Pine Script functions, each block being encapsulated in its own function to maintain organization and ease of access.
3. Generating and Managing Multiple Libraries:
If the data from your CSV file exceeds the Pine Script or platform limits (e.g., too many characters for a single script), the Python script can split this data into multiple blocks across several files.
4. Creating a Pine Script Library:
After generating the formatted data blocks, you must create a Pine Script library where these blocks are integrated. Each block of data is contained within its function, like my_csv_0(), my_csv_1(), etc. The full_csv() function in Pine Script then dynamically loads and concatenates these blocks to reconstruct the full data series.
5. Exporting the full_csv() Function:
Once your Pine Script library is set up with all the CSV data blocks and the full_csv() function, you export this function from the library. This exported function can then be used in your actual trading projects. It allows Pine Script to access and utilize the entire dataset as if it were a single, continuous series, despite potentially being segmented across multiple library files.
6. Reconstructing the Full Series Using vec :
When your dataset is particularly large, necessitating division into multiple parts, the vec type is instrumental in managing this complexity. Here’s how you can effectively reconstruct and utilize your segmented data:
Definition of vec Type: The vec type in Pine Script is specifically designed to hold a dataset as an array of floats, allowing you to manage chunks of CSV data efficiently.
Creating an Array of vec Instances: Once you have your data split into multiple blocks and each block is wrapped into its own function within Pine Script libraries, you will need to construct an array of vec instances. Each instance corresponds to a segment of your complete dataset.
Using array.from(): To create this array, you utilize the array.from() function in Pine Script. This function takes multiple arguments, each being a vec instance that encapsulates a data block. Here’s a generic example:
vec series_vector = array.from(vec.new(data_block_1), vec.new(data_block_2), ..., vec.new(data_block_n))
In this example, data_block_1, data_block_2, ..., data_block_n represent the different segments of your dataset, each returned from their respective functions like my_csv_0(), my_csv_1(), etc.
Accessing and Utilizing the Data: Once you have your vec array set up, you can access and manipulate the full series through Pine Script functions designed to handle such structures. You can traverse through each vec instance, processing or analyzing the data as required by your trading strategy.
This approach allows Pine Script users to handle very large datasets that exceed single-script limits by segmenting them and then methodically reconstructing the dataset for comprehensive analysis. The vec structure ensures that even with segmentation, the data can be accessed and utilized as if it were contiguous, thus enabling powerful and flexible data manipulation within Pine Script.
Library "csv_series_library"
A library for parsing and handling CSV data to generate series in Pine Script. Generally you will store the csv strings generated from the python code in libraries. It is set up so you can have multiple libraries to store large chunks of data. Just export the full_csv() function for use with this library.
method csv_parse(data)
Namespace types: array
Parameters:
data (array)
method make_series(series_container, start_index)
Namespace types: array
Parameters:
series_container (array)
start_index (int)
Returns: A tuple containing the current value of the series and a boolean indicating if the data is valid.
method make_series(series_vector, start_index)
Namespace types: array
Parameters:
series_vector (array)
start_index (int)
Returns: A tuple containing the current value of the series and a boolean indicating if the data is valid.
vec
A type that holds a dataset as an array of float arrays.
Fields:
data_set (array) : A chunk of csv data. (A float array)
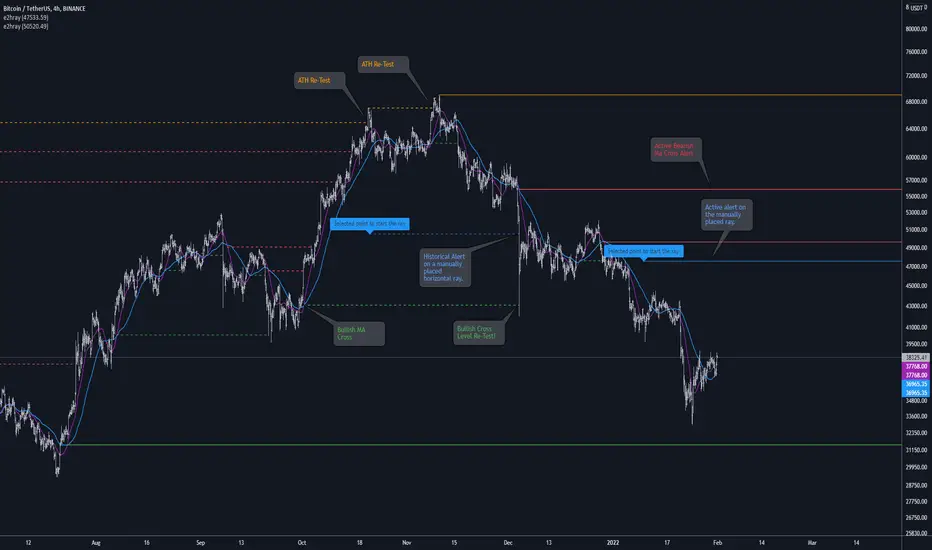
[e2] Drawing Library :: Horizontal Ray█ OVERVIEW
Library "e2hray"
A drawing library that contains the hray() function, which draws a horizontal ray/s with an initial point determined by a specified condition. It plots a ray until it reached the price. The function let you control the visibility of historical levels and setup the alerts.
█ HORIZONTAL RAY FUNCTION
hray(condition, level, color, extend, hist_lines, alert_message, alert_delay, style, hist_style, width, hist_width)
Parameters:
condition : Boolean condition that defines the initial point of a ray
level : Ray price level.
color : Ray color.
extend : (optional) Default value true, current ray levels extend to the right, if false - up to the current bar.
hist_lines : (optional) Default value true, shows historical ray levels that were revisited, default is dashed lines. To avoid alert problems set to 'false' before creating alerts.
alert_message : (optional) Default value string(na), if declared, enables alerts that fire when price revisits a line, using the text specified
alert_delay : (optional) Default value int(0), number of bars to validate the level. Alerts won't trigger if the ray is broken during the 'delay'.
style : (optional) Default value 'line.style_solid'. Ray line style.
hist_style : (optional) Default value 'line.style_dashed'. Historical ray line style.
width : (optional) Default value int(1), ray width in pixels.
hist_width : (optional) Default value int(1), historical ray width in pixels.
Returns: void
█ EXAMPLES
• Example 1. Single horizontal ray from the dynamic input.
//@version=5
indicator("hray() example :: Dynamic input ray", overlay = true)
import e2e4mfck/e2hray/1 as e2draw
inputTime = input.time(timestamp("20 Jul 2021 00:00 +0300"), "Date", confirm = true)
inputPrice = input.price(54, 'Price Level', confirm = true)
e2draw.hray(time == inputTime, inputPrice, color.blue, alert_message = 'Ray level re-test!')
var label mark = label.new(inputTime, inputPrice, 'Selected point to start the ray', xloc.bar_time)
• Example 2. Multiple horizontal rays on the moving averages cross.
//@version=5
indicator("hray() example :: MA Cross", overlay = true)
import e2e4mfck/e2hray/1 as e2draw
float sma1 = ta.sma(close, 20)
float sma2 = ta.sma(close, 50)
bullishCross = ta.crossover( sma1, sma2)
bearishCross = ta.crossunder(sma1, sma2)
plot(sma1, 'sma1', color.purple)
plot(sma2, 'sma2', color.blue)
// 1a. We can use 2 function calls to distinguish long and short sides.
e2draw.hray(bullishCross, sma1, color.green, alert_message = 'Bullish Cross Level Broken!', alert_delay = 10)
e2draw.hray(bearishCross, sma2, color.red, alert_message = 'Bearish Cross Level Broken!', alert_delay = 10)
// 1b. Or a single call for both.
// e2draw.hray(bullishCross or bearishCross, sma1, bullishCross ? color.green : color.red)
• Example 3. Horizontal ray at the all time highs with an alert.
//@version=5
indicator("hray() example :: ATH", overlay = true)
import e2e4mfck/e2hray/1 as e2draw
var float ath = 0, ath := math.max(high, ath)
bool newAth = ta.change(ath)
e2draw.hray(nz(newAth ), high , color.orange, alert_message = 'All Time Highs Tested!', alert_delay = 10)