Trade Size Calculator By Skapez Trade Size Calculator By Skapez — ARM it, Drag & Trade!
A simple, position-sizing calculator for easy trader sizing.
It plots Entry / Stop / TP lines, sizes your trade to a fixed % risk (e.g., 2%), calculates leverage, and shows clean labels (Risk $, TP $, Position $, Leverage ×). You can ARM a setup, drag the lines to fine-tune, and (optionally) trigger alerts for webhooks.
What it does:
Fixed-fractional risk : sizes position so SL equals your chosen % of account (e.g., 2%).
Leverage cap & lot rounding : respects your max leverage and exchange lot step.
Drag-to-edit : move Entry/Stop; TP and sizing update automatically.
Swing-stop helper (optional): snap SL to recent swing low/high or nearest pivot. (Auto stop loss finder)
Valid-until window: auto-expires stale setups (e.g., after 120 minutes).
Alerts-ready: add your own JSON in the alert to send to a bot/webhook.
Quick start (60 seconds)
Add to chart and open Settings.
In Risk, set:
Account Balance (USD) and Risk % (e.g., 2.0).
Side (Long/Short).
In Levels:
Put an Entry price (or leave 0 to use current price when you ARM).
Choose Stop: type it manually or toggle Swing stop helper.
Pick your Target R multiple (e.g., 3.0 for 3:1).
In Leverage, set:
Leverage Cap (e.g., 10×) and Min/Step Size (e.g., 0.001 BTC).
Toggle ARM on. Three lines appear. Drag the blue/red lines if needed; the green TP and all numbers update.
Tip: Pin the indicator to the Right Price Scale (format icon → “Pin to scale”) so everything lines up perfectly.
On-chart visuals
Blue = Entry (label shows Position $ and Leverage × to the far right).
Red = Stop (label shows Risk $).
Green = TP (label shows TP P&L $).
Works on any symbol/timeframe; prices are rounded to the symbol’s tick size.
That’s it—arm, drag, and go.
Pine實用程式

SMC Suite - OB . Breaker . Liquidity Sweep . FVGSMC Suite — Order Blocks • Breaker • Liquidity Sweep • FVG
What it does:
Maps institutional SMC structure (OB → Breaker flips, Liquidity Sweeps, and 3-bar FVGs) and alerts when price retests those zones with optional r ejection-wick confirmation .
Why this isn’t “just a mashup”?
This tool implements a specific interaction between four classic SMC concepts instead of only plotting them side-by-side:
1. OB → Breaker Flip (automated): When price invalidates an Order Block (OB), the script converts that zone into a Breaker of opposite bias (bullish ⇄ bearish), extends it, and uses it for retest signals.
2. Liquidity-Gated FVGs : Fair Value Gaps (3-bar imbalances) are optionally gated—they’re only drawn/used if a recent liquidity sweep occurred within a user-defined lookback.
3. Retest Engine with Rejection Filter : Entries are not whenever a zone prints. Signals fire only if price retests the zone, and (optionally) the candle shows a rejection wick ≥ X% of its range.
4. Signal Cooldown : Prevents spam by enforcing a minimum bar gap between consecutive signals.
These behaviors work together to catch the sequence many traders look for: sweep → impulse → OB/FVG → retest + rejection.
Concepts & exact rules
1) Impulsive move and swing structure
• A bar is “ impulsive ” when its range ≥ ATR × Impulsive Mult and it closes in the direction of the move.
• Swings use Pivot Length (lenSwing) on both sides (HH/LL detection). These HH/LLs are also used for sweep checks.
2) Order Blocks (OB)
• Bullish OB : last bearish candle body before an i mpulsive up-move that breaks the prior swing high . Zone = min(open, close) to low of that candle.
• Bearish OB : last bullish candle body before an impulsive down-move that breaks the prior swing low . Zone = high to max(open, close).
• Zones extend right for OB Forward Extend bars.
3) Breaker Blocks (automatic flip)
If price invalidates an OB (closes below a bullish OB’s low or above a bearish OB’s high), that OB flips into a Breaker of opposite bias:
• Invalidated bullish OB → Bearish Breaker (resistance).
• Invalidated bearish OB → Bullish Breaker (support).
Breakers get their own style/opacity and are used for separate Breaker Retest signals.
4) Liquidity Sweeps (decluttered)
• Bullish sweep : price takes prior high but closes back below it.
• Bearish sweep : price takes prior low but closes back above it.
Display can be tiny arrows (default), short non-extending lines, or hidden. Old marks auto-expire to keep the chart clean.
5) Fair Value Gaps (FVG, 3-bar)
• Bearish FVG : high < low and current high < low .
• Bullish FVG : low > high and current low > high .
• Optional gating: only create/use FVGs if a sweep occurred within ‘Recent sweep’ lookback.
6) Retest signals (what actually alerts)
A signal is true when price re-enters a zone and (optionally) the candle shows a rejection wick:
• OB Retest LONG/SHORT — same-direction retest of OB.
• Breaker LONG/SHORT — opposite-direction retest of flipped breaker.
• FVG LONG/SHORT — touch/fill of FVG with rejection.
You can require a wick ratio (e.g., bottom wick ≥ 60% of range for longs; top wick for shorts). A cooldown prevents back-to-back alerts.
How to use
1. Pick timeframe/market : Works on any symbol/TF. Many use 15m–4h intraday and 1D swing.
2. *Tune Pivot Length & Impulsive Mult:
• Smaller = more zones and quicker flips; larger = fewer but stronger.
3. Decide whether to gate FVGs with sweeps : Turn on “Require prior Liquidity Sweep” to focus on post-liquidity setups.
4. Set wick filter : Start with 0.6 (60%) for cleaner signals; lower it if too strict.
5. Style : Use the Style / Zones & Style / Breakers groups to set colors & opacity for OB, Breakers, FVGs.
6. Alerts : Add alerts on any of:
• OB Retest LONG/SHORT
• Breaker LONG/SHORT
• FVG LONG/SHORT
Choose “Once per bar close” to avoid intrabar noise.
Inputs (key)
• Swing Pivot Length — swing sensitivity for HH/LL and sweeps.
• Impulsive Move (ATR ×) — defines the impulse that validates OBs.
• OB/FVG Forward Extend — how long zones project.
• Require prior Liquidity Sweep — gate FVG creation/usage.
• Rejection Wick ≥ % — confirmation filter for retests.
• Signal Cooldown (bars) — throttles repeated alerts.
• Display options for sweep marks — arrows vs short lines vs hidden.
• Full color/opacity controls — independent palettes for OB, Breakers, and FVGs (fills & borders).
What’s original here
• Automatic OB → Breaker conversion with separate retest logic.
• Liquidity-conditioned FVGs (FVGs can be required to follow a recent sweep).
• Unified retest engine with wick-ratio confirmation + cooldown.
• Decluttered liquidity visualization (caps, expiry, and non-extending lines).
• Complete styling controls for zone types (fills & borders), plus matching signal label colors.
🔹 Notes
• This script is invite-only.
• It is designed for educational and discretionary trading use, not as an autotrader.
• No performance guarantees are implied — always test on multiple markets and timeframes.

Swing Z | Zillennial Technologies Inc.Swing Z by Zillennial Technologies Inc. is an advanced algorithmic framework built specifically for cryptocurrency markets. It integrates multiple layers of technical analysis into a single decision-support tool, generating buy and sell signals only when several independent confirmations align.
Core Concept
Swing Z fuses trend structure, momentum oscillators, volatility signals, and price action tools to capture high-probability trading opportunities in volatile crypto environments.
Trend Structure (EMA 9, 21, 50, 200)
Short-term EMAs (9 & 21) detect immediate momentum shifts.
Longer-term EMAs (50 & 200) define the broader trend and dynamic support/resistance.
Momentum & Confirmation Layer
RSI measures relative strength and market conditions.
MACD crossovers confirm momentum shifts and trend continuations.
Volatility & Market Pressure
TTM Squeeze highlights compression zones likely to precede breakouts.
Volume analysis confirms conviction behind directional moves.
VWAP (Volume Weighted Average Price) establishes intraday value zones and institutional benchmarks.
Price Action Filters
Fibonacci retracements are integrated to identify key reversal and continuation levels.
Signals are produced only when multiple conditions agree, reducing noise and improving reliability in fast-moving crypto markets.
Features
Tailored for cryptocurrency trading across major pairs (BTC, ETH, and altcoins).
Works effectively on swing and trend-based timeframes (1H–1D).
Combines trend, momentum, volatility, and price action into a single framework.
Generates clear Buy/Sell markers and integrates with TradingView alerts.
How to Use
Apply to a clean chart for the clearest visualization.
Use Swing Z as a swing trading tool, aligning entries with both trend structure and momentum confirmation.
Combine with your own stop-loss, take-profit, and position sizing rules.
Avoid application on non-standard chart types such as Renko, Heikin Ashi, or Point & Figure, which may distort results.
Disclaimer
Swing Z is designed as a decision-support tool, not financial advice.
All backtesting should use realistic risk, commission, and slippage assumptions.
Past results do not guarantee future performance.
Signals do not repaint but may adjust as new data develops in real-time.
Why Swing Z is original & useful:
Swing Z unifies EMA trend structure, RSI, MACD, TTM Squeeze, VWAP, Fibonacci retracements, and volume analysis into a single algorithmic framework. This multi-confirmation approach improves accuracy by requiring consensus across trend, momentum, volatility, and price action — a design made specifically for the challenges and volatility of cryptocurrency markets.

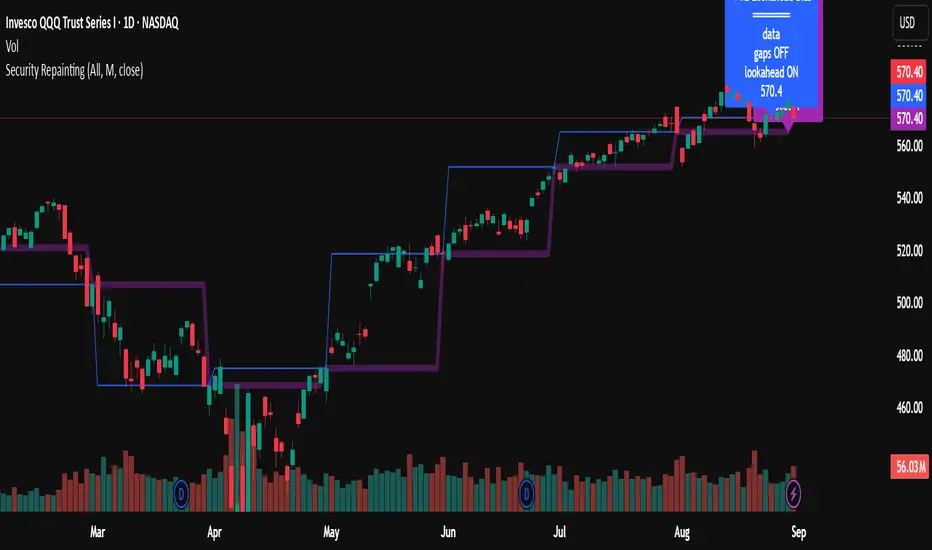
How to avoid repainting when using security() - viewing optionsHow to avoid repainting when using the security() - Edited PineCoders FAQ with more viewing options
This may be of value to a limited few, but I've introduced a set of Boolean inputs to PineCoders' original script because viewing all the various security lines at once was giving me a brain cramp. I wanted to study each behavior one-by-one. This version (also updated to PineScript v6) will allow users to selectively display each, or any combination, of the security plots. Each plot was updated to include a condition tied to its corresponding input, ensuring it only appears when explicitly enabled. The label-rendering logic only displays when its related plot is active; however, I've also added an input that allows you to remove all labels, enabling you to see the price action more clearly (the labels can sometimes obscure what you want to see). Run this script in replay mode to view the nuanced differences between the 12 methods while selecting/deselecting the desired plots (selecting all at once can be overcrowded and confusing).
All thanks and credit to PineCoders--these changes I made only provide more control over what’s shown on the chart without altering the core structure or intent of the original script. It helped me, so I thought I should share it. If I inadvertently messed something up, please let me know, and I will try to fix it.
I set the defaults for viewing monthly security functions on the daily timeframe. Only the first 2 security functions plot with the default settings, so change the settings as needed. Be sure to read the original notes and detailed explanations in the PineCoders posting "How to avoid repainting when using security() - PineCoders FAQ."
Bottom line, you should use one of the two functions: f_secureSecurity or f_security, depending on what you are trying to do. Hopefully, this script will make it a little easier for the visual learner to understand why (use replay mode or watch live price action on a lower timeframe).
Position Size Calculator MKThis indicator uses for automating your trading very good for taking position with tension free
also have touch entry of price or closing basis entry and stop loss and also show live position

Pivot + Stochastic Filter Signals (Balanced)Pivot + Stochastic Filter Signals (Balanced)
This indicator combines Pivot Highs/Lows with the Stochastic Oscillator to generate accurate BUY and SELL signals.
A BUY signal appears when a Pivot Low forms and the Stochastic %K crosses above %D (optionally filtered by oversold conditions).
A SELL signal appears when a Pivot High forms and the Stochastic %K crosses below %D (optionally filtered by overbought conditions).
Key Features:
Clear BUY (green) and SELL (red) signals plotted directly on the chart.
Optional filter: only trigger signals in overbought/oversold zones.
Labels display pivot value with the corresponding signal.
Stochastic oscillator plotted for confirmation.
This tool is useful for traders who want to combine price action (pivots) with momentum confirmation (Stochastic crossovers) for higher accuracy in trend reversals and entry timing.

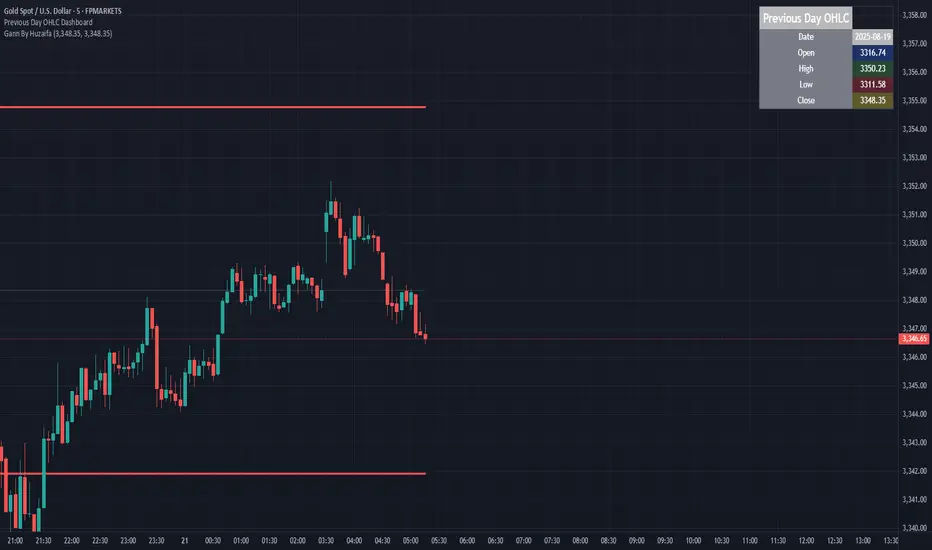
Previous Day OHLC Dashboard (Last N Days)Indicator: Previous Day OHLC Dashboard (Multi-Day)
This indicator displays a dashboard-style table on your chart that shows the Open, High, Low, and Close (OHLC) of the previous trading days. It’s designed to help traders quickly reference key daily levels that often act as important support and resistance zones.
🔑 Features:
Dashboard Table: Shows OHLC data for the last N trading days (default = 3, up to 10).
Customizable Appearance:
Change the position of the dashboard (Top-Right, Top-Left, Bottom-Right, Bottom-Left).
Adjust text size (Tiny → Huge).
Customize colors for header, labels, and each OHLC column.
Yesterday’s OHLC Lines (optional): Plots horizontal lines on the chart for the previous day’s Open, High, Low, and Close.
Intraday & Multi-Timeframe Compatible: Works on all timeframes below Daily — values update automatically from the daily chart.
📊 Use Cases:
Quickly identify yesterday’s key levels for intraday trading.
Track how current price reacts to previous day’s support/resistance.
Keep a multi-day reference for trend bias and range context.
⚙️ How it Works:
The indicator pulls daily OHLC values using request.security() with lookahead_on to ensure prior day’s values are extended across the next session.
These values are displayed in a compact table for quick reference.
Optionally, the most recent daily levels (D-1) are plotted as chart lines.
✅ Perfect for day traders, scalpers, and swing traders who rely on yesterday’s price action to plan today’s trades.
WAE SHK Teyla 3MDesigned to detect high-pressure market moments, where momentum and volume converge to trigger explosive moves. Ideal as an entry trigger in scalping strategies, especially when paired with STC and ST-MA.
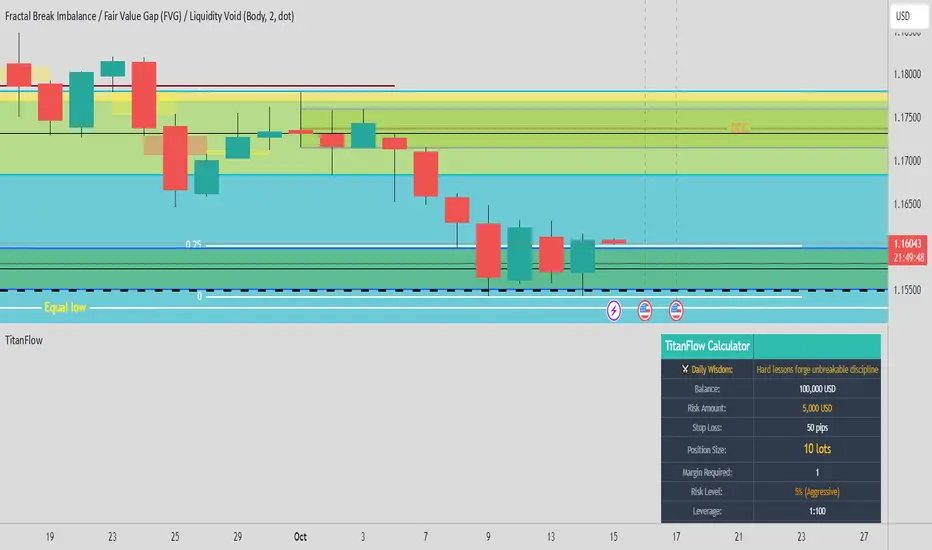
TitanFlow Position CalculatorTitanFlow Position Calculator - Professional Risk Management Tool
Transform your trading with precision position sizing and advanced risk management
The TitanFlow Position Calculator is a comprehensive Pine Script indicator designed for serious traders who demand professional-grade risk management tools. Whether you're trading forex, commodities, indices, or crypto, this calculator ensures you never risk more than intended while maximizing your profit potential.
🎯 Key Features:
SMART POSITION SIZING
Automatic lot size calculation based on your risk parameters
Support for percentage risk, fixed amount, or losing streak buffer modes
Real-time position size updates as market conditions change
Double-up mode for aggressive trading strategies
MULTI-ASSET SUPPORT
Pre-configured settings for Forex Major/Minor pairs
Commodities: Gold, Silver, Oil with accurate pip values
Stock indices with proper contract specifications
Cryptocurrency trading support
Custom instrument configuration for any asset
ADVANCED RISK MANAGEMENT
Visual risk level categorization (Conservative, Moderate, Aggressive, Extreme)
Color-coded risk warnings with threshold alerts
Margin requirement calculations with leverage integration
Take profit level planning with lot distribution
PROFESSIONAL THEMES
TitanFlow Dark theme matching the professional trading platform
TitanFlow Light theme for bright chart environments
Classic dark/light themes for traditional traders
Full custom colour control for personalized setups
COMPREHENSIVE LEVERAGE SUPPORT
Complete leverage options from 1:1 to 1:500 including:
1:1, 1:10, 1:15, 1:20, 1:30, 1:50, 1:100, 1:200, 1:300, 1:400, 1:500
📊 What You'll See:
REAL-TIME CALCULATIONS
Position size in lots displayed prominently
Risk level percentage with color coding
Margin requirements in your account currency
Stop loss distance in pips
Take profit distribution across multiple levels
CLEAN INFORMATION TABLE
Account balance and currency display
Current risk amount being wagered
Calculated position size and margin needs
Risk categorization with visual indicators
Leverage ratio confirmation
SMART ALERTS
Extreme risk warnings (>5% per trade)
Large position alerts (>10 lots)
High margin usage notifications (>50% account)
Real-time risk assessment updates
🚀 Take Your Trading Further with TitanFlow
Want more than just position sizing?
Visit titanflow.co.uk to discover the complete TitanFlow trading ecosystem:
✅ Advanced Trading Dashboard - Comprehensive portfolio tracking and analytics
✅ Trade Journal Integration - Log and analyze every trade automatically
✅ AI-Powered Coaching - Get personalized trading insights and recommendations
✅ Monthly Performance Reports - Detailed analytics delivered to your inbox
✅ Risk Management Suite - Professional tools for serious traders
✅ Trading Calendar - Never miss important market events
✅ Community Access - Connect with successful traders worldwide
Special Offer: TradingView users get exclusive access to premium features. Transform your trading from guesswork to systematic success. coming soon
🎨 Customization Options:
Theme Selection
Choose from 5 professional themes
Customize every colour element
Match your chart aesthetic perfectly
Professional branding options
Display Controls
Position table in any corner
Show/hide alerts and warnings
Adjustable text sizes
Clean, distraction-free interface
💡 Perfect For:
Day Traders who need quick position sizing decisions
Swing Traders planning multi-level exits
Scalpers requiring precise risk control
Portfolio Managers overseeing multiple accounts
Risk Managers monitoring exposure levels
Trading Educators teaching proper risk management
🚀 How to Use:
Set Your Account - Enter balance and currency
Choose Risk Mode - Percentage (recommended 1-2%), fixed amount, or losing streak buffer
Configure Instrument - Select asset type or use custom settings
Set Stop Loss - Enter your stop distance in pips
Read Results - Get instant position size and risk analysis
⚠️ Risk Management Excellence:
This calculator embodies the core principle that successful trading is about risk management, not just profit hunting. By using proper position sizing, you'll:
Survive losing streaks with capital intact
Compound profits systematically
Sleep better knowing your risk is controlled
Build consistent trading habits
Protect your trading capital long-term
Ready to elevate your entire trading operation? Start with this position calculator, then visit titanflow.co.uk to unlock the full potential of systematic, professional trading.
This indicator is part of the TitanFlow trading ecosystem. titanflow.co.uk coming soon here you'll be able to obtain the complete professional trading platform.
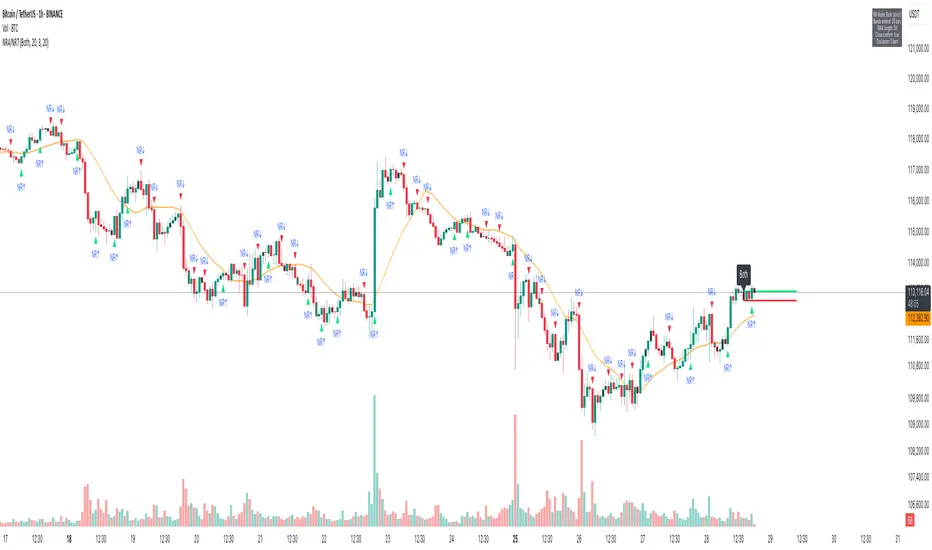
NR4/NR7 Volatility Squeeze & BreakoutsNR4/NR7 Volatility Squeeze & Breakouts
Concept
Markets often move in cycles of contraction → expansion.
The NR4 and NR7 patterns are well-known volatility contraction signals:
• NR4 : The current bar has the narrowest range (high–low) of the last 4 bars.
• NR7 : The current bar has the narrowest range of the last 7 bars.
• When both conditions align, it signals a strong volatility squeeze.
Such bars often precede s harp breakout moves , making them valuable for breakout and risk-framed trading setups.
How It Works
This script detects NR4 and NR7 bars in real time and adds several features for practical trading use:
Bar Highlighting:
• Teal = NR4, Purple = NR7, Orange = Both.
Breakout Levels:
• The High and Low of the most recent NR bar are projected forward as breakout bands.
Breakout Signals:
• Optional markers when price crosses above/below the NR High/Low.
• Configurable “close confirmation” and cooldown period to avoid duplicate signals.
SMA Filter (adjustable, default 20):
• Plotted on the chart to help traders frame bias and trend context.
Alerts:
• “NR Bar Formed”
• “Bullish Breakout”
• “Bearish Breakout”
How to Use
1. Identify Contraction:
• Watch for NR4/NR7 colored bars.
2. Plan Expansion:
• Use the High/Low of the bar as breakout reference.
3. Add Filters:
• SMA slope/position can add directional context.
• Combine with volume, VWAP, or support/resistance for stronger signals.
4. Risk Management:
• Many traders use the opposite side of the NR bar as stop placement.
Why It’s Useful
Unlike generic breakout systems, this script:
• Focuses on specific, researched volatility patterns (NR4/NR7), not just random breakouts.
• Provides a visual and systematic framework for detecting contraction → expansion phases.
• Integrates both classic price-action logic (narrow ranges) and a trend filter (SMA).
• Offers flexible alerts and cooldown so traders can adapt it to different styles (scalping, swing, intraday).
Important
This is an educational tool. It does not guarantee profitable trades. Always combine with your own market analysis and risk management.
10 AM Reversal/Continuation Zone BY DAN GESPlots the high and low between 9.30 - 10:00am ET
Colours the zone between those two levels.
Highlights when price breaks above or below that zone after 10:00am
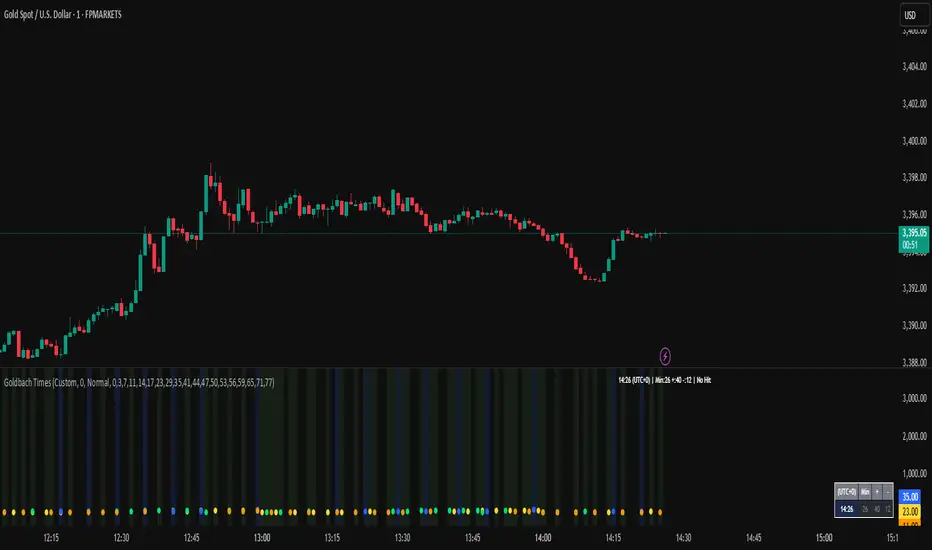
Goldbach Time Indicator🔧 Key Fixes Applied:
1. Time Validation & Bounds Checking:
Hour/Minute Bounds: Ensures hours stay 0-23, minutes stay 0-59
Edge Case Handling: Prevents invalid time calculations from causing missing data
UTC Conversion Safety: Better handling of timezone edge cases
2. Enhanced Value Validation:
NA Checking: Validates all calculated values before using them
Goldbach Detection: Only flags valid, non-NA values as Goldbach hits
Plot Safety: Prevents plotting invalid or NA values that could cause gaps
3. Improved Plot Logic:
Core Level Colors: Blue for core levels (29,35,71,77), yellow/lime/orange for regular hits
Debug Mode Enhanced: Shows all calculations with gray dots when enabled
Better Filtering: Only plots positive, valid values for minus calculations
4. Background vs Dots Issue:
The large green/blue background you see suggests the indicator is detecting Goldbach times correctly, but the dots weren't plotting due to validation issues. This should now be fixed.
Index Position Size Calculator for [US30 / US100 / SP500]What it does
This tool helps you size positions consistently for index trades on US30 (Dow Jones), NAS100 (Nasdaq-100), and SP500 (S&P 500). Enter your account balance, risk %, and your planned Entry / Stop-Loss / Target and the script calculates:
• Position Size (rounded to your lot/contract step)
• Risk-to-Reward (R/R)
• Potential P/L in USD based on your inputs
• Visual Entry / SL / TP lines with green/red zones and concise labels
Supported contract styles
Choose a preset for common products (e.g., CFD $1/pt, YM/NQ/ES futures, MYM/MNQ/MES micros) or override the economics yourself. You remain in control of the two key levers:
• $/point — how many dollars you gain/lose per 1 index point per contract/lot
• Point size — how many price units equal 1 index point on your chart (often 1.0, but some brokers use 0.1 or 0.5)
Inputs
• Account Balance ($) and Risk % per trade
• Index: US30 / NAS100 / SP500
• Contract: CFD / Futures (YM, NQ, ES) / Micros (MYM, MNQ, MES)
• $/point: auto from Contract or manual override
• Point size: auto from Index or manual override
• Position size step: rounding (e.g., 1 for futures, 0.01 for CFDs)
• Entry / SL / TP: typed values (snapped to tick), with on-chart zones and labels
• Display toggles for lines and labels
How the math works
• StopPoints = |Entry − SL| ÷ PointSize
• ProfitPoints = |TP − Entry| ÷ PointSize
• Position Size = (AccountBalance × Risk%) ÷ (StopPoints × $/point)
• R/R = ProfitPoints ÷ StopPoints
• Potential P/L = PositionSize × Points × $/point
How to use (quick start)
1. Select Index and Contract.
2. Confirm $/point and Point size match your broker’s specs.
3. Enter Entry / SL / TP for the trade idea.
4. Read the Position Size, R/R, and Potential P/L in the info box.
5. Adjust for fees, spreads, and slippage as needed.
Notes & limitations
• Broker symbols can vary. Always verify $/point and Point size for your instrument before risking capital.
• The script does not place orders and does not generate trade signals; it’s a sizing/visualization tool.
• Results can differ across brokers due to pricing, spreads, minimum lot sizes, and execution rules.
• Use on the intended indices; you’ll see a reminder if you load it elsewhere.
Changelog highlights
• Pine v6, constant-safe inputs, tick-snapping, global fills (no local-scope errors).
• Robust label handling and optional minimal chart markers.
Disclaimer
This script is provided for educational purposes only and does not constitute financial advice or a recommendation to buy or sell any security or derivative. Trading involves risk, including the possible loss of principal. Always do your own research, verify contract specifications with your broker, and consider testing in a demo environment before trading live.

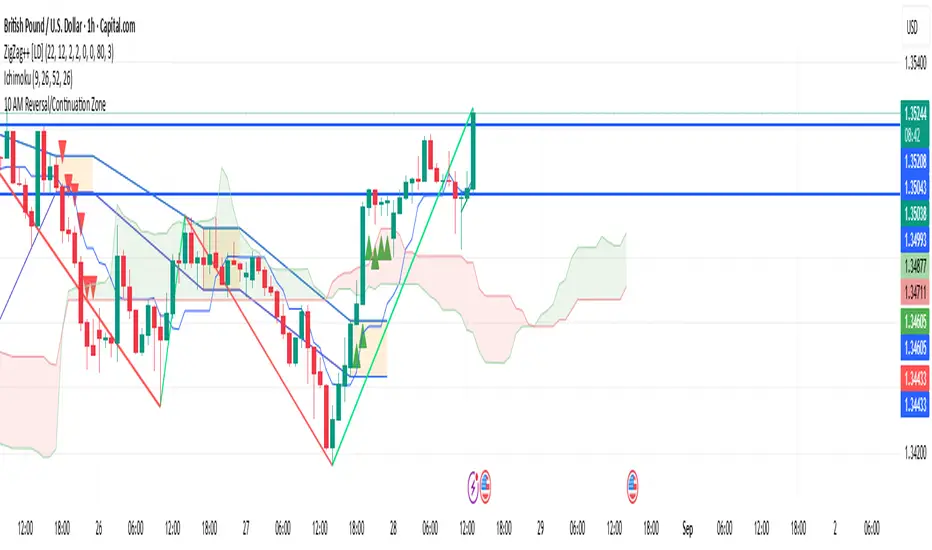
Apex Edge - London Open Session# Apex Edge - London Open Session Trading System
## Overview
The London Open Session indicator captures institutional price action during the first hour of the London forex session (8:00-9:00 AM GMT) and identifies high-probability breakout and retest opportunities. This system tracks the session's high/low range and generates precise entry signals when price breaks or retests these key institutional levels.
## Core Strategy
**Session Tracking**: Automatically identifies and marks the London Open session boundaries, creating a trading zone from the first hour's price range.
**Dual Entry Logic**:
- **Breakout Entries**: Triggers when price closes beyond the session high/low and continues in that direction
- **Retest Entries**: Activates when price returns to test the broken level as new support/resistance
**Performance Analytics**: Built-in win rate tracking displays real-time performance statistics over user-defined lookback periods, enabling data-driven optimization for each currency pair.
## Key Features
### Automated Zone Detection
- Precise London session timing with timezone offset controls
- Visual session boundaries with customizable colours
- Automatic high/low range calculation and display
### Smart Entry System
- Breakout confirmation requiring candle close beyond zone
- Retest detection with configurable pip distance tolerance
- Separate risk/reward ratios for breakout vs retest entries
- Visual entry arrows with clear trade direction labels
### Performance HUD
- Real-time win rate calculation over customizable periods (7-365 days)
- Total trades tracking with win/loss breakdown
- Average risk-reward ratio display
- Color-coded performance metrics (green >70%, yellow >50%, red <50%)
### PineConnector Integration
- Direct MT4/MT5 execution via PineConnector alerts
- Proper forex pip calculations for all currency pairs
- Customizable risk percentage per trade
- Symbol override capability for broker compatibility
- Automatic SL/TP level calculation in pips
## Critical Usage Requirements
### Pair-Specific Optimization
Each currency pair requires individual optimization due to varying volatility characteristics, institutional participation levels, and typical price ranges during London hours. The performance HUD is essential for identifying optimal settings before live trading.
**Recommended Testing Process**:
1. Apply indicator to desired currency pair and timeframe
2. Experiment with session timing - while 8:00-9:00 AM GMT is standard, some pairs may show improved performance with alternative hourly windows (e.g., 7:00-8:00 AM or 9:00-10:00 AM)
3. Adjust Stop Loss distances, Risk/Reward ratios, and Retest distances
4. Monitor win rate over 30+ day periods using the performance HUD
5. Only proceed with live alerts once consistent 60%+ win rates are achieved
6. Create separate optimized chart setups for each profitable pair/timeframe combination
### Timeframe Specifications
This indicator is specifically designed and tested for:
- **1-minute charts**: Optimal for capturing immediate institutional reactions
- **5-minute charts**: Balanced approach between noise reduction and opportunity frequency
Higher timeframes generally produce inferior results due to increased noise and reduced institutional edge during the London session window.
## Settings Configuration
### Session Timing
- **London Open/Close Hours**: Adjust for your chart's timezone
- **Rectangle End Time**: Set to 4:30 PM to stop signals before NY session close
- **Timezone Offset**: Ensure accurate London session capture
### Entry Parameters
- **Retest Distance**: 3-8 pips depending on pair volatility
- **Stop Loss Pips**: Separate settings for breakouts (10-15 pips) and retests (8-12 pips)
- **Risk/Reward Ratios**: Independent ratios for different entry types
### PineConnector Setup
- **License ID**: Your PineConnector license key
- **Symbol Override**: MT4/MT5 symbol names if different from TradingView
- **Risk Percentage**: Position size as percentage of account balance
- **Prefix/Comment**: Organize trades in terminal
## Manual Trading Limitations
Without PineConnector automation, traders face significant practical challenges:
**Settings Management**: Each currency pair requires different optimized parameters. Switching between charts means manually adjusting multiple settings each time, creating potential for errors and missed opportunities.
**Timing Sensitivity**: London Open signals can occur rapidly during high-volatility periods. Manual execution may result in slippage or missed entries.
**Multi-Pair Monitoring**: Tracking 4-11 currency pairs simultaneously while manually adjusting settings for each switch becomes impractical for most traders.
**Parameter Consistency**: Risk of using suboptimal settings when quickly switching between pairs, potentially compromising the careful optimization work.
## Recommended Workflow
1. **Historical Testing**: Use win rate HUD to identify profitable pairs and optimal parameters
2. **Demo Automation**: Test PineConnector alerts on demo accounts with optimized settings
3. **Live Implementation**: Deploy alerts only on proven profitable pair/timeframe combinations
4. **Ongoing Monitoring**: Regular review of performance metrics to maintain edge
## Risk Disclaimer
This indicator provides analysis tools and automation capabilities but does not guarantee profitable trading outcomes. Past performance does not predict future results. Users should thoroughly backtest and demo trade before risking live capital. The London session strategy works best during specific market conditions and may underperform during low volatility or unusual market environments.
## Support Requirements
Successful implementation requires:
- Basic understanding of London session market dynamics
- PineConnector subscription for automation features
- Patience for proper optimization process
- Realistic expectations about win rates and drawdown periods
This system is designed for serious traders willing to invest time in proper optimization and risk management rather than plug-and-play solutions.

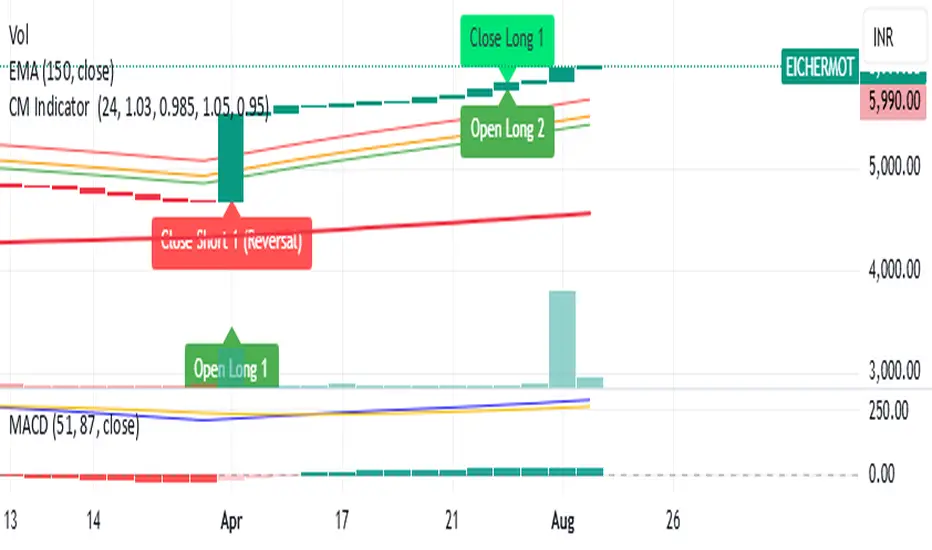
CM Indicator About Indicator:-
1) This is best Indicator for trend identification.
2) This is based on 42 EMA with Upper Band and Lower bands for trend identification.
3) This should be used for Line Bar chart only.
4) Line bar chart should be used at 1 hour for 15 line breaks.
How to Use:-
1) To go with trend is best use of this indicator.
2) This is for stocks and options not for index. Indicator used for Stocks at one hour and options for 10-15 minutes line break.
3) There will be 5% profitability defined for each entry, 3 entries with profit are best posible in same continuous trend 4 and 5th entry is in riskier zone in continuous trend.
4) Loss will only happen if there is trend reversal.
5) Loss could only be one trade of profit out of three profitable trades.
6) Back tested on 200 stocks and 100 options.
Auto Daily High/Low/50%This indicator automatically plots the current daily high and low, as well as the midrange.

Multi-Session Opening RangesThe Multi-Session Opening Ranges indicator plots the Opening Range (OR) levels for three major trading sessions: Asia, London, and New York. It displays the high (ORH), low (ORL), and midline of each session's opening range, helping traders identify key price levels for potential breakouts, reversals, or support/resistance zones.
This indicator is highly customizable, allowing users to tailor the appearance and behavior of each session independently.
Features
Multi-Session Support: Visualizes Opening Ranges for Asia, London, and New York sessions, with customizable session times and timezones.
Customizable Lines: Adjust the color, style (solid, dashed, dotted), and width of ORH, ORL, and midline for each session.
Offset Control: Set a custom offset (in bars) for lines and labels to position them away from price action for better visibility.
Fill Customization: Choose the fill color for the area between ORH and ORL for each session.
Historical Data Option: Toggle the display of historical OR levels to focus on current session data or analyze past ranges.
Timezone Flexibility: Select from a wide range of timezones to align session times with your trading needs.
Label Customization: Adjust the size of labels (tiny, small, normal, large, huge) for clarity on any chart.
How It Works
The indicator identifies the high and low prices during the user-defined opening range period for each session (default: 5 minutes). It then draws:
ORH (Opening Range High): The highest price during the session's opening range.
ORL (Opening Range Low): The lowest price during the session's opening range.
Midline: The average of ORH and ORL, plotted as a dashed line by default.
Filled Area: A semi-transparent fill between ORH and ORL to highlight the range.
Lines and labels extend until the start of the next session or can be offset by a user-specified number of bars for better chart readability. The indicator supports historical data display for analyzing past session ranges.
Inputs
Display:
Show Historical Data: Enable/disable historical OR levels.
Timezone: Select the timezone for session calculations (e.g., UTC-4, UTC+1, etc.).
Asia/London/New York Sessions:
Show Session: Enable/disable the session.
Session Time: Define the start and end time for the opening range (e.g., "0930-0935:1234567" for 9:30–9:35 AM, all days).
Asia/London/New York Style:
ORH/ORL/Midline Color: Set the color for each line.
ORH/ORL/Midline Style: Choose solid, dashed, or dotted styles.
ORH/ORL/Midline Width: Adjust line thickness (1–5).
OR Fill Color: Customize the fill color for the OR area.
Lines/Labels Offset: Set the offset (in bars, -50 to 50) to shift lines and labels relative to price action.
General Style:
Label Size: Set the size of ORH and ORL labels (tiny, small, normal, large, huge).
Usage
Add the indicator to your chart.
Configure session times to match your trading instrument and timezone.
Customize colors, line styles, widths, and offsets for each session to suit your chart preferences.
Use the ORH, ORL, and midline levels to identify key price zones for trading strategies, such as breakouts or reversals.
Notes
Ensure session times do not overlap to avoid conflicts in visualization.
Large offsets may place lines/labels outside the visible chart area; adjust as needed.
The indicator is optimized for intraday timeframes but works on any timeframe.

Basing Candles"The script identifies Basing Candles and plots a circle (white or any chosen color) at the midpoint of the candle’s body when its body is smaller than or equal to half of the candle’s total range."
"السكربت يحدد شموع Basing Candles ويرسم دائرة بيضاء أو أي لون تختاره في منتصف جسمها عندما يكون جسم الشمعة أصغر أو يساوي نصف طولها."

PRO - UPTRADE🔥 Anyone can start trading easily! For traders who want to take it more seriously, the PRO Package gives you full access to stocks, crypto, and forex, complete with BUY/SELL signals, multi-timeframe analysis, and automatic discussion threads based on each asset (stocks, crypto, or forex). 🚀 With PRO, you can maximize profit opportunities across markets
Credit Spread Alpha SignalCredit Spread Alpha Signal: Complete Description
Introduction and Purpose
The Credit Spread Alpha Signal is a custom indicator developed for TradingView, designed to monitor the credit spread between High Yield (HY) bond yields and the 10-Year US Treasury yield (US10Y). This indicator serves as an advanced macroeconomic tool for traders and investors, helping to identify shifts in risk sentiment, monetary policy adjustments, or financial stress in the economy. It combines credit market data with statistical analysis to generate inverted buy and sell signals, where wider spreads (deteriorated conditions) are seen as buy opportunities (green), and tight spreads (risk-on) as sell opportunities (red).
The script is original, inspired by macroeconomic concepts, and visualizes data intuitively with histograms, background colors, and signal arrows. It is particularly useful for portfolio traders seeking confirmation signals or early warnings, integrating seamlessly into charts of stocks, bonds, or crypto assets.
Key Concepts
- HY Spread : Calculated as the difference between the High Yield Corporate Effective Yield (symbol: BAMLH0A0HYM2EY) and the US10Y Yield. Wider spreads indicate higher credit risk and economic deterioration (buy opportunity in the inverted logic). Tight spreads reflect market optimism (risk-on, sell opportunity).
- Inverted Signal Logic : Unlike traditional interpretation, here widening spreads (stress) trigger green and buy arrows (↑ below the chart), suggesting entry into long positions during panics. Compressing spreads trigger red and sell arrows (↓ above the chart), indicating exit during optimism peaks.
- Visual Highlights : Green for spread > +2.2σ (financial stress, buy); Red for spread < low threshold (risk-on, sell); Optional orange for recession risk (inverted curve + high spread, strong buy).
The indicator uses statistics like simple moving average (SMA) and standard deviation for dynamic thresholds, making it adaptable to different market periods.
How It Works: Internal Calculations
1. Data Sources : Uses `request.security` to fetch daily data ("D") from US10Y, US02Y (for inverted curve), and HY Yield.
2. Spread Calculation : `spread_hy = hy_yield - us10y`.
3. Statistics :
- Average (SMA) of the spread over the last `sma_length` days (default: 120).
- Standard deviation (stdev) over the same period.
- High threshold: `avg_spread_hy + std_mult * std_spread_hy` (default: multiplier 2.2).
- Low threshold: Editable value (default: 1.5%).
4. Conditions :
- High stress (green/buy): `spread_hy > high_threshold`.
- Compression (red/sell): `spread_hy < low_threshold`.
- Recession risk (orange/strong buy, optional): Inverted curve (`us10y < us2y`) + spread > `recession_spread_threshold`.
5. Crossings for Signals :
- Buy (green ↑ below): Crossover above high threshold (`ta.crossover`).
- Sell (red ↓ above): Crossunder below low threshold (`ta.crossunder`).
These calculations are processed bar by bar, ensuring real-time updates.
Visual Elements
- Histogram : Plots the spread as columns (`plot.style_columns`), dynamically colored: Light green (90% transparency) for stress/buy; Light red (90%) for compression/sell; Gray for neutral; Orange for recession.
- Reference Line : Horizontal red line at zero for benchmark.
- Background Coloring : Applies color to the main chart (overlay=true via force_overlay): Light green for buy, Light red for sell, Orange for recession, no color for neutral.
- Signal Arrows : ↑ Green below the bar for buy (widening_cross); ↓ Red above the bar for sell (compressed_cross).
- Floating Legend : Label in the lower panel explaining thresholds and conditions, dynamically updated with editable values.
Editable Settings (Inputs)
- SMA Period (days) : Default 120; adjusts the horizon for average and standard deviation.
- Standard Deviation Multiplier : Default 2.2; sets sensitivity of the high threshold (e.g., 2.2σ for moderate alerts).
- Low Threshold for Compression (%) : Default 1.5; level to detect risk-on/sell.
- Enable Recession Risk? : Default false; activates combined condition of inverted curve + high spread.
- Spread Threshold for Recession (%) : Default 2.0; level for recession (visible if enabled).
These inputs allow customization via the TradingView interface, without editing the code.
Integrated Alerts
The indicator includes alert conditions (`alertcondition`) for notifications in TradingView:
- "ALERT: HY Spread High": Spread exceeds threshold - financial stress (Buy).
- "ALERT: HY Spread Compressed": Spread compressed - risk-on conditions (Sell).
- "ALERT: HY Spread Widening (Buy)": Crossover above - buy opportunity in stress.
- "ALERT: HY Spread Compressed (Sell)": Crossunder below - sell opportunity in risk-on.
- "ALERT: Recession Risk (Strong Buy)": Inverted curve + high spread - high recession risk, consider buy (if enabled).
Set up alerts for email, SMS, or webhook notifications.
Usage Tips and Considerations
- Recommended Timeframe : Daily ("D"), but works on others; data is forced to daily for consistency.
- Practical Application : Add to charts of indices like SPY or QQQ to correlate with market moves. Test on historical periods (e.g., 2020 for widening, 2021 for compressing) to validate signals.
- Limitations : Relies on external data (US10Y, HY Yield), which may have delays; spreads are typically positive. Not financial advice – use with complementary analysis.
- Advanced Customization : Adjust thresholds for volatile markets; enable recession for more robust macro signals.
This indicator transforms credit data into actionable alpha, helping navigate economic cycles with visual precision. For support or modifications, refer to the source code or TradingView community.

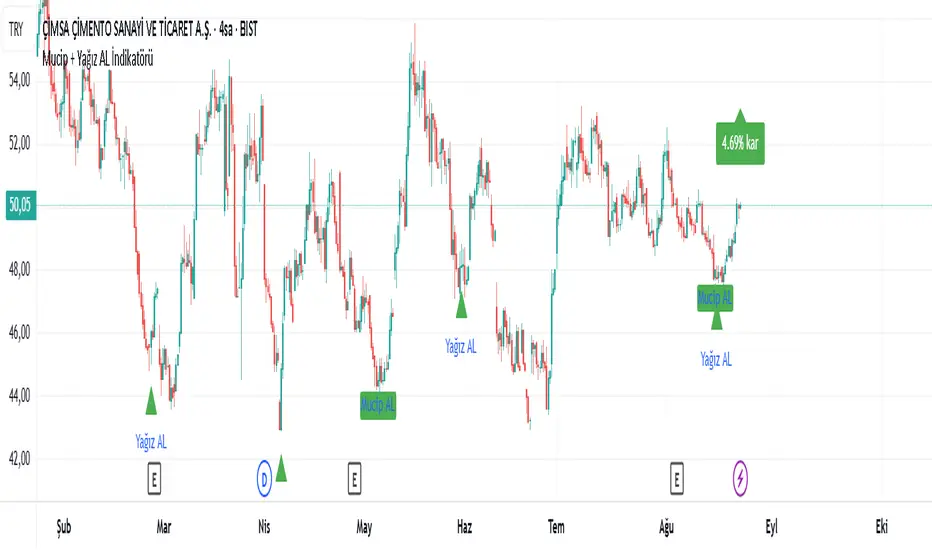
Mucip + Yağız AL BUY İndikatörü v3This is the strengthened version of version 2 with an additional condition. It does not provide definitive results. It is the indicator version of the strategy I use to detect potential reversal points. It will continue to be developed. It should be used in different timeframes and with additional confirmations.
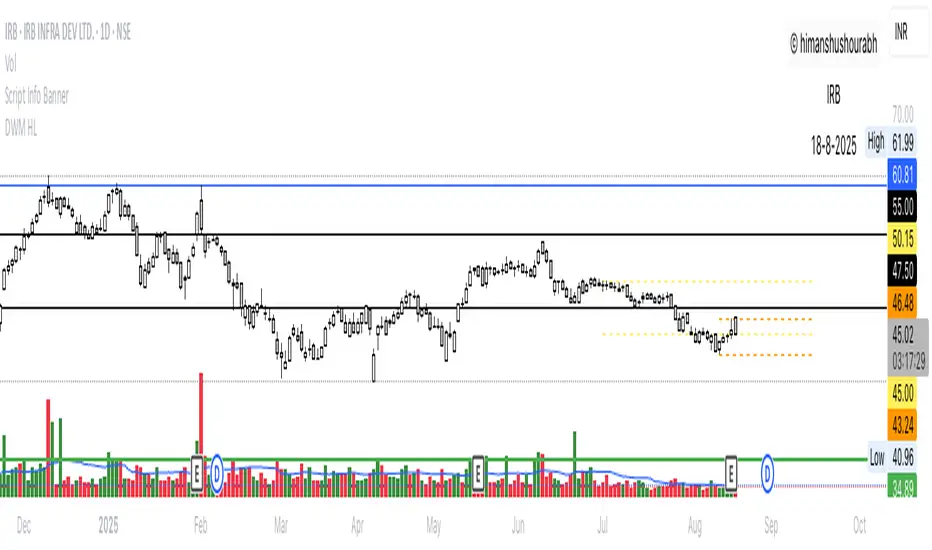
Script Info BannerThe script includes a small template displaying the username, script name, and date of analysis. This feature is implemented to establish credibility and prevent unauthorized use of the analysis.
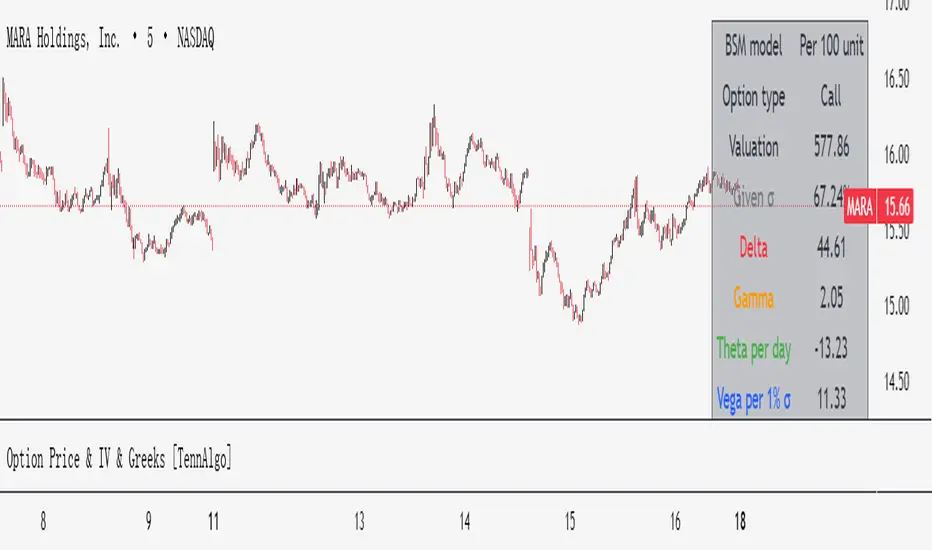
Option Price & Greeks [TennAlgo]A simple and checked pine script indicator showing theoretical option value and Greeks for giving sigma and other parameters.
You can change the underlying price and giving sigma to your sources to get a dynamical BSM option value.
Price and Greeks are plotted in subplot, but a user friendly table is given in top-right.
Enjoy it and leave your issues here, which might be corrected soon or later.