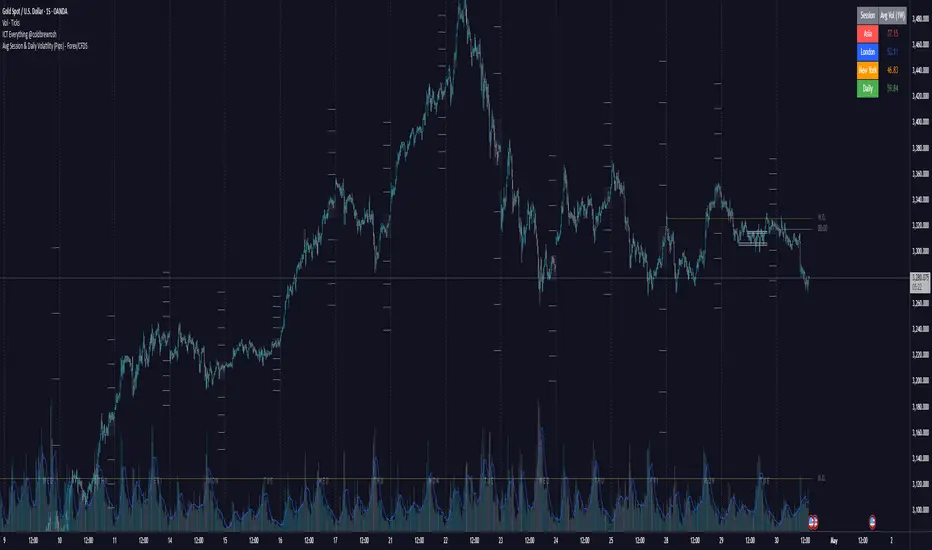
Avg Session & Daily Volatility (Pips) - Forex/CFDS🔍 Overview
The Avg Session & Daily Volatility (Pips) indicator measures the average High–Low range (volatility) of three major Forex sessions—Asia, London, New York—and the entire trading day, then displays the results in a compact overlay table.
⚙️ Key Features
Session Windows
Asia: Default 23:00 – 07:00 server time
London: 07:00 – 16:00
New York: 13:00 – 22:00
Daily Range
– Tracks the full High–Low from midnight to midnight.
Flexible Lookback
– Choose 1W / 2W / 4W / 8W (≈ 5 / 10 / 20 / 40 trading days)
Pip Conversion
Forex Pairs: 1 pip = 0.0001 → (ticks / mintick) / 10
XAU/USD (Gold): 1 pip = 1 USD → direct price difference
Custom Styling
– Pick your own colors per session & daily
– Table position: Left/Center/Right × Top/Middle/Bottom
📈 Benefits & Use Cases
Optimal Stop-Loss & Take-Profit
Gauge each session’s typical movement to size SL/TP appropriately.
Intraday Performance Check
Compare your real-time trade swings against historical averages.
Risk Management
Align position sizes with average volatility to control risk.
Multi-Asset Support
Works seamlessly for major Forex pairs and Gold (XAU/USD) thanks to smart pip logic.
🚀 How It Works
Session Scanning – Continuously tracks the session’s high and low.
Array Storage – At session close, calculates range in pips and pushes it into a rolling buffer.
Averaging – Computes the arithmetic mean of the last N values (your chosen lookback).
Visualization – Paints the four averages in a neat 2×5 table overlay.
👍 Pro Tips
Check Your Time Zone – Make sure chart timezone matches your broker’s session times.
Tweak Lookback – Use shorter windows (1W) to react quickly; longer (4–8W) to smooth out outliers.
Combine Indicators – Pair with volume or trend tools for deeper insights.
Happy Trading,
Riseofatrader
PIP
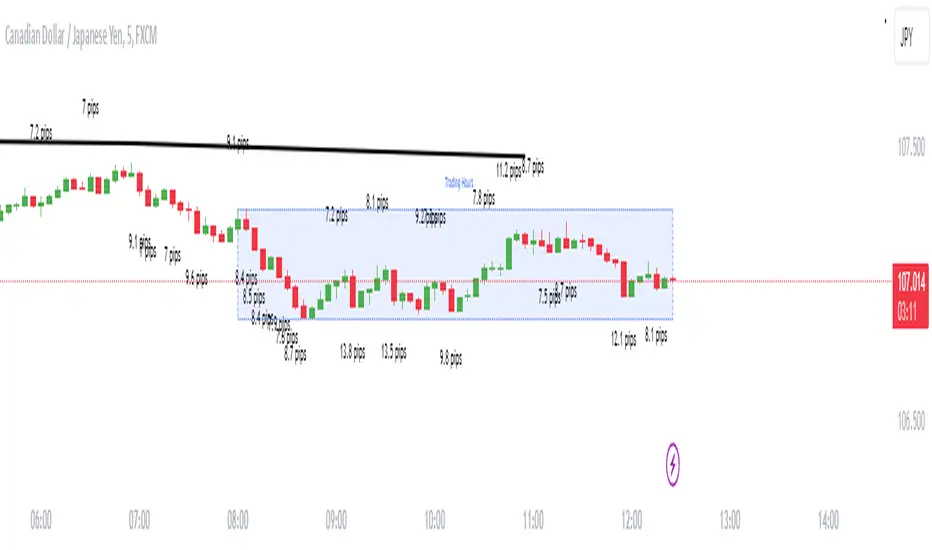
Candle size in pipsDescription
Enhance your trading strategy with precision using this script, designed to measure the range of a candle from wick to wick in pips. Whether you're implementing a specific pip requirement within a candle for your strategy, or simply seeking to better understand market dynamics, this tool provides valuable insights. The script is calculating the amount of pips between the high and the low then compares it to the minimal size you declared. If the amount of pips is more or equal to minimal size it will show the label.
Features
Alert Functionality: Opt to receive alerts by checking the checkbox (default: false).
Customizable Pip Threshold: Tailor the script to your needs by setting the minimum required pips to display on the screen (default: 12).
Different shape: circle, triangle up, triangle down, none
How to Use
Personalize your trading approach by integrating this script with your preferred strategy. For instance, in my strategy involving a 3M continuation, I leverage this tool to determine the pip count of the M15 candle before making entry decisions.
Note: Ensure you understand your strategy's requirements and adjust the script settings accordingly for optimal result s.
Feel free to reach out if you have any questions or require further assistance in maximizing the utility of this script.
YDH/YDL to Current Day H/L - Zones- Draw boxes on the intersections between yesterday's high/low and the day's after high/low
This will help you to visualize areas at extreme points where algo hasn't yet pushed price to recover them

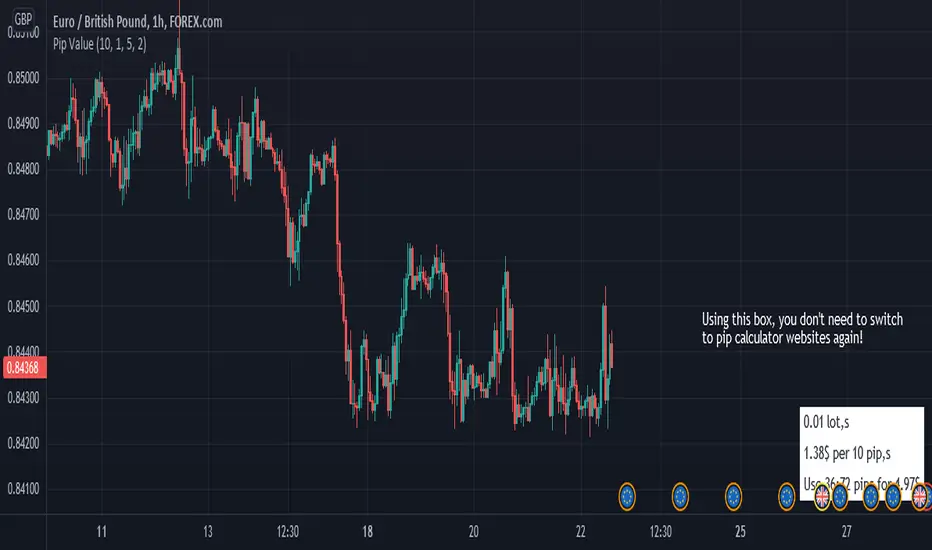
Pip ValueThis simple tool helps you manage your risk by calculating the exact price for pips.
it only works for forex pairs.
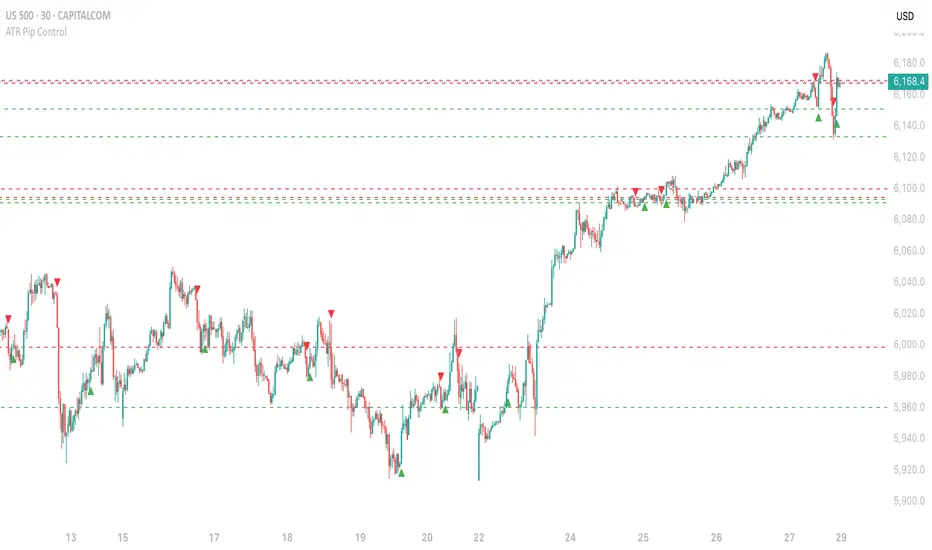
ATR Pip Control█ OVERVIEW
Here is a script based on the ATR but which unlike the traditional ATR using a Multiplier, here we use a signal filter by the Exchange of Prices
between Ticks. The more you increase the value, the more the parasitic signals will be filtered.
█ HOW TO INTERPRET?
• The signals are represented on the chart by "Buy" (Green) and "Sell" (Red) Labels.
• Pip Channel Control : Filters ATR Signals by the Exchange of Prices between Ticks. 0 = Disabled.
• Pip Length : Length of the Pip Channel. Depending on the Markets, the value can differ from 2 to 20 for Futures, Forex, CFD...
(But can go up to 5000 or more for Cryptos.) 0 = Disabled.
• Local High/Low : Local High/Low lines can be used as Stop Loss/Take Profit Zone.
• you have the option to display or not the Unconfirmed Signals on the Chart.
(They will also be displayed with "Buy" and "Sell" Labels but being transparent).
• The indicator works on all Timeframes and all types of markets.
• NO THE INDICATOR DOESN'T REPAINT.
█ ALERTS
Here is the list of Alerts available :
•ATR Buy (Unconfirmed)
•ATR Buy Condition!
•ATR Sell (Unconfirmed)
•ATR Sell Condition!
Please note that it is essential to always choose "Once per bar" (and NOT the "Once per bar close"!) option
whenever you want to place an Alert.