Polynomial Regression HeatmapPolynomial Regression Heatmap – Advanced Trend & Volatility Visualizer
Overview
The Polynomial Regression Heatmap is a sophisticated trading tool designed for traders who require a clear and precise understanding of market trends and volatility. By applying a second-degree polynomial regression to price data, the indicator generates a smooth trend curve, augmented with adaptive volatility bands and a dynamic heatmap. This framework allows users to instantly recognize trend direction, potential reversals, and areas of market strength or weakness, translating complex price action into a visually intuitive map.
Unlike static trend indicators, the Polynomial Regression Heatmap adapts to changing market conditions. Its visual design—including color-coded candles, regression bands, optional polynomial channels, and breakout markers—ensures that price behavior is easy to interpret. This makes it suitable for scalping, swing trading, and longer-term strategies across multiple asset classes.
How It Works
The core of the indicator relies on fitting a second-degree polynomial to a defined lookback period of price data. This regression curve captures the non-linear nature of market movements, revealing the true trajectory of price beyond the distortions of noise or short-term volatility.
Adaptive upper and lower bands are constructed using ATR-based scaling, surrounding the regression line to reflect periods of high and low volatility. When price moves toward or beyond these bands, it signals areas of potential overextension or support/resistance.
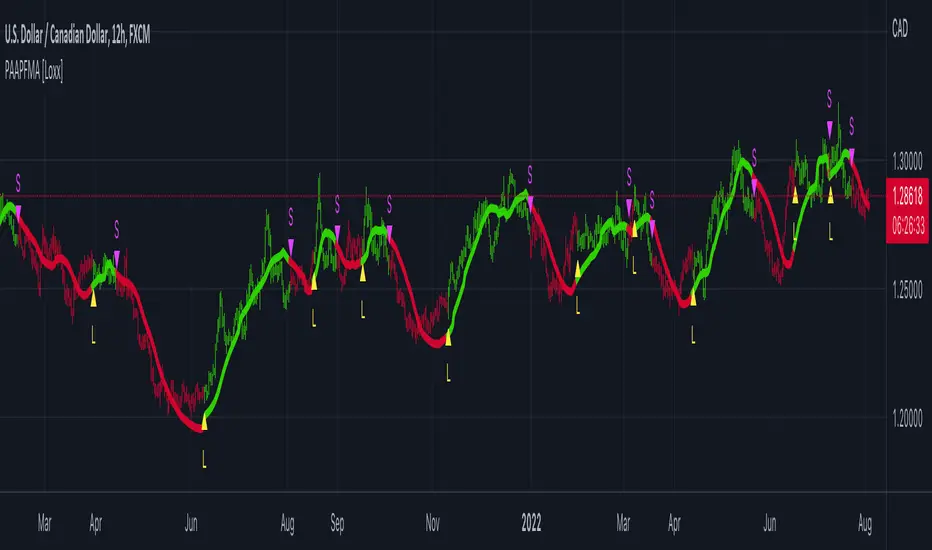
The heatmap colors each candle based on its relative position within the bands. Green shades indicate proximity to the upper band, red shades indicate proximity to the lower band, and neutral tones represent mid-range positioning. This continuous gradient visualization provides immediate feedback on trend strength, market balance, and potential turning points.
Optional polynomial channels can be overlaid around the regression curve. These three-line channels are based on regression residuals and a fixed width multiplier, offering additional reference points for analyzing price deviations, trend continuation, and reversion zones.
Signals and Breakouts
The Polynomial Regression Heatmap includes statistical pivot-based signals to highlight actionable price movements:
Buy Signals – A triangular marker appears below the candle when a pivot low occurs below the lower regression band.
Sell Signals – A triangular marker appears above the candle when a pivot high occurs above the upper regression band.
These markers identify significant deviations from the regression curve while accounting for volatility, providing high-quality visual cues for potential entry points.
The indicator ensures clarity by spacing markers vertically using ATR-based calculations, preventing overlap during periods of high volatility. Users can rely on these signals in combination with heatmap intensity and regression slope for contextual confirmation.
Interpretation
Trend Analysis :
The slope of the polynomial regression line represents trend direction. A rising curve indicates bullish bias, a falling curve indicates bearish bias, and a flat curve indicates consolidation.
Steeper slopes suggest stronger momentum, while gradual slopes indicate more moderate trend conditions.
Volatility Assessment :
Band width provides an instant visual measure of market volatility. Narrow bands correspond to low volatility and potential consolidation, whereas wide bands indicate higher volatility and significant price swings.
Heatmap Coloring :
Candle colors visually represent price position within the bands. This allows traders to quickly identify zones of bullish or bearish pressure without performing complex calculations.
Channel Analysis (Optional) :
The polynomial channel defines zones for evaluating potential overextensions or retracements. Price interacting with these lines may suggest areas where mean-reversion or trend continuation is likely.
Breakout Signals :
Buy and Sell markers highlight pivot points relative to the regression and volatility bands. These are statistical signals, not arbitrary triggers, and should be interpreted in context with trend slope, band width, and heatmap intensity.
Strategy Integration
The Polynomial Regression Heatmap supports multiple trading approaches:
Trend Following – Enter trades in the direction of the regression slope while using the heatmap for momentum confirmation.
Pullback Entries – Use breakouts or deviations from the regression bands as low-risk entry points during trend continuation.
Mean Reversion – Price reaching outer channel boundaries can indicate potential reversal or retracement opportunities.
Multi-Timeframe Alignment – Overlay on higher and lower timeframes to filter noise and improve entry timing.
Stop-loss levels can be set just beyond the opposing regression band, while take-profit targets can be informed by the distance between the bands or the curvature of the polynomial line.
Advanced Techniques
For traders seeking greater precision:
Combine the Polynomial Regression Heatmap with volume, momentum, or volatility indicators to validate signals.
Observe the width and slope of the regression bands over time to anticipate expanding or contracting volatility.
Track sequences of breakout signals in conjunction with heatmap intensity for systematic trade management.
Adjusting regression length allows customization for different assets or timeframes, balancing responsiveness and smoothing. The combination of polynomial curve, adaptive bands, heatmap, and optional channels provides a comprehensive statistical framework for informed decision-making.
Inputs and Customization
Regression Length – Determines the number of bars used for polynomial fitting. Shorter lengths increase responsiveness; longer lengths improve smoothing.
Show Bands – Toggle visibility of the ATR-based regression bands.
Show Channel – Enable or disable the polynomial channel overlay.
Color Settings – Customize bullish, bearish, neutral, and accent colors for clarity and visual preference.
All other internal parameters are fixed to ensure consistent statistical behavior and minimize potential misconfiguration.
Why Use Polynomial Regression Heatmap
The Polynomial Regression Heatmap transforms complex price action into a clear, actionable visual framework. By combining non-linear trend mapping, adaptive volatility bands, heatmap visualization, and breakout signals, it provides a multi-dimensional perspective that is both quantitative and intuitive.
This indicator allows traders to focus on execution, interpret market structure at a glance, and evaluate trend strength, overextensions, and potential reversals in real time. Its design is compatible with scalping, swing trading, and long-term strategies, providing a robust tool for disciplined, data-driven trading.
Polynomialregressionanalysis

[Excalibur] Advanced Polynomial Regression Trend ChannelIt's been a long time coming... Regression channel enthusiasts, it's 'ultimately' here! Welcome to my Apophis page. But first, let me explain the origins of its attributed name blending both descriptive & engaging content with concise & technical topics...
EGYPTIAN ROOTED TALES:
Apophis (Greek) or Apep (Egyptian) was known by many cultures to be a mighty Egyptian archetype of chaos, darkness, and destruction. In ancient Egyptian mythology, Apophis was often depicted in the form of a fearsome menacing serpent, in those days, with an insatiable appetite for relentless malevolence. This dreaded entity was considered a formidable enemy and was also believed to appear as a giant serpent arising from the underworld.
Forever engaging in eternal battle, according to lore, Apophis' adversarial attributes represented the forces of disorder and anarchy clashing with the forces of order and harmony. This serpent's wickedly described figure was significantly symbolic of the disruptive, treacherous powers that Apophis embodied, those which threatened to plunge the perceivable archaic world into darkness. To the ancients, the legendary cyclical struggles against Apophis served as allegory reflecting on the macrocosm of the larger conflict between good and evil disparities that shaped early ancient civilization, much like the tree serpent.
One of Apophis’ mythological roots was immortally depicted on tomb stone. On one particular hieroglyphic wall tableau, in the second chamber of Inherkau’s tomb at Deir el-Medina, within the Theban Necropolis, portrays a mural of a serpent (Apep) under an edible fruit tree being slain in defeat. The species of snake depicted on various locations of tomb walls appears to me to bear a striking resemblance to the big eyed Echis pyramidum (Egyptian saw-scaled viper) native to regions of North Africa and the Middle East. It's a species of viper notoriously contributing to the most snake bite fatalities in the world still to this day; talk about a true harbinger of chaos incarnate. You do NOT want to cross paths with this asp in the dark of night, ever! Nor the other species of Echis found around Echid trees in the garden.
As we all know, fabled archaic storytelling can be misconstruing. Yet, these archaic serpent narratives still have echoes of significant notions and wisdom to learn from, especially in a modern technological society still rife with miscalculating deep snakes slithering about with intent to specifically plot disorder on national scales, and then profitably capitalize on it. Many deep black snakes are hiding in plain sight and under rocks. They do indeed speak and spell with forked tongues and malfeasance to the masses. I have great news. Tools now exist in the realms of AI combined with fractal programming circles to uncover these venomous viper mesh networks and investigatively monitor their subversive activities, so their days are surely numbered for... GAME OVER. Prepare to meet the doom you vain vipers have sought!
The arrival of the great and powerful international storm of the century has come, clothed in vindication. It's the only just way for the globe to clean house and move forward economically into the evolving herafter unobstructed by rampant evils and corruption. The foundations of future architectures are being established, and these nefarious obstacles MUST NOT hinder that path ahead.
With my former days of serpent wrangling being behind me, I now explore avenues of history, philosophy, programming, and mathematics, weaving them all into my daily routine. Now is the time to make some mathematical history unfold and get to the good and spicy stuff that you as the reader seek...
CALCULATING ON CHAOS:
Perhaps frightful characteristics of serpents (their maneuverability to adapt to any swervy situation) could be harnessed and channeled into a powerful tool for navigating the treacherous waters of data chaos. What if taming a monstrous beast of mayhem was not only possible, but fully achievable? Well, I think I have improved upon an approach to better tackle fractal chaos handling and observation within a modest PSv6 float environment without doubles. Finally, I've successfully turned my pet anaconda, Apophis, into a docile form of mathematical charting resilience beyond anything I have ever visually witnessed before. This novel work clearly deprecates ALL of my prior regression works by performing everything those delivered AND more, but it doesn't necessarily eliminate them into extinction.
INTRODUCTION:
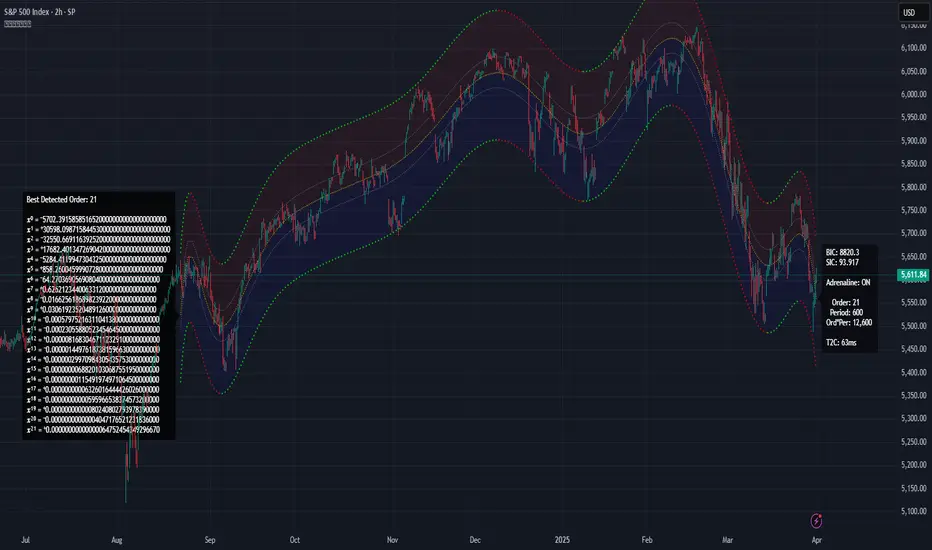
Allow me to introduce Apophis! What you see showcased above is also referred to as 'Advanced Polynomial Regression Trend Channel' (APRTC) for technical minds. I would describe it as an avant-garde trend channel obtaining accurate polynomial approximations on market data with Pine v6.0. APRTC is a fractal following demystifier that I can only describe as being a signal trajectory tracking stalker manifesting as a data devouring demon. My full-fledged 'Excalibur' version of poly-regression swiftly captures undulating patterns present in market data with ease and at warp speed faster than you can blink. Now unchained, this is my rendering of polynomial wrath employing the "Immense Power of Pine".
By pushing techniques of regression to extremes, I am able to trace the serpentine trajectory of chaos up to a 50th order with 100s or 1000s of samples via "advanced polynomial regression" (APR), aka Apophis. This uniquely reactive trend channel method is designed to enhance the way we engage with the complex challenge of observably interpreting chaotic price behavior. While this is the end of the road for my revolutionary trend channel technology, that doesn't imply that future polynomial regression upgrades won't/might occur... There are a number of other supplementary concepts I have in my mind that could potentially prove useful eventually, who knows. However, for the moment, I feel it's wisest to monitor how accommodating APRTC is towards servers for the present time.
HISTORICAL ENDEAVORS:
Having wrangled countless wild serpents in my youth by the handfuls, tackling this was one multi-headed regression challenge temptation I couldn't resist. Besides, serpents in reality are more than often scared of us in the wild, so I assumed this shouldn't be too terribly hard. Wrong! It's been a complex struggle indeed. APRTC gave me many stinging bites for a LONG time. I had unknowingly opened Pandora's box of polynomials unprepared for what was to follow.
Long have I wrestled with Apophis throughout many nights for years with adversity, at last having arrived at a current grand solution and ultimately emerging victorious. Now, does the significance of the entitled name Apophis become more apparent at this point of reading? What you can now witness above is a very powerful blend of precision combined with maneuverability, concluding my dreamy expectations of a maximal experience with polynomial regression in TV charts. With all of my wizardry components finally assembled, Apophis genuinely is the most phenomenal indicator I ever devised in my life... as of yet.
How was this accomplished? By unlocking a deep understanding of the mathematical principles that govern regression, combined with an arsenal of mathemagical trickeries through sheer determination. I also spent an incredible amount of time flexing the unbendable 64bit float numerics to obtain a feasible order/degree of up to 50 polynomials or up to 4000 bars of regression (never simultaneously) on a labyrinth of samples. Lastly, what was needed was a pinch of mathematical pixie dust with a pleasant dose of Pine upgrades (lots of line re-drawings) that millions of other members can also utilize. Thank you so much, Pine developers, for once again turning meager proposed visions into materialized reality by leveraging the "Power of Pine" for the many!
DESCRIBING POLYNOMIAL REGRESSION:
APRTC is a visual guide for navigating noisy markets, providing both trajectory and structure through the power of mathematical modeling. Polynomial regression, especially at higher orders, exhibits obvious sidewinder/serpentine like characteristics. Even the channel extremities, on swift one second charts, resemble scales in motion with a pair of dashed exterior lines. This poly version presently yields the best quality of fit, providing an extreme "visual analysis" of your price action in high noise environments. The greater the order of the polynomial, the more pronounced the meandering regression characteristics become, as the algorithm strives to visually capture the fundamental fractal patterns most effectively.
Polynomial Regression in Action:
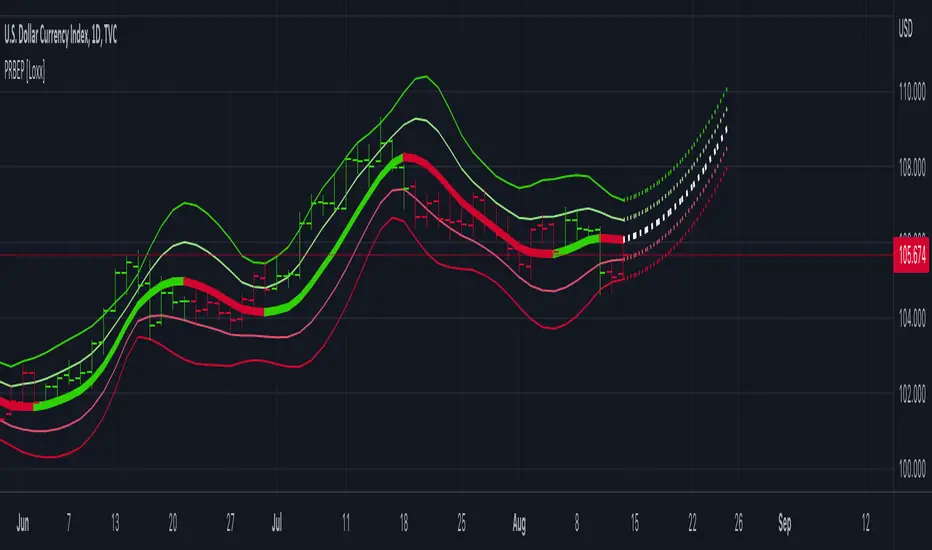
The medial line displays the core polynomial regression approximation in similarity to spinal backbones of serpents when following the movements of market data. Encasing the central structure, the channel's skin consists of enveloping lines having upper and lower extremes. To further enhance visualization, background fill colors distinguish the breadth between positive and negative territories of potential movement.
Additional internal dotted variability lines are available with multiple customizable settings to adjust dynamic dispersion, color, etc. One other exciting feature I added is the the ability to see the polynomial values with up to 50 (adjustable) decimal places if available. Witnessing Xⁿ values tapering near to 0.0 may indicate overfitting. Linear regression is available at order=1 and quadratic regression is invoked using order=2.
Information Criterion:
A toggleable label provides a multitude of information such as Bayesian Information Criterion (BIC), order, period, etc. BIC serves as an polynomial regression fit metric, with lesser values indicating a better balance between polynomial order adjustments, reflecting a more accurate fit in relation to the channel's girth. One downside of BIC values is their often large numerical values, making visual comparisons challenging, and then also their rare occurrence as negative values.
Furthermore, I formulated my own "EXPERIMENTAL" Simpler Information Criterion (SIC) fit metric, which seems to offer better visual interpretability when adjusting order settings on a selected regression period, especially on minuscule price numerics. Positive valued SIC numerics with lesser digits also reflect a preferred better fit during order adjustment, same as applying BIC principles of the minimum having a superior calulation tendency. I'll let members be the judge of deciding whether my SIC is actually a superior information criterion compared to BIC.
TECHNICAL INTERPRETATION and APPLICATION:
The Apophis indicator utilizes high-order polynomial regression, up to a maximum 50th order ability to deliver a nuanced, visual representation of complex market dynamics. I would caution against using upwards toward a 50th order, because opting for a 50th order polynomial is categorically speaking "wildly unsane" in real-world practice. As the polynomial degree increases from lesser orders, the regression line exhibits more pronounced curvature and undulations.
Visually analyzing the regression curve can provide insights into prevailing trends, as well as volatility regimes. For example, a gently sloping line may signal a steady directional trend, while a tightly curled oscillating curve may indicate heightened volatility and range-bound trading. Settings are rather straight forward, and comparable to my former "Quadratic Regression Trend Channel" efforts, although one torturous feature from QRTC is omitted due too computational complexity concerns.
Notice: Trial invite only access will not be granted for this indicator. Those who are familiar with recognizing what APRTC is, you will either want it or not, to add to your arsenal of trading approaches.
When available time provides itself, I will consider your inquiries, thoughts, and concepts presented below in the comments section, should you have any questions or comments regarding this indicator. When my indicators achieve more prevalent use by TV members , I may implement more ideas when they present themselves as worthy additions. Have a profitable future everyone!
RISK DISCLAIMER:
My scripts and indicators are specifically intended for informational and educational use only. This script uses historical data points to perform calculations to derive real-time calculations. They do not infer, indicate, or guarantee future results or performance.
By utilizing this script/indicator or any portion of it, you agree to accept 100% responsibly and liability for your investment or financial decisions, and I will not be held liable for your subjective analytic interpretations incurring sustained monetary losses. The opinions and information visual or otherwise provided by this script/indicator is not investment advice, nor does it constitute recommendation.
Polynomial Regression Bands w/ Extrapolation of Price [Loxx]Polynomial Regression Bands w/ Extrapolation of Price is a moving average built on Polynomial Regression. This indicator paints both a non-repainting moving average and also a projection forecast based on the Polynomial Regression. I've included 33 source types and 38 moving average types to smooth the price input before it's run through the Polynomial Regression algorithm. This indicator only paints X many bars back so as to increase on screen calculation speed. Make sure to read the tooltips to answer any questions you have.
What is Polynomial Regression?
In statistics, polynomial regression is a form of regression analysis in which the relationship between the independent variable x and the dependent variable y is modeled as an nth degree polynomial in x. Polynomial regression fits a nonlinear relationship between the value of x and the corresponding conditional mean of y, denoted E(y |x). Although polynomial regression fits a nonlinear model to the data, as a statistical estimation problem it is linear, in the sense that the regression function E(y | x) is linear in the unknown parameters that are estimated from the data. For this reason, polynomial regression is considered to be a special case of multiple linear regression .
Related indicators
Polynomial-Regression-Fitted Oscillator
Polynomial-Regression-Fitted RSI
PA-Adaptive Polynomial Regression Fitted Moving Average
Poly Cycle
Fourier Extrapolator of Price w/ Projection Forecast
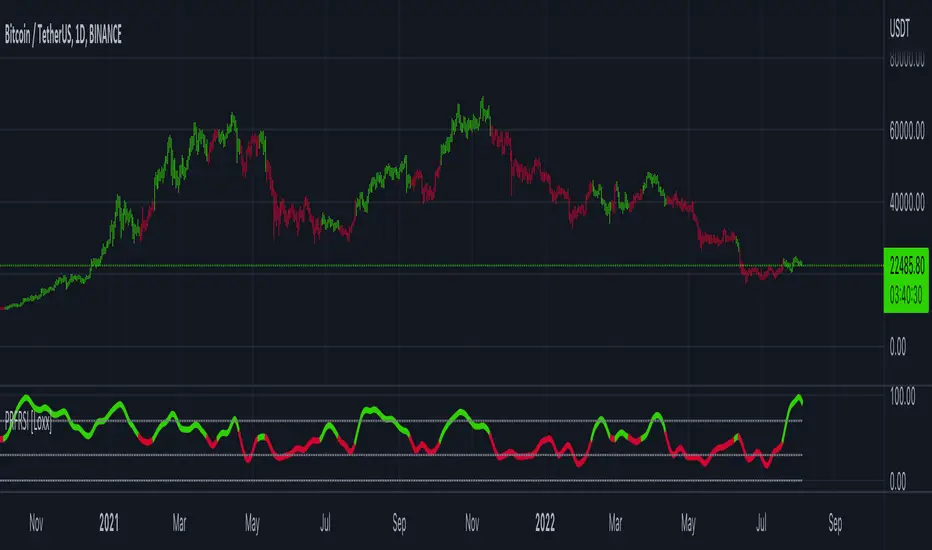
Polynomial-Regression-Fitted RSI [Loxx]Polynomial-Regression-Fitted RSI is an RSI indicator that is calculated using Polynomial Regression Analysis. For this one, we're just smoothing the signal this time. And we're using an odd moving average to do so: the Sine Weighted Moving Average. The Sine Weighted Moving Average assigns the most weight at the middle of the data set. It does this by weighting from the first half of a Sine Wave Cycle and the most weighting is given to the data in the middle of that data set. The Sine WMA closely resembles the TMA (Triangular Moving Average). So we're trying to tease out some cycle information here as well, however, you can change this MA to whatever soothing method you wish. I may come back to this one and remove the point modifier and then add preliminary smoothing, but for now, just the signal gets the smoothing treatment.
What is Polynomial Regression?
In statistics, polynomial regression is a form of regression analysis in which the relationship between the independent variable x and the dependent variable y is modeled as an nth degree polynomial in x. Polynomial regression fits a nonlinear relationship between the value of x and the corresponding conditional mean of y, denoted E(y |x). Although polynomial regression fits a nonlinear model to the data, as a statistical estimation problem it is linear, in the sense that the regression function E(y | x) is linear in the unknown parameters that are estimated from the data. For this reason, polynomial regression is considered to be a special case of multiple linear regression .
Included
Alerts
Signals
Bar coloring
Loxx's Expanded Source Types
Loxx's Moving Averages
Other indicators in this series using Polynomial Regression Analysis.
Poly Cycle
PA-Adaptive Polynomial Regression Fitted Moving Average
Polynomial-Regression-Fitted Oscillator
Polynomial-Regression-Fitted Oscillator [Loxx]Polynomial-Regression-Fitted Oscillator is an oscillator that is calculated using Polynomial Regression Analysis. This is an extremely accurate and processor intensive oscillator.
What is Polynomial Regression?
In statistics, polynomial regression is a form of regression analysis in which the relationship between the independent variable x and the dependent variable y is modeled as an nth degree polynomial in x. Polynomial regression fits a nonlinear relationship between the value of x and the corresponding conditional mean of y, denoted E(y |x). Although polynomial regression fits a nonlinear model to the data, as a statistical estimation problem it is linear, in the sense that the regression function E(y | x) is linear in the unknown parameters that are estimated from the data. For this reason, polynomial regression is considered to be a special case of multiple linear regression .
Things to know
You can select from 33 source types
The source is smoothed before being injected into the Polynomial fitting algorithm, there are 35+ moving averages to choose from for smoothing
This indicator is very processor heavy. so it will take some time load on the chart. Ideally the period input should allow for values from 1 to 200 or more, but due to processing restraints on Trading View, the max value is 80.
Included
Alerts
Signals
Bar coloring
Other indicators in this series using Polynomial Regression Analysis.
Poly Cycle
PA-Adaptive Polynomial Regression Fitted Moving Average

PA-Adaptive Polynomial Regression Fitted Moving Average [Loxx]PA-Adaptive Polynomial Regression Fitted Moving Average is a moving average that is calculated using Polynomial Regression Analysis. The purpose of this indicator is to introduce polynomial fitting that is to be used in future indicators. This indicator also has Phase Accumulation adaptive period inputs. Even though this first indicator is for demonstration purposes only, its still one of the only viable implementations of Polynomial Regression Analysis on TradingView is suitable for trading, and while this same method can be used to project prices forward, I won't be doing that since forecasting is generally worthless and causes unavoidable repainting. This indicator only repaints on the current bar. Once the bar closes, any signal on that bar won't change.
For other similar Polynomial Regression Fitted methodologies, see here
Poly Cycle
What is the Phase Accumulation Cycle?
The phase accumulation method of computing the dominant cycle is perhaps the easiest to comprehend. In this technique, we measure the phase at each sample by taking the arctangent of the ratio of the quadrature component to the in-phase component. A delta phase is generated by taking the difference of the phase between successive samples. At each sample we can then look backwards, adding up the delta phases.When the sum of the delta phases reaches 360 degrees, we must have passed through one full cycle, on average.The process is repeated for each new sample.
The phase accumulation method of cycle measurement always uses one full cycle’s worth of historical data.This is both an advantage and a disadvantage.The advantage is the lag in obtaining the answer scales directly with the cycle period.That is, the measurement of a short cycle period has less lag than the measurement of a longer cycle period. However, the number of samples used in making the measurement means the averaging period is variable with cycle period. longer averaging reduces the noise level compared to the signal.Therefore, shorter cycle periods necessarily have a higher out- put signal-to-noise ratio.
What is Polynomial Regression?
In statistics, polynomial regression is a form of regression analysis in which the relationship between the independent variable x and the dependent variable y is modelled as an nth degree polynomial in x. Polynomial regression fits a nonlinear relationship between the value of x and the corresponding conditional mean of y, denoted E(y |x). Although polynomial regression fits a nonlinear model to the data, as a statistical estimation problem it is linear, in the sense that the regression function E(y | x) is linear in the unknown parameters that are estimated from the data. For this reason, polynomial regression is considered to be a special case of multiple linear regression.
Things to know
You can select from 33 source types
The source is smoothed before being injected into the Polynomial fitting algorithm, there are 35+ moving averages to choose from for smoothing
The output of the Polynomial fitting algorithm is then smoothed to create the signal, there are 35+ moving averages to choose from for smoothing
Included
Alerts
Signals
Bar coloring