TJ-Bitmex Funding RateWelcome back to another indicator of the TJ-Series
All indicators I publish, are based on existing indicator ideas just modified and in the selection of a CryptoCurrency Day Trader
This indicator emulates BitMEX funding rates with reasonably accurate results.
I have made a YouTube Video on my channel "TJ Trade Corner" explaining Funding Rates and how each of them work and what these are based on.
There is a google form link in the description, which when filled out correctly will grant you permission to this indicator.
BitMEX funding occurs every 8 hours at 4:00 UTC, 12:00 UTC and 20:00 UTC.
You pay the funding rate if you are in a position at funding time.
The funding rate is predicted from the minute funding occurs over 480 minutes (8 hours).
After 8 hours, which is another funding time, the predicted rate is set as the next funding rate, which will be paid 8 hours later at the next funding time.
For example:
It is 4:00 UTC and funding is paid, and there is currently a predicted rate of 0.01.
The predicted rate, 0.01, will be set as the next funding rate which will be paid in 8 hours at the next funding time.
The predicted rate resets and will become a more accurate prediction each minute.
Funding Rate Bar: On the bar on which funding is paid (see funding times), a column is rendered with the value of the paid funding rate.
Next Funding Rate: The rendered circles show the next funding rate, which will be the value of the Funding Rate Bar
Predicted Funding Rate: The rendered line is the predicted funding rate that resets when funding is paid.
Daily, Weekly, and Monthly views show the total of fundings within the bar.
i.e. a daily bar contains 3 funding periods, so if funding were 0.1 each of those times, the daily funding is 0.3.
There are 21 funding periods in a week, so a week during which the funding was 0.1 on average will have a Weekly bar with a funding value of 2.1
PRINTED VALUES
Predicted Funding Rate | Next Funding Rate | Funding Rate Bar
OPTIONS
Contract: Choose the BitMEX perpetual swap contract for which to emulate funding. XBTUSD or ETHUSD
This Indicator and the video have been published before in my private learning group "ETG".
We are going over many observations and possible trades very frequently.
It is meant for only those who are really interested in becoming a self sufficient trader and learning about all the secrets of trading.
Should you be interested in ETG or the indicators I use, join my discord channel and say hi in chat, then I will give you a free trial for which you might be interested.
Like and Follow me and you will find the space interesting because I am a TA expert and professional day trader in crypto since 2012 that does daily updates and new posts about the hottest and most discussed coins.
Cheers TJ
Prediction

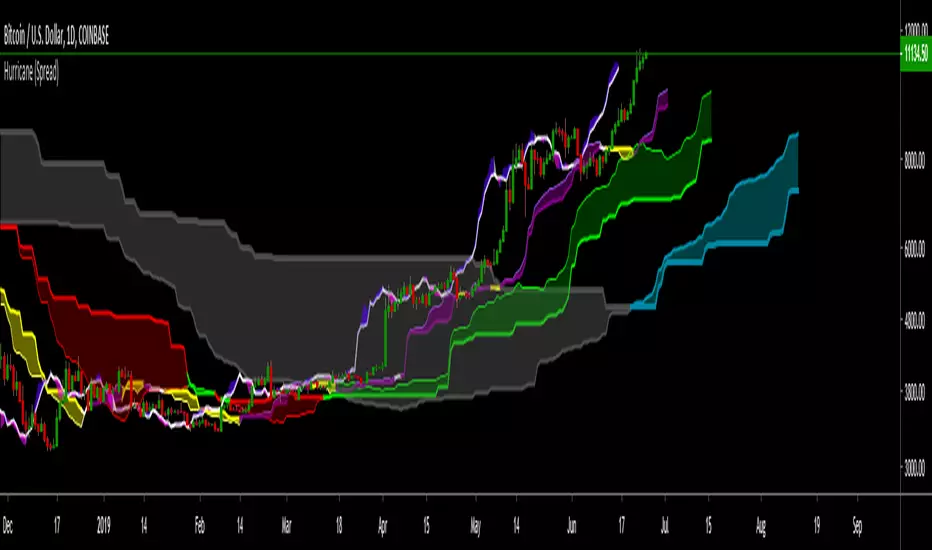
HurricaneThe Hurricane Indicator
This Indicator takes the traditional Ichimoku and expands it's capabilities to a whole new level.
It is a trend based trading indicator that utilises equilibrium calculations from multiple time frames, to reveal areas of support, resistance, strength, weakness, acceleration and momentum throughout the various bull and bear market trends.
By using the three components of the Hurricane together (or individually), it presents the entire picture of micro, mid-term and macro trends, enabling the trader to scalp price movements on a smaller time frame whilst keeping an eye on the larger trend.
For a full write up on what it does and the explained settings follow this link:
docs.google.com
Add this to your favorites, then send me a message through Trading View and I'll grant you temporary access to try it out.
To continue using it after the trial period, send me a message.
BTC: 13UKYNt4AAz2Yh2Suu6AAEWoUEiRVjqC12
LTC: LX4bUBdjiRPsagUbZoAczSGgDC4YqTJL7w
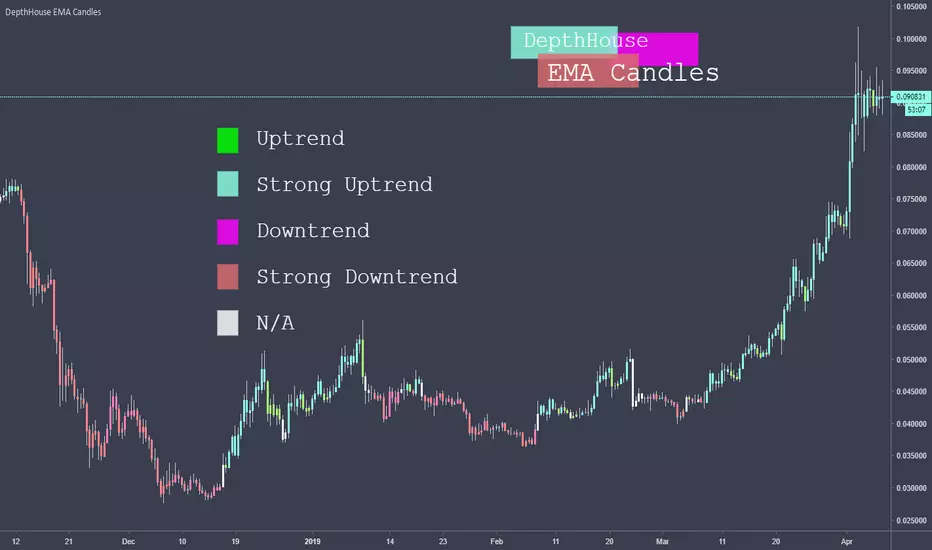
DepthHouse Exponential CandlesThis EMA Candles indicator use the price movement between two user selected Exponential Moving Averages to help determine the current trend.
As of release, there are 5 possible bar color outputs, all of which are shown in the legend above.
The Five Electable Color Outputs:
Uptrend; Strong Uptrend; Downtrend; Strong Downtrend; n/a
I hope you all enjoy!
Please leave your suggestions in the comments below!
Pivot Point Daily prediction bitcoin - by Simon-RoseThis is an additional Script to my recent Pivot Point indicator scripts which will show you the next days pivot points based on the actual price range.
This is useful if you are trading right before a new day and want to know how the next bdays pivot points may be placed.
If you have any questions or suggestions pls write me :)
Happy trading
Cheers
Daily Pivots:
Weekly Version:
Monthly Version:

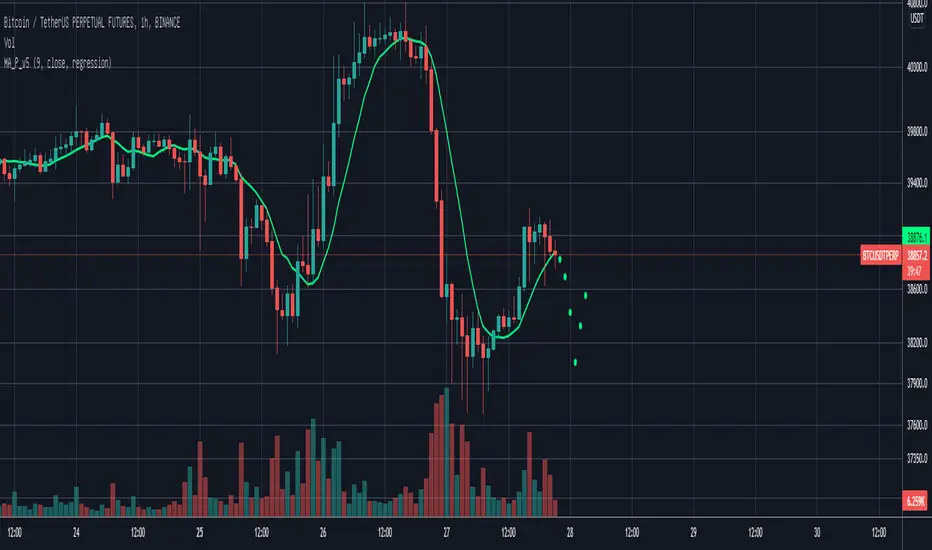
Moving Average PredictionFeatures:
This script could predict future moving average price based on statistic methods.
Getting Started:
Add this indicator to your chart and you'll see the future price.
There are two kinds of algorithms: progression & regression.
Contributing:
You can report bugs or issues under this page.
Any advice would be helpful for improving this indicator's accuracy.
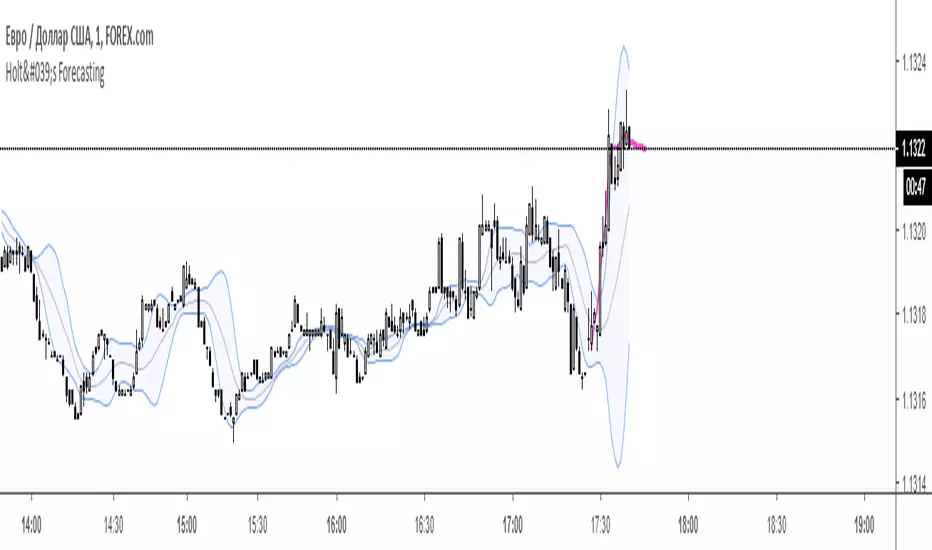
HoltsMethodHolt's method (see: otexts.com)
Holt (1957) extended simple exponential smoothing to allow the forecasting of data with a trend.
This method involves a forecast equation and two smoothing equations (one for the level and one for the trend):
Forecast equation: ŷ = l + h * b
Level equation: l = alpha * y + (1 - alpha) * (l + b )
Trend equation: b = beta * (l - l ) + (1 - beta) * b
where h is a step forward or lookahead
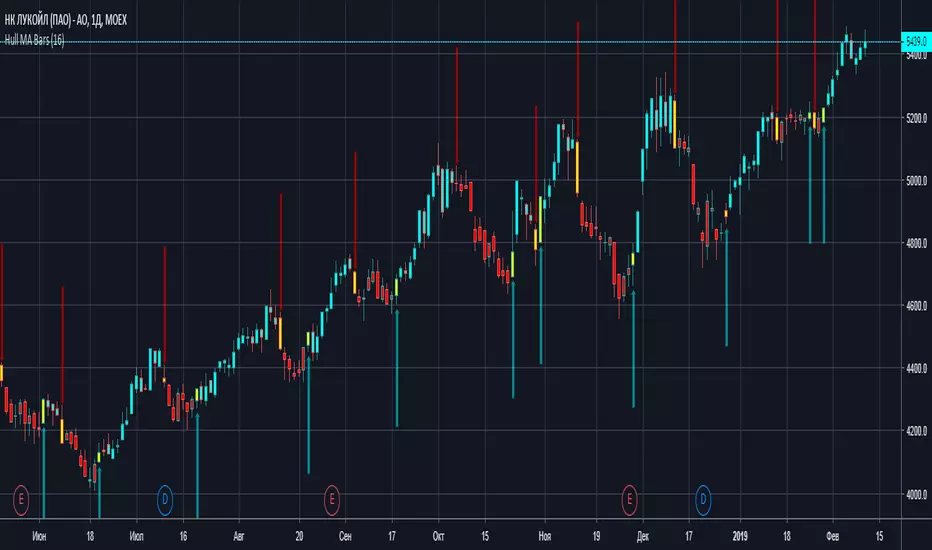
Hull MA BarsThis indicator fill bars with color of HullMA + warning yellow bars, then trend reversing
RSI Correlation with future priceThis script measures the correlation of the hourly RSI of 24 hours ago with the difference of price between now and the price 24 hours ago. In other words, this is an indicator which measures the predictive power of the RSI.
Green means that the price is strongly correlated with the past RSI (which is the normal state when the market is flat and there is no news).
Red means that the price is inversely correlated with the past RSI.
The hourly RSI is a leading indicator which enables you to (sort of) see into the future. It shows you how the current price is, compared to the price 24 (or 48) hours into the future.
If the RSI is low, it means the current price is low compared to the future price, and if the RSI is high, it means the current price is high compared to the future price.
So the hourly RSI really correlates (in the way I described) to the price 24 hours in the future.
Except when it doesn't!!!
What happens when the correlation breaks (RED on this indicator)? Usually there are important news - a strong signal external to the chart. There are either economy at large news, or security-specific news.
Following a strong break of this RSI-future price correlation, some cash can be made by understanding what happened and playing the restoration of the RSI-price correlation.

Hull MA & Warning Zones & Buy/Sell ArrowsThis moving average, in contrast to the standard, shows a slowdown of the current trend - it draws additional zones of yellow color. These zones show a possible trend reversal by 1-2 bars earlier than the standard Hull moving average. Additionally, there are arrows to enter a position and the second is the same MA for another timeframe, which can be selected in the settings.

AM HellachoppyThis script shows choppy zones and attempts to estimate the proceeding direction using a variety of methods. The methods used to calculate the estimate are user configurable.

CryptoScalper: NightMODE by BiO-618Hey guys!
It's me with a new version of the script.
Since a lot of people wanted to use it for scalping, I adjusted it for that.
More buy signals, more sell signals, 90% accuracy (at least ;) )
Remember to use the pivots to set Take Profits and Stop Losses, no software is 100% accurate, otherwise the market would trash it.
SELL SIGNALS
Red "S": Sell signal
Yellow "Sell": Strong+ sell signal
Orange "SELL": Strong++ sell signal. Shortable signal.
Red triangledown "SELL!": Strongest+++ sell signal, bearish divergences from MACD . Shortable signal.
BUY SIGNALS
Yellow triangleup "Weakening": Bear trend is getting weak, as the asset is getting oversold.
Green "BUY!": Strong buy, bullish divergence from MACD . Strongest buy signal.
Remember, again, to ALWAYS set your TP and SL beforehand. The key to be profitable is to act before the market acts.
It's better 3% in hand than 1% below your initial balance.
From a manual backtesting, I got a 53% profit on 2 weeks, trust my advice to manage the risk and you will be profitable aswell ;)
Check my other scripts to get more options :)
I also made a 4Hours and 12Hours optimized scripts, you might found that which one works better for your strategy, asset, and timeframe.

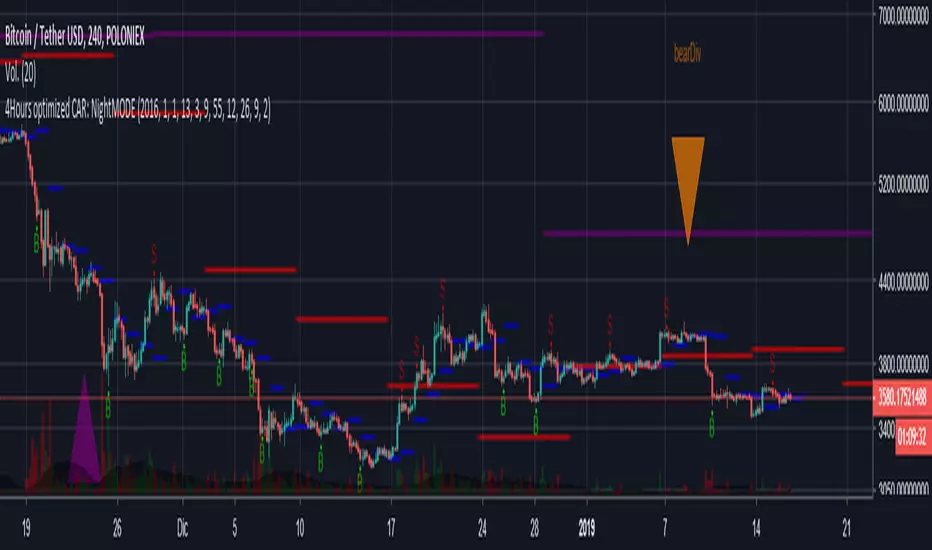
4Hours optimized CAR: NightMODEA night mode of my script.
Feel free to contact me with your suggestion, I'm working on the things people ask me more frequently.
Thanks and good profit!

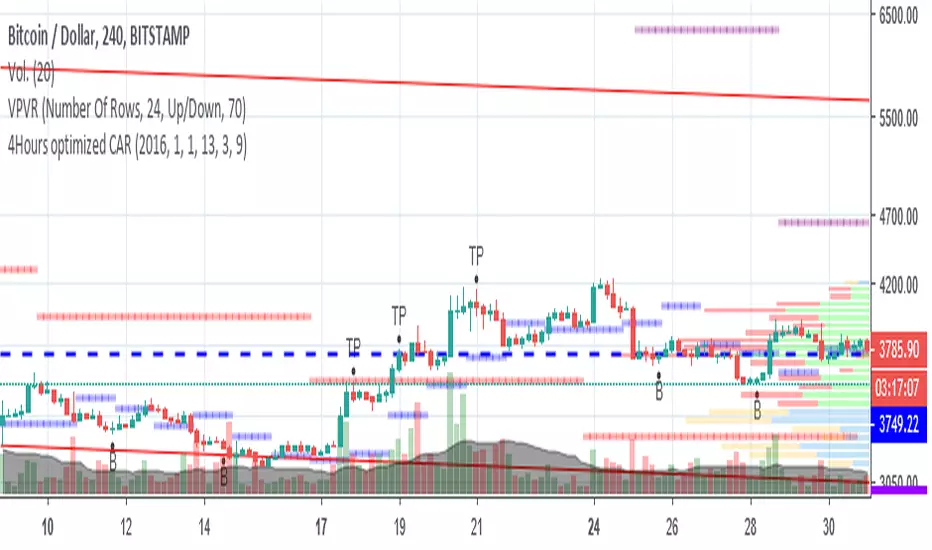
4Hours-optimized Crypto Alert ReloadedUPDATE:
*Added Pivot Levels for a better market lecture.
Advice, try to filter the early B signals by pivot strength.
Stay tunned!
Bull Bear Divergence IndicatorThe script is written for Constance Brown-like anayis with divergence signals between price and indicator (i.e. stock close / RSI divergence)
Note: Though the example here with NVDA shows good reversal predictions, best results generally are optained with un-normalized indicators and oscilators like CB#s comosite index.
(For Trading view written by LazyBear.) I use two different lines: an indi high line for baerish, and an indi low line for bullish divergences.
The script only shows divergences to pivot pairs next to each other, not between actual pivot and those "a few pivots ago"
For individual work, chose your indicator and replace rsi in line 10 with it, anything else is auto. Sript bottom: optional comparison lines addable.

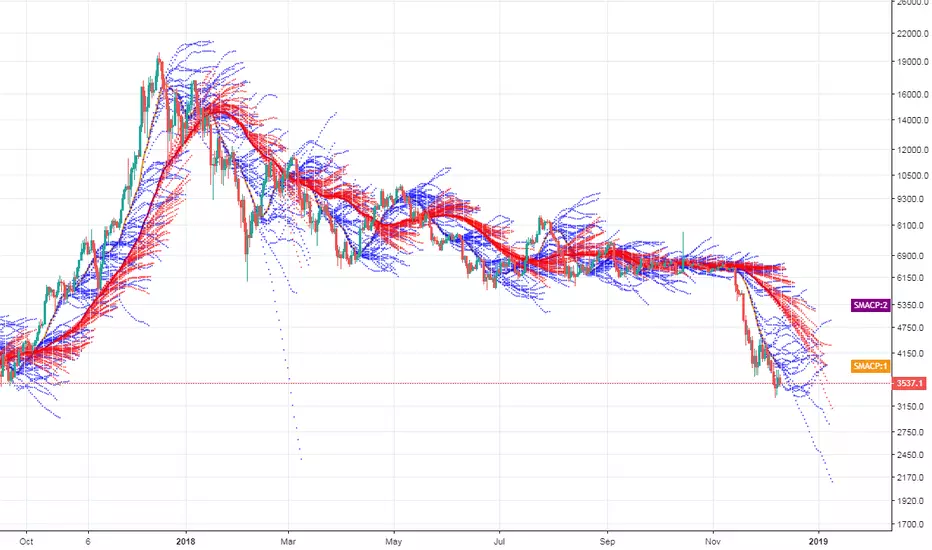
[RESEARCH] SMA Crossover PredictionHello traders and developers!
This "chinese dragon" indicator plots two SMA for the specified periods and their possible movements in the future using stochastic processes under the hood.
It's experimental and FREE because I haven't enough time to test it on each instrument and timeframe due to my main job (I'm really tired this year).
So, I invite you to become volunteers and test it. I will be glad to receive any feedback and suggestions from you.
If you want to try it out you can leave a comment or PM me to get access.
Good luck!
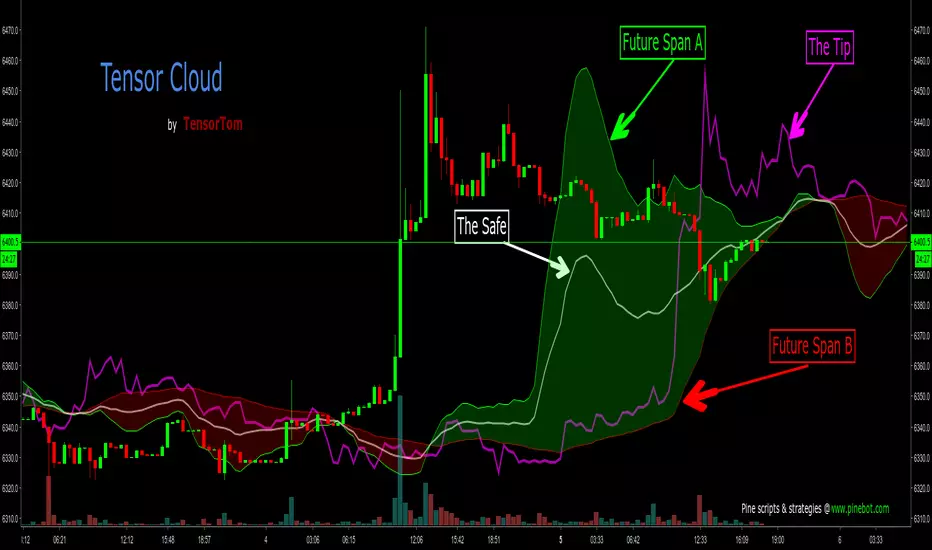
Tensor CloudIntroducing the Tensor Cloud. This is probably the best indicator I've come up with so far. I'm really proud of it. Ichimoku is a brilliant system. It's been around for over half a century and I praise Goichi Hosoda for his brilliant work. However, it's time for something new. I love math and this indicator really showcases that. The Tensor Cloud is an indicator of its own. It is not related to Ichimoku at all. The only thing they have in common is that they both form clouds. The maths in Tensor Cloud are 100% apart.
The Tensor Cloud is mostly comprised of some special forms of linear regression. Let's do a rundown.
Future Span A (Green)
This is one predictor using a linear regression technique. Future Span A is one of the two lines that makes up a Tensor Cloud. From here on out it will traditionally be colored green. It can be used as both a predictor on its own and comprising the Tensor Cloud. This can also be viewed as sort of a long signal when crossing up Future Span B. This line can also be used to help identify levels of support and resistance.
Future Span B (Red)
This is another form of linear regression meant specifically to work alongside Future Span A. This is the second line that comprises a Tensor Cloud. From here on out it will traditionally be colored red. It can be used both as a predictor on its own and comprising the Tensor Cloud. This can also be viewed as sort of a short signal when crossing down through Future Span A. This line can also be used to help identify levels of support and resistance.
Safe (White)
The Safe is a moving average taken of Future Span A and Future Span B. It is highly predictive. From here on out it will traditionally be colored white.
Tip (Fuchsia)
This is yet another form of regression and is highly predictive. The Tip can also be used to help judge trend strength and probability of reversal. More study is of course needed. More on that later in this description. From here on out it will traditionally be colored fuchsia. This line can also be used to help identify levels of support and resistance.
The Tensor Cloud
The space between Future Span A and Future Span B is shaded in green or red, depending on which Future Span is on top. If Future Span A is on top, the Tensor Cloud will be green. This is considered a long signal. If Future Span B is on top, the Tensor Cloud will be colored red. This is a short signal. Attention should also be given to other factors such as:
The position of price in relation to the Tensor Cloud (Under, inside or above).
The position of Tip in relation to the Tensor Cloud.
Crosses of Future Span A and Future Span B.
Tensor Twist
Whenever Future Span A and Future Span B cross (In either direction), this is called a Tensor Twist. If Future Span A is crossing up, this is a long Tensor Twist. If Future Span B is crossing up, this is a short Tensor Twist.
Closing Summary
Much study needs to be done. This is a brand new technique. It's up to all of you to help figure out the best ways to use it. I may still add other components to this indicator but it's pretty solid as is. You will notice that the two integer inputs are set to 27. Twenty-seven is a very important number in mathematics. The details of that are beyond the scope of this description but from here on out, the traditional setting for those will be 27. You will notice that I am not yet releasing the source code to this indicator. For now, it will remain protected. Once I have enough feedback and we're all happy with the final result, I will release the code for the world to have. I have no wish of keeping this closed-source (As profitable as that might be). I just want it to help as many people as possible.
Please share this on social media so we can attract as many testers to give feedback as possible. For publishing this for free, that's all I ask in return. That way it will be as solid as possible when I release the source code.
Enjoy!
Trend Precognition - Mtrl_ScientistHi everyone,
This is an updated version of my base algorithm "BTC Precognition". I've managed to remove some lag, while at the same time smoothing the curve (blue).
All you need to know about it is on the chart's legend. The arrows just correspond to the bottoms/tops of the blue signal curve (marked with green/red circles). However, predicting turning points is difficult and I'm still working on that. So for now, the signals are offset by 1 candle into the past. This means that all of your trades will be 1 candle late, unless you trade intrabar using your own intuition. As a help, I've also included the first derivative (black curve) that will tell you the slope of the blue curve. Remember, when the curve is about to turn, the slope becomes zero. However, you can anticipate this by looking at the slope's direction and guessing when it will cross the zero line.
This is still all work in progress, so invite-only.

acmillions88 HMCThis script works best on 1 minute timeframe,
while my DHC script works best in 1 hour timeframe.
Look at the chart. Be amazed. I'm amazed too.
Q: Why I created this script?
A: Rahmag found that my DHC V2 works only for higher timeframes, so he
suggested that I modify it for 1 minute timeframe.
Thanks Rahmag.
Cheers!

acmillions88 DHC V2Version 2 of my DHC script.
Sell1 - less probability but higher profit
Buy1 - less probability but higher profit
Sell2 - high probability but lower profit
Buy2 - high probability but lower profit

acmillions88 DHCThis script only works like a charm.
It gives very early signal and it is highly accurate.
Should be the most profitable script I have ever made.

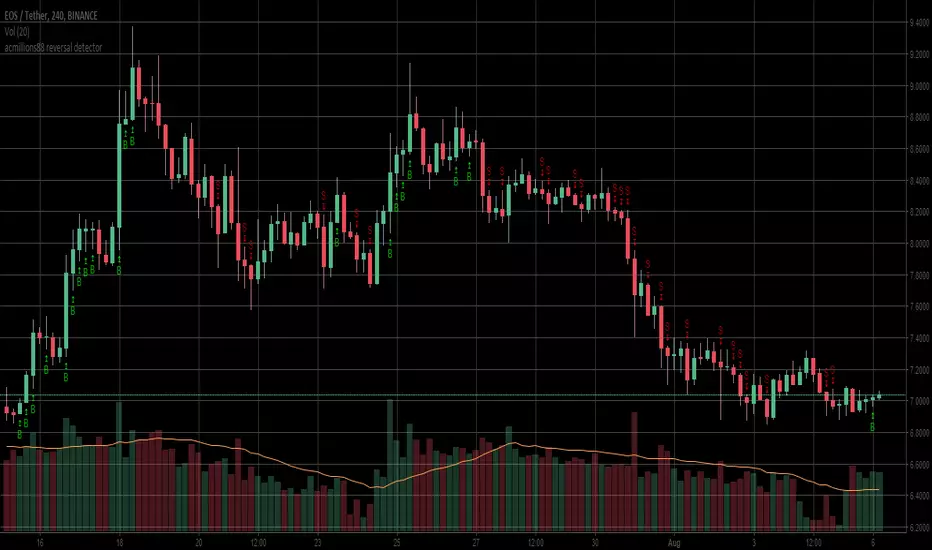
acmillions88 reversal detectorI use a new method to predict trend and made a reversal detector by accident.
Surprisingly, it works very well. More importantly, it is predictive! Hooray!!!
When u see a series of "B" and start seeing an "S", its time to sell.
When u see a series of "S" and start seeing a "B", its time to buy.
Cheers!
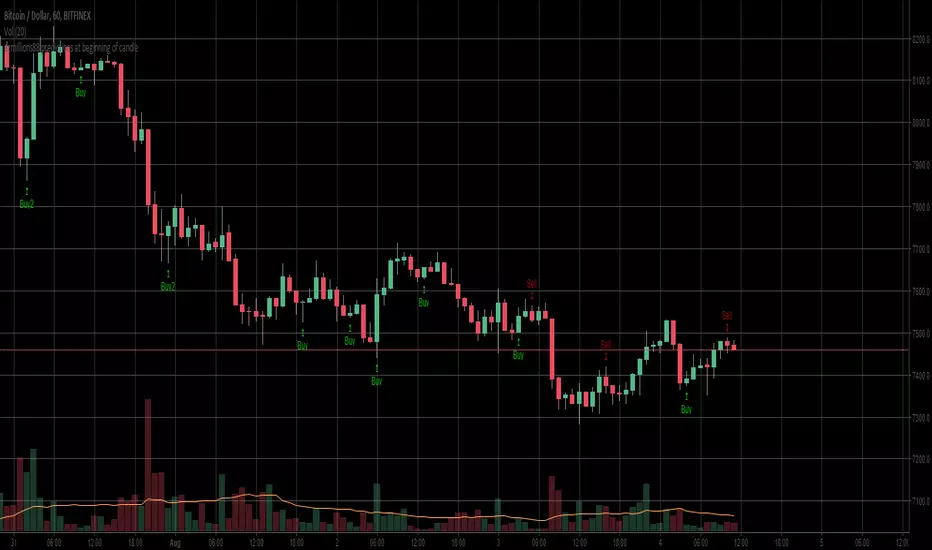
acmillions88 predictions at beginning of new candleJust made a new discovery so I made this script.
It does not depend on trend and it predicts the mini trend at the beginning of the new candle.
The success rate is quite high.
Yes, its another predictive indicator from me. Cheers.