Channel of linear regression of rate of change from the mean The indicator calculates the difference between the closing price and the average as a percentage and after that it calculates the average linear regression and then draws it in the form of a channel.
Preferably use it on 30 min or 15 min or 1 Hour or 2H time frames .
Exiting outside the upper or lower channel limits represents high price inflation, and returning inside the channel means the possibility of the price rising or falling for the average or the other limit of the channel.
Channel lines may represent places of support and resistance.
價格通道

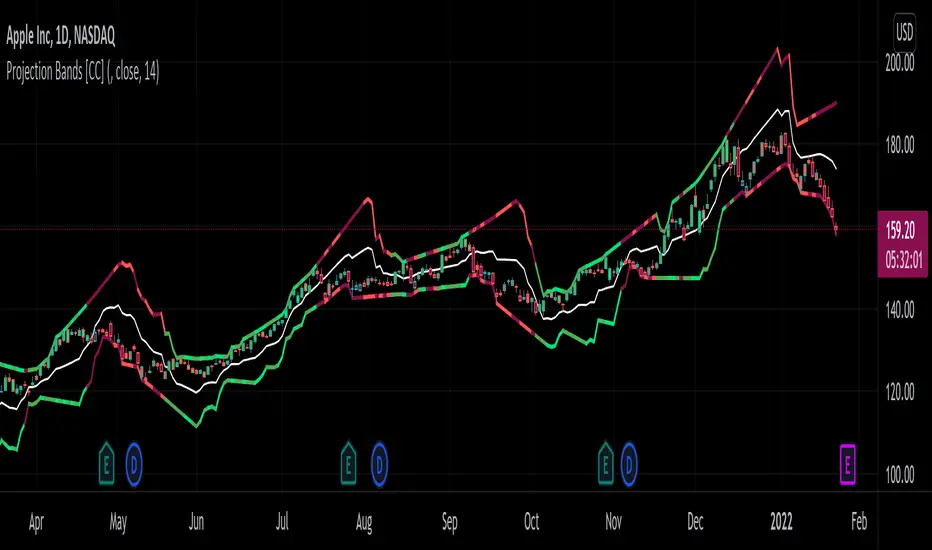
Projection Bands [CC]The Projection Bands were created by Mel Widner (Stocks and Commodities Jul 1995) and this indicator and the other two that rely on this one (I will publish them later) are very underappreciated in my humble opinion. The biggest strength of this indicator is the fact that it is a leading indicator for dramatic price movements. As you can see in my example chart it consistently gives great exit points before a downturn. I have included strong buy and sell signals in addition to normal ones so strong signals are darker in color and normal signals are lighter in color. Buy when the line turns green and sell when it turns red.
Let me know if there are any other indicators or scripts you would like to see me publish!
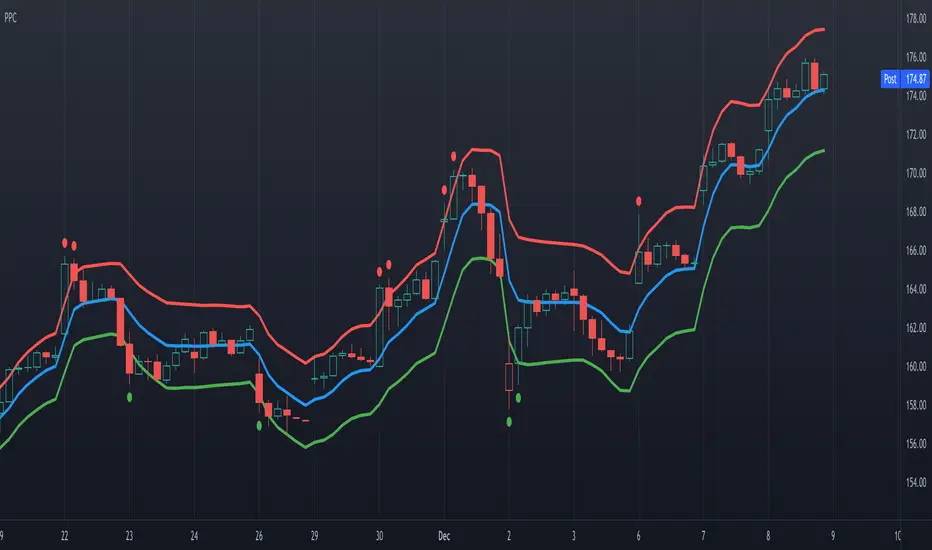
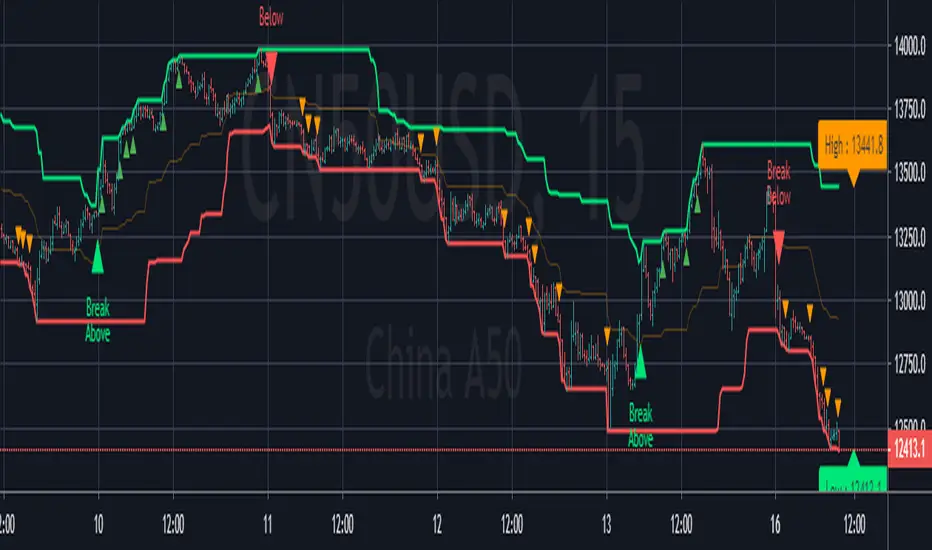
Precision Price Channel [AstrideUnicorn]Precision Price Channel (PPC) is a channel indicator based on advanced Kalman filtering. As one can see, the PPC channel is very narrow, but the price stays inside it with a very high probability. It is a precise model that shows the bounds for price swings in trending or ranging markets.
The indicator helps to determine optimal prices to enter a long or short trade. One can also use it for mean reversion trading when the market is in a range regime, just like other channel indicators.
How to use
The trader can use PPC in pair with their trading system to find the best price to enter a long or short trade suggested by their strategy.
For example, if you feel bullish about a market, you can enter a long position at the moment when the price crosses the bottom PPC line and leaves the channel. A green circle arrives below this candle, indicating the best price for a long trade. Such entry points ensure that you “buy very low” if the market will surge eventually.
If the trader thinks that the price of an asset is to decrease, they can wait for the indicator to show the best price for a short trade. The best moment to enter a sell position is when a candle breaks out of the PPC channel through the upper line. A red circle will show above such a candle.
In this use case, one should look at the red and green circles not as at signals that forecast the market will go up or down but real-time signals showing that now it is the best price to enter a long or short trade.
One can also use the PPC indicator to get entry signals. If the market is in a range regime, the red and green circles give mean-reversion signals for short-term trades inside the range.
The price crossing the blue middle line can serve as a signal to enter a trend.
The PPC indicator is auto-adjustable and does not have any user settings.
Donchian Channel Strategy [for free bot]
I present to you a script for testing the Donchian channel breakout strategy for the Binance_exchange.
This strategy is trending, and is especially effective for trading cryptocurrency futures.
This strategy is very flexible, and you can configure virtually all possible parameters, moreover, separately for longs and separately for shorts.
In the script, you can configure the parameters of the channel for entry and exit, the exit method, enable or disable purchases / sales, specify take profit and stop loss, and more.
On the example of optimization, only 20% of the deposit is used. This is done for diversification, since there are 37 contracts on binance_futures (at the time of writing the script description). That is, by optimizing the parameters for different currencies, you can very well reduce risks.
Представляю Вам скрипт для тестирования стратегии пробоя канала Дончиана для биржи Бинанс.
Данная стратегия относится к трендовым, и особенно эффективная на торговли криптовалютных фьючерсов.
Данная стратегия очень гибкая, и можно настроить фактически все возможные параметры, при чем, отдельно для покупок и отдельно для продаж.
В скрипте можно настроить параметры канала на вход и на выход, метод выхода, разрешить или запретить покупки/проаджи, указать тейк-профит и стоп-лосс и другое.
На примере оптимизации используется всего 20% от депозита. Это сделано для диверсификации, так как на фьючерсах бинансе присутсвует 37 контрактов (на момент написания описания скрипта). Т.е., оптимизировав параметры под разные валюты, можно очень хорошо снизить риски.

Donchian Channel CloudsFor this indicator, I got inspired by this paragraph in an article on Investopedia:
"Donchian channels also make natural partners with another moving average indicator for a crossover strategy. The Donchian moving average middle line is likely to form the short-term average in these situations, although some have used a 20-day Donchian channel in conjunction with a five- or 10-day channel to exit a position before a consolidation eats into short-term profits."
The default is a 20-period Donchian channel with the middle line from a 10-period channel superimposed on it. Red for 20, green for 10. When 10 is over 20, the cloud between them is green; the cloud is red when 20 is over 10.

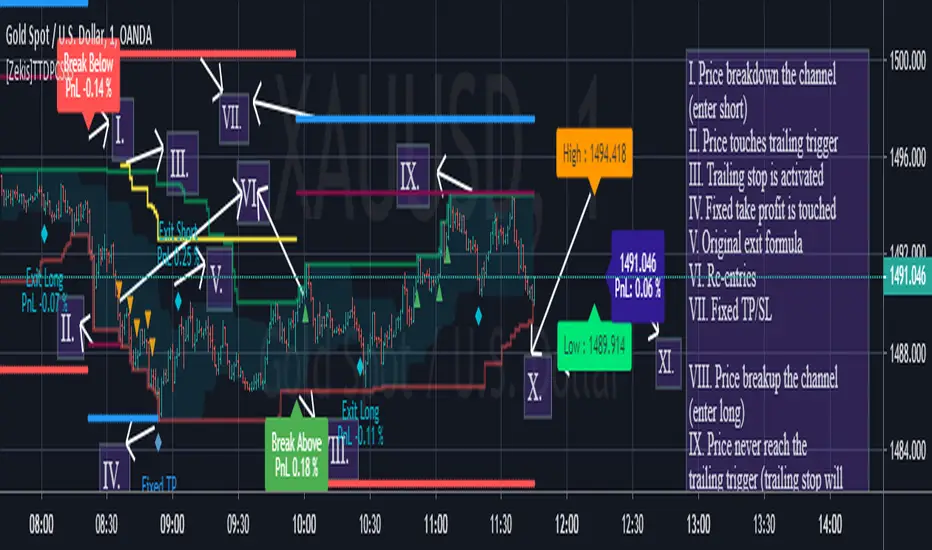
[Zekis]Turtle Trading Donchian Price Channels StrategyOne of the most famous strategy in the history of trading, #Turtle strategy have numerous legends, one of them is using Donchian Price Channels with 55 period for entries and 20 period for exits.
Can be used with any time frame
Added alerts
I added re-entries and re-exits for more scalps or for laddering trading.
Also you can modify parameters for entries and exits for your market needs.
Trade safe!
@Zekis
[Zekis]Donchian Price Channels Strategy with AlertsClassic Donchian(Price) Channels, I added alerts for entries and re-entries and labels for upper and lower bands of the channel.
# Investopedia
" What are Donchian Channels?
Donchian Channels are three lines generated by moving average calculations that comprise an indicator formed by upper and lower bands around a mid-range or median band. The upper band marks the highest price of a security over N periods while the lower band marks the lowest price of a security over N periods. The area between the upper and lower bands represents the Donchian Channel.
The indicator seeks to identify bullish and bearish extremes that favor reversals as well as breakouts, breakdowns and emerging trends, higher and lower.
The Formula for Donchian Channels Is:
UC = Highest High in Last N Periods
Middle Channel=((UC−LC)/2)
LC = Lowest Low in Last N periods
where:
UC = Upper channel
N = Number of minutes, hours, days, weeks, months...
Period = Minutes, hours, days, weeks, months...
LC=Lower channel
What Do Donchian Channels Tell You?
Donchian Channels identify comparative relationships between current price and trading ranges over predetermined periods. Three values build a visual map of price over time, similar to Bollinger Bands, indicating the extent of bullishness and bearishness for the chosen period. The top line identifies the extent of bullish energy, highlighting the highest price achieved for the period through the bull-bear conflict. The center line identifies the median or mean reversion price for the period, highlighting the middle ground achieved for the period through the bull-bear conflict. The bottom line identifies the extent of bearish energy, highlighting the lowest price achieved for the period through the bull-bear conflict.
Limitations of Using Donchian Channels
Markets move according to many cycles of activity. An arbitrary or commonly used N period value for Donchian Channels may not reflect current market conditions, generating false signals that can undermine trading and investment performance
"
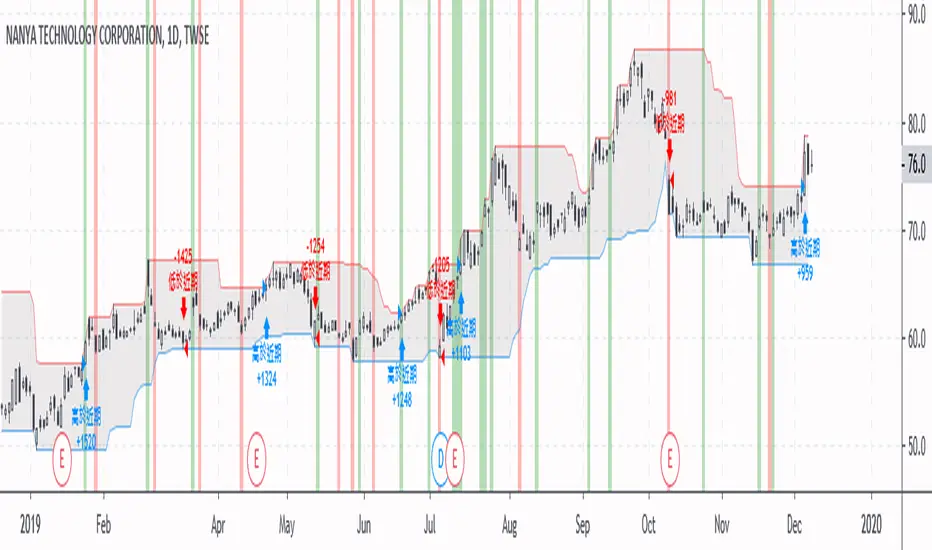
[LunaOwl] 樂活投資:價格通道 (LOHAS Investor - PriceChannel)- Introduction -
Price channel is an ancient strategy, which is very convenient for office workers. since most people no time do it.
so they are suitable for simple strategies. There are several conditions to become a "LOHAS Investor" -
價格通道是很老的投資策略,對於肯做功課的上班族來說非常方便,而且多數人沒時間操作。
如果要當「樂活投資人」有幾點條件:
1) set moderate ROI expectations.
- 設定溫和的投資報酬率期望。
2) use appropriate stock selection methods to build portfolios and reduce single error rates.
- 使用適當的選股方式建立投資組合,減少單一股票失誤率。
3) simple trade strategy, executed regularly.
- 使用簡單的策略規律執行。
4) wealth accumulates over time and learns every day.
- 財富依靠時間積累,每天勤學新知。
Dynamic Price ChannelsThis indicator plots dynamic price channels based on the security highest close and lowest open.
The default is to display 8 core channels (with the option to plot the sub channel lines, off by default).
It’s simple really—this just divides the price action into equal channels. I’ve found this pattern helpful across all markets.
It’s dynamic because if a new high close or a new low close is created the all channels will adjust.
The key levels are 75% (blue), 50% (aqua), 25% (blue).
In between those key levels is a level separator.
The high close and the low open are both red.
These can all be customized in the settings.
What you’ll typically see at these channel boundaries are price slow downs, reversals, support and resistance.
Turning on sub-channels will provide further channel plots. On these sub-channels you’ll also see the same type of price action activity as mentioned above.
I’ve developed a trading system where this indicator helps identify key pivot areas. Combined with a few other indicators and key EMAs this trade system provides high probability trades around these key channel areas.

Stochastics_&_AlertOscillator analyzes long and short distance trading.
Alert - when the signals of the beginning of both distance trades coincide in their direction.
Oscillator universal, changing the settings it can be used in different markets and with different timeframes.

Iron Trader of BiznesFilosofThis indicator is intended for those who have nerves of steel and trades for a long time. You can change the settings for other tasks, but the goal was different.
If the "Turn Line" is above the baseline, then the market mood is long. This is also indicated by an arrow and signed. If the "Turn Line" is below the baseline, then the market mood is short. This is also signed and indicated by the arrow.
If the private trend changes, then the "Turn Line" color to another (red to green and green to red). This is a signal to close a position.
In more detail about the indicator on my channel in YouTube.
===
Этот индикатор предназначен для тех, кто имеет стальные нервы и торгует долго. Можно изменить параметры и для других задач, но цель была другая.
Если "Линия Переворота" выше базовой, то настроение рынка - лонг. Также это показано стрелкой и подписано. Если "Линия Переворота" ниже базовой, то настроение рынка - шорт. Это тоже подписано и показано стрелкой.
Если меняется частный тренд, то цвет "Линия Переворота" на другой (красный на зеленый, а зелёный на красный). Это сигнал для закрытия позиции.
Более подробно про индикатор на моём канале в Ютуб.

Abramov_V4First of all for binary options
Multi currency
Timeframe 5 minutes +
Volatility - not lower than average
This indicator includes:
1. Bollinger waves of 3 levels - on / off
2. Moving averages 2 pieces - on / off
3. Price channel - on / off
4. Day and resistance level support - on / off
5. Main support and resistance level for 120 minutes - on / off
6. Areas of RSI overbought / oversold in the form of arrows.
Any of the indicators is configurable.
The optimal settings are set by default.
This indicator is suitable for several strategies.
Access on request.
When working with this indicator, it is necessary to avoid news and sudden jumps in the market

Abramov_V3 + MA + Price Channel + Sup_Res_level + B_bandsPrimarily for binary options
Multicurrency
Timeframe 5 minutes +
This indicator includes:
1. Bollinger waves 3 levels - on / off
2. Moving averages 2 pieces - on / off
3. Price channel - on / off
4. Day support and resistance level - on / off
5. The main support and resistance level for 120 minutes - on / off
Any of the indicators is configurable.
The optimal settings are made by default.
This indicator is suitable for several strategies.
Access on request.
I separately recommend the indicators:
1. Abramov_RSI (my script)
2. Lin reg (2, -2, 100, close)
When working with this indicator, it is necessary to avoid news and sharp surges in the market
For access, write to me in private messages

Price Action Channel Master by JustUncleLThis indicator combines a number of PAC types into one indicator and will replace some of my previously PAC scripts (some were not published).
It draws a Moving Average (MA) channel based on various boundary criteria. Even though the MA choices are not limited to SMA and EMA, these would be the your first choices with most PAC requirements, feel free to experiment though.
Optional Bar colouring around that channel.
Options Available:
(1) Select between 11 different types of moving averages for the base (centre) MA line choices are :
SMA = Simple Moving Average (default)
EMA = Exponential Moving Average.
WMA = Weighted Moving Average
VWMA = Volume Weighted Moving Average
SMMA = Smoothed Simple Moving Average.
DEMA = Double Exponential Moving Average
TEMA = Triple Exponential Moving Average.
HullMA = Hull Moving Average
SSMA = Ehlers Super Smoother Moving average
ZEMA = Near Zero Lag Exponential Moving Average.
TMA = Triangular (smoothed) Simple Moving Average.
(2) Select Channel Boundary Criteria:
HILO = Channel boundaries based on High and Low MAs (default).
ATR = Channel boundaries are Multiplier * ATR distance from base line
PIP = Channel boundaries are Multiplier * PIPs distance from base line
STDEV = Channel boundaries are Multiplier * StdDev(price) distance from base line (this is the same as Bollinger bands if SMA is the base MA)
KC = Channel boundaries are Multiplier * StdDev(True Range) distance from base line (this is the same as Keltner channel if SMA is the base MA)
(3) Option to display coloured Candles around the Ribbon, the colouring uses the Default candle 3-tone colour scheme:
Lime = candle closed above Ribbon.
Red = candle closed below Ribbon.
Gray = Candle Closed inside Ribbon.
The Grab candles 6-tone colour scheme:
Lime = Bull candle closed above Ribbon.
Green = Bear candle closed above Ribbon.
Red = Bull candle closed below Ribbon.
DarkRed = Bear candle closed below Ribbon.
Aqua = Bull candle closed inside Ribbon.
Blue = Bear candle closed inside Ribbon.

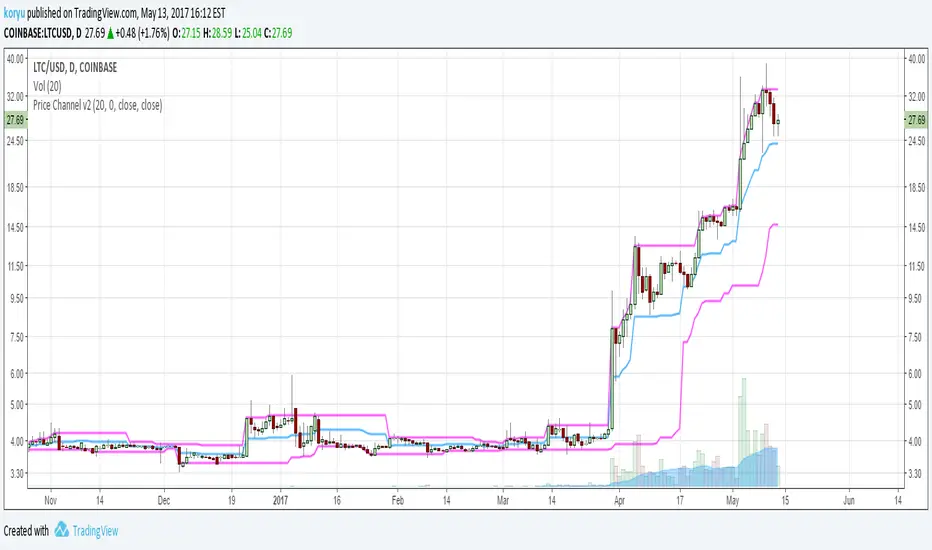
Price Channel v2Added parameters for source of highest and lowest line.
It's usefull for ultra volatile markets like cryptocurrencies and penny stocks. Using close price as source helps to filter out false breakout signals in turtle trading strategy.
SUPER SUPERTREND THREE LINE PROFIT STRATEGY//1.Buy when all three lines are become Red to Green or yellow and cover the position even one green become Red line next
//2.Sell when all the three line are become red and cove the position even one line become red to Green or yellow.

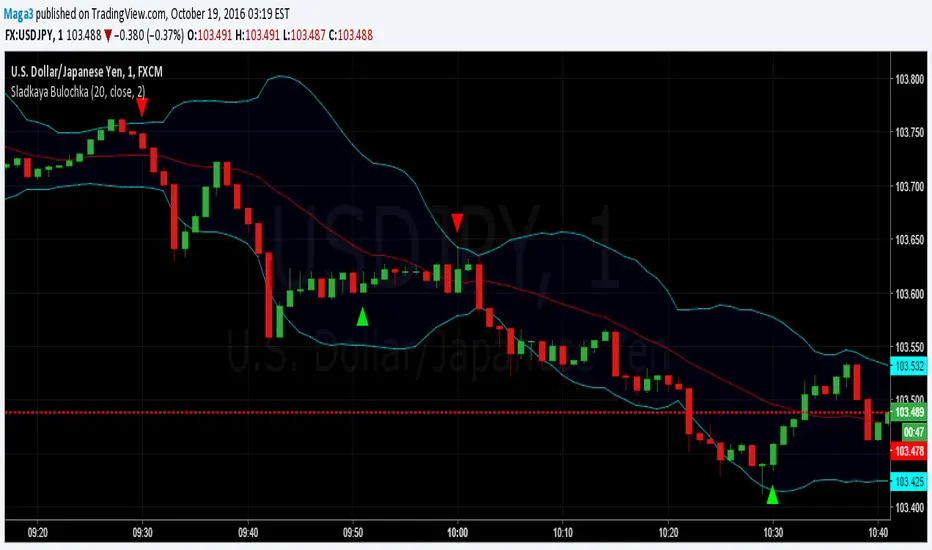
Sladkaya BulochkaAccording to the statistics of Thomas Bulkovski collected over several years on the 1-minute chart (21 million candles), there is a statistically significant periods, where the higher the probability of reversal rates on short-term timeframe.
By reversal, on average, had in mind the movement to 5 candles.
This three periods, they remain unchanged, depending on the hour:
- the first minute of each hour (10:01, 11:01, etc.)
- the first minute after the hour (10:31, 11:31)
- 51 minutes each hour (10:51, 11:51)
------------------------------------------------------
По статистике Томаса Булковски, собранной за несколько лет на 1-минутном графике (21 миллион свечей), есть статистически значимые периоды, где более высока вероятность разворота цены на краткосрочных ТФ.
Под разворотом, в среднем, имелось в виду движение на 5 свечей.
Это три периода, они неизменны в зависимости от часа:
- первая минута каждого часа (10:01, 11:01 и т.д.)
- первая минута после получаса (10:31, 11:31)
- каждая 51 минута часа (10:51, 11:51)
Traders Dynamic Index Indicator Alert v0.1 by JustUncleLThis is a trend trading indicator+alert utilising the Traders Dynamic Index (TDI), Price Action Channel (PAC) and Heikin Ashi candles.
About 6months ago I came across the use of TDI in "E.A.S.Y. Method" that I found in forexfactory forums: www.forexfactory.com
and I was able to set up a chart based on the specifications by using Kurbelklaus scripts. However, I found that the alerts were being generated one or two bars too late, so at that time I was not successful using it with Binary Options. A few months later I found a variation of the method in the forecfactory forums which is able to generate the alerts a bit earlier, so this indicator is a modification of that early detection version.
The indicator can optionally use Heikin Ashi candles only for all it's calculation. I would recommend viewing the chart with Heikin Ashi candles, these smooth out the trends and makes trends very clear.
I found that this method it works good with most currency pairs or commodities and with 5min+ timeframe charts. I would suggest expiry of 2 to 6 candles.
ALERT GENERATION:
=================
The TDI (Traders Dynamic Index)
---------------------------------------------
Volatility Band VB(34), color: Blue, buffer: UpZone, DnZone
Relative Strength Index RSI(13)
RSI PRICE LINE (2), color: Green, buffer: mab
RSI TRADE SIGNAL LINE (7), color: Red, buffer: mbb
MARKET BASE LINE MID VB(34), color: Orange, buffer: mid
Indicator SignalLevels:
-------------------------------
RSI_OversoldLevel : 22 (normally: 32)
RSI_OverboughtLevel : 78 (normally: 68)
Alert Conditions:
-----------------------
Strong Buy : yellow
Medium Buy : aqua
Weak Buy : blue
Strong Sell : fuchsia
Medium Sell : purple
Weak Sell : black
Hints on How to use:
----------------------------
- When a Medium or Strong alert is generated and MACD histogram colour matches the direction
of the alert (optional auto filter), then place trade in direction of alert candle and MACD.
- I use the multi-Hull MA's for overall trend direction confirmation.
- Best positions normally occur near the MACD(5,15,1) Histogram crossing the zero line.
- The optional coloured Dots along the bottom of the indicator represent the first alert
of this type that was generated in this sequence.
- It is advisable to trade in the direction of the main trend as indicated the HULL MA red cloud:
if red cloud underneath PAC then BULLISH trend, if red cloud above PAC then BEARISH trend.
- Selecting the HeiKin Ashi candles does affect the MACD and MA caculations, so if you select
normal candles the result chart will change. You can still Optionally select to use Heikin Ashi
for calculations.
- When using the Heikin Ashi candles, a good buy entry is indicated by long top wick and no bottom wick
for bull (green) candles and good sell entry is indicated by long bottom wick and no top wick for
bear (red) candles.
- When the MACD histogram is flat and close to zero line,
this indicates a ranging market, do NOT trade when this occurs.
- When the PAC channel on the main chart is spread apart widely, this is an indication
of extreme volatility and choppy chart, do NOT try to trade during these periods.
A choppy chart is also indicated by Heikin Ashi candles with long wicks on both sides
of the candles.
- You can specify what strength level Alerts are generated (default 2):
Level (1) means only generate Strong Alerts only.
Level (2) means generate Strong and Medium Alerts.
Level (3) means generate Strong, Medium and Weak Alerts.

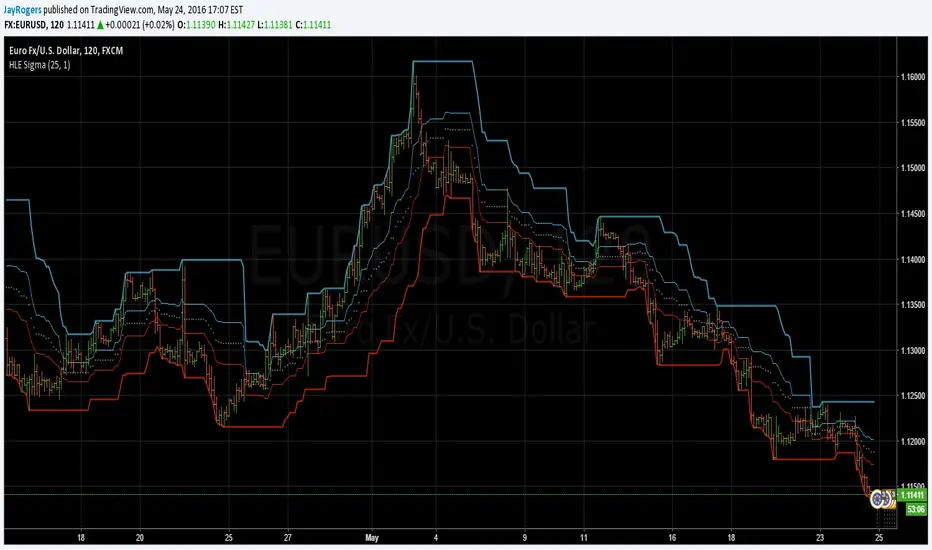
High Low Envelope SigmaDescription:
High and Low Envelope channel with median line and 'sigma' offsets to try and encapsulate price flow and quickly locate likely areas of support and resistance on the fly.
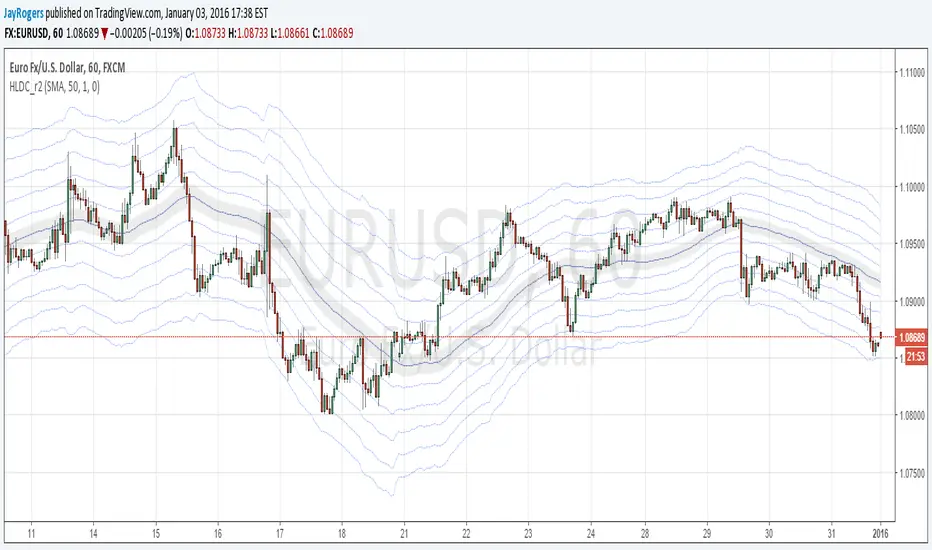
High-Low Difference Channels r2About:
I developed the original as an experiment to potentially replace or augment my BB and RSI based strategies. After some back-testing I could see some really interesting results but it wasn't quite where I wanted it, so after some tweaking and further back-testing, and adding in more MA options, here we are. Mostly tested on 1h and greater time-frames using default settings.
Description / Usage:
Adjust length and multiplier much the same way you would expect with Bollinger Bands.
Multiplier of 1 gives you a base channel consisting of one high, and one low sourced MA
The outer channels are increments of the base high-low channel width, away from the hl2 sourced MA
r2 Changes:
Increased amount of up/down channels to 5, and lowered multiplier default to 1 (previously 1.5)
Tweaked default colour scheme.
Pick your MA poison of choice! Added choices for all your common MA variants.
Issues:
VWMA bugs out and refuses to draw sometimes - no idea why.
Additional Notes:
All MA variants available in this script were derived directly from the sources of those available within the pine editor. I have been fairly diligent trying to ensure they all function correctly, but I can't 100% guarantee it, so if anyone gives the script a try, or dives into the code and see's something odd - don't hesitate to let me know!
It would also be fantastic to hear feedback from anyone who finds use for this, to augment an existing strategy/idea, or develop something new. :)
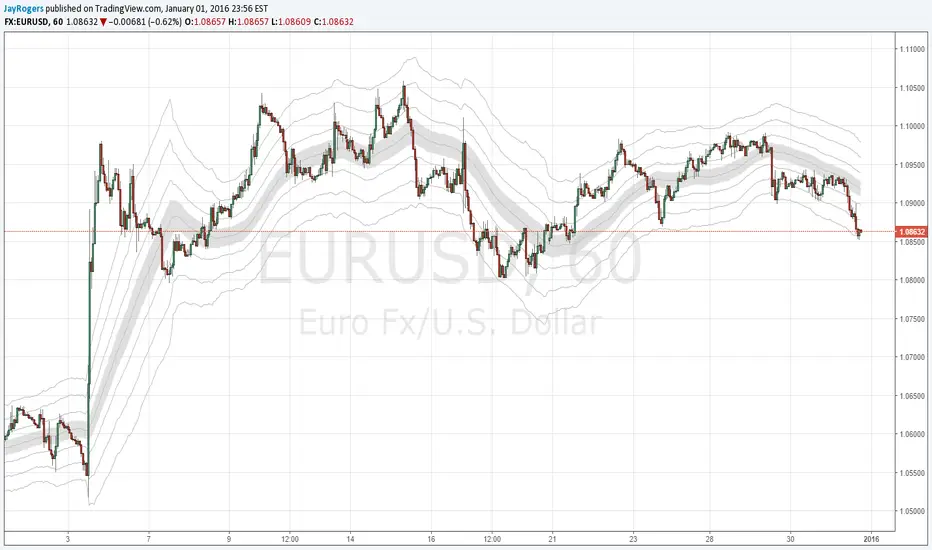
High-Low Difference Channels - SMA/EMAI wrote this up as a potential replacement for my BB based strategies, and so far it's looking pretty nice.
Description / Usage:
Adjust length and multiplier much the same way you would expect with Bollinger Bands.
Multiplier of 1 gives you a base channel consisting of one high, and one low sourced SMA (or EMA)
The outer channels are increments of the base channels width, away from the median hl2 sourced SMA (..or EMA)
MA_FibBand_MTFMoving average of High, Low & Close with Fibonacci bands calculated from the average high and low. Four upper levels are to the power of 1.618, 2.618, 3.618 & 4.618. Four lower levels are to the power of 0.618, 1.618, 2.618 & 3.618. Included are a choice of time frames either current, semi-custom or fully custom allowing freedom to set any period you like which makes it great for historical averages. Adapted and expanded from Clarke Moody's MA_MTF i have tidied the script and included all CM's formulas although should be used in SMA or EMA i kept the other MA formulas for curiosity.
My preferred usage is to stick with 20ma and adjust the legnth of the period. Shown here is 20ema of 10day period.
More information can be learnt from 'endlessmountain' on youtube but only the very top and bottom levels are used with the High, Low & Close. Also i am not aware if this originates from any other source.
Thankyou to Clarke Moody and endlessmountain. Hope you like this tool.

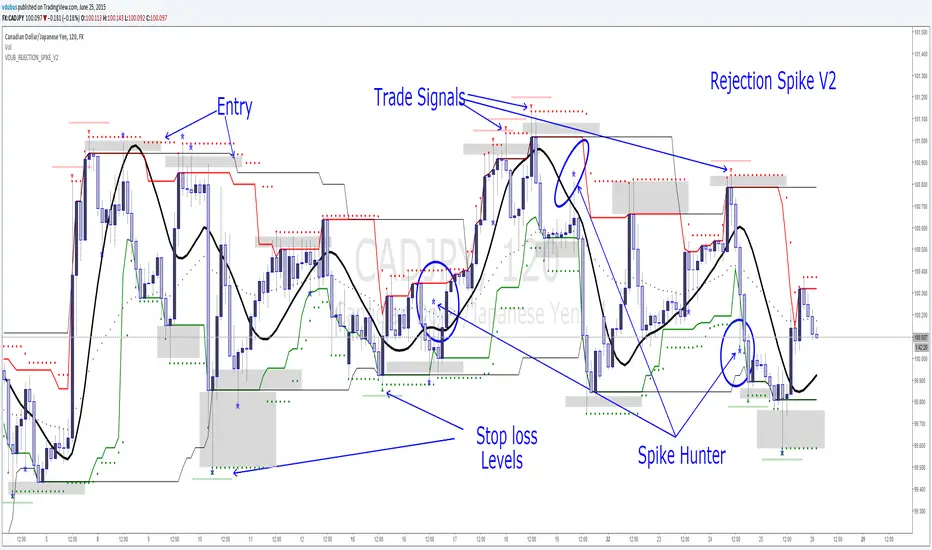
VDUB_REJECTION_SPIKE_V2VDUB_REJECTION_SPIKE_V2
Works on all time frames, Tested on 1min, I can't make it any faster
Hull MA
channel
channel 2
Pivot Channel
{RS} spike hunter
Modified Fractals V2