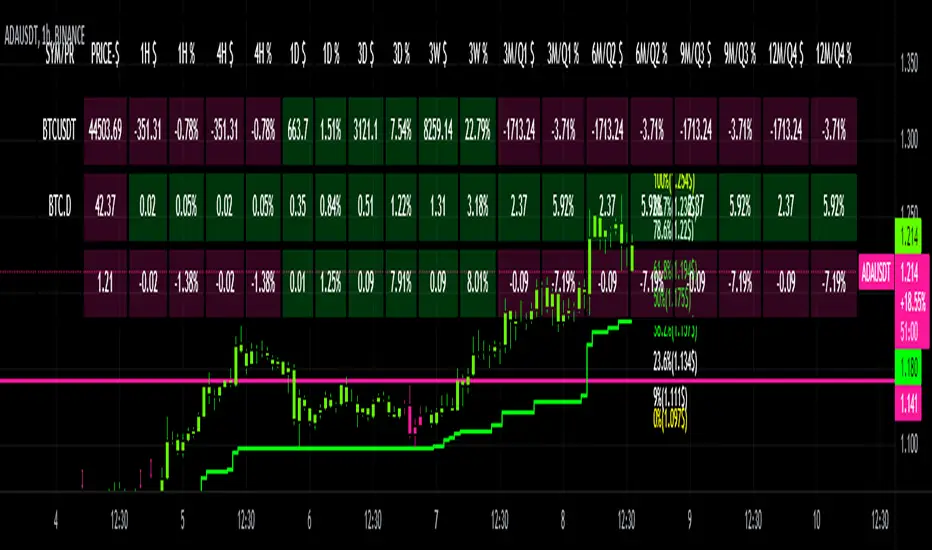
CRYPTO DASHBOARD Gs₿A Simple Crypto Dashboard/Screener which indicates the Price and percentage changes for the Given Period of time i.e for 1 Hr ,4 Hrs, 1 Day, 3 Days, 3 Weeks and 3 - 12 Months. By Default it displays #BTC and its Dominance and current trading pair Price and % changes.
Pricechart
MACD BandsThis is MACD indicator on the price chart. You can read the same information as the original MACD but much more.
You can use it the same way as MACD but it won't use any space below your chart. Also you can use signal line and cloud as trend confirmation: e.g. if above them it can be a stronger uptrend.
The signal line (yellow by default) can be used as a support-resistance line.
If teal line is above maroon line, MACD is positive, otherwise it is negative
MACD value is the width of the cloud
Cloud color is green when MACD histogram is positive, red if negative
You can change MA types
MACD and histogram values can be seen in Data Window
