• 產品
  • 社群
  • 市場
  • 經紀商
  • 更多
立即開始
  • 社群
  • /指標和策略
  • /Pricediference

Pricediference

Highs/Lows difference [OrganicPunch]Highs/Lows difference indicator 
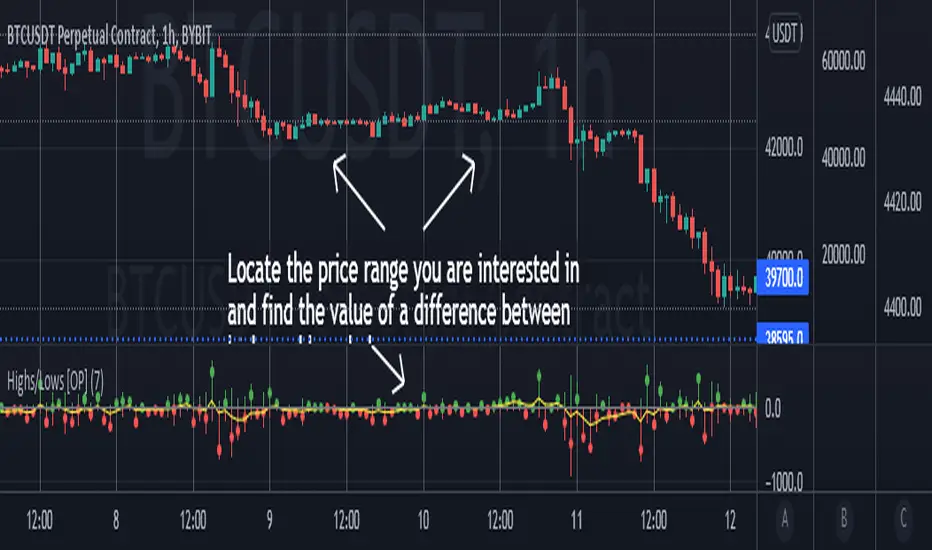
To visually evaluate the difference between highs and lows of a price range. This handsome indicator shows: difference between highs of 2 candles by displaying it in green histogram difference between lows of 2 candles by displaying it in red histogram difference between both highs and lows by displaying a circle at the level of the difference To read the numerical value, point at the circle of the relevant bar you are interested in, and see the scale. Indicator is useful in creating strategies where you want to filter out consolidations/ranges (or to locate them), e.g. "Open trade when H/L difference is larger than 200", or "Look for candles with H/L difference lesser than 50". The exact value of needed H/L difference can be found using this indicator.
Pine Script®指標
由OrganicPunch提供

選擇由ICE Data提供的市場數據。選擇由FactSet提供的參考數據。版權所有©2025FactSet Research Systems Inc.©2025TradingView, Inc.

不僅是產品
  • 超級圖表
篩選器
  • 股票
  • ETF
  • 債券
  • 加密貨幣
  • 加密貨幣對
  • CEX對
  • DEX對
  • Pine
熱圖
  • 股票
  • ETF
  • 加密貨幣
日曆
  • 經濟
  • 收益
  • 股息
更多產品
  • 殖利率曲線
  • 期權
  • 新聞流
  • Pine Script®
  • 精選股
App
  • 行動裝置
  • 電腦版
工具與訂閱
  • 功能特色
  • 價格
  • 市場數據
特別優惠
  • CME期貨
  • Eurex期貨
  • 美國股票包
關於公司
  • 我們是誰
  • 宣言
  • 運動員
  • 部落格
  • 職涯
  • 媒體工具包
商品
  • TradingView商店
  • 交易者塔羅牌
政策與安全
  • 使用條款
  • 免責聲明
  • 隱私政策
  • Cookies政策
  • 無障礙聲明
  • 安全漏洞
  • 狀態頁面
社群
  • 社交網路
  • 愛心牆
  • 推薦朋友
  • 網站規則
  • 版主
投資想法
  • 交易
  • 教育
  • 編輯精選
Pine腳本
  • 指標與策略
  • 大師
  • 自由開發人員
企業解決方案
  • 小工具
  • 圖表庫
  • Lightweight Charts™
  • 高級圖表
  • 交易平台
成長機會
  • 廣告
  • 經紀商整合
  • 夥伴計畫
  • 教育計劃
Look FirstLook First