Level LinesThis indicator displays levels in close proximity to the current price, enabling users to identify psychological levels on charts that serve as support/resistance zones or key reference points for price action.
In the settings, you can customize the number of lines shown above and below the current price, along with the interval size for rendering them.
As the price moves higher or lower, the lines dynamically adjust to reflect the most relevant levels.
In settings you can fully customize the style of lines (color, width, style) with separate settings available for lines above & below the current price.
Priceline

Manipulation Ribbon [FxScripts]Manipulation Ribbon
Designed to detect areas of price manipulation by Market Makers vs areas where it is trading in a natural, price-driven state. By identifying zones of control and imbalance, the ribbon provides a clear visualization of where price is being held or artificially displaced, offering key insights into potential future direction.
Indicator Function
Unlike traditional oscillators, the Manipulation Ribbon plots a continuous line or ribbon, with no defined y-axis. The ribbon dynamically adapts to market conditions, allowing the user to spot potential manipulation and price containment vs natural price movement.
Calculation Methodology
The Manipulation Ribbon is derived exclusively from price action. The underlying algorithm evaluates where price is, where it should be and where it’s being held.
The resulting ribbon reflects these dynamics in real time, providing a visual framework for interpreting price behavior at a granular level.
Operational Use: Divergences
The primary use of the Manipulation Ribbon is to locate divergences between price and the ribbon.
There are two distinct types of divergence to look for:
Price Containment: Where the ribbon moves but price doesn’t. This can help identify zones where price is being held, often preceding sharp movements once control is released.
Price Manipulation: Where price moves but the ribbon doesn’t. This can help identify liquidity sweeps, often preceding swift reversals once the liquidity has been taken.
Analytical Scenarios
High Liquidity Sweep: Price forms a higher high while the ribbon forms a lower high. Indicates a liquidity sweep may be occurring at the highs and a potential bearish reversal may be imminent.
Low Liquidity Sweep: Price forms a lower low while the ribbon forms a higher low. Indicates a liquidity sweep may be occurring at the lows and a potential bullish reversal may be imminent.
Top Edge Hold: Upwards movement of the ribbon without price followthrough. Indicates price may be being held at the highs, suggesting Market Makers are artificially holding price down in order to create a top edge and potential bearish reversal.
Bottom Edge Hold: Downwards movement of the ribbon without price followthrough. Indicates price may be being held at the lows, suggesting Market Makers are artificially holding price up in order to create a bottom edge and potential bearish reversal.
Settings
Guides: Option to have dynamic guides applied to your chart. Customizable style, color and width.
Guide Lookback: Due to the ribbon having a non-standard y-axis scale, it’s not possible to plot standard interval guides. Due to technical limitations this value is not calculable automatically either. The upper and lower bounds of the guides are therefore calculated using a user-inputted lookback function. In order to ensure the guides use the correct y-axis on the chart, simply input the average number of bars in your current viewport using the ruler, the guides will automatically update to match this.
Line 1 / Band 1: Option to turn on/off Line 1 and Band 1 alongside updating color and linewidth. Line 1 and Band 1 use the current chart symbol as their source.
Line 2 / Band 2: Option to add a second line and/or band to the chart. Use this to compare any correlated instrument e.g. BTCUSDT and ETHUSDT (as visualized in the chart above) or other pairs such as XAUUSD/XAUEUR or ES/NQ. Due to differences in y-axis scaling it's advised to add this as an additional indicator on a new pane (as per chart above).
Inverse Line 2 / Band 2: Option to show/hide the inverse of Line 2 and Band 2. This is useful for comparing inversely correlated symbols e.g. EURUSD and USDCHF.
Performance and Optimization
Backtesting Results: The Manipulation Ribbon has undergone extensive backtesting across various instruments, timeframes and market conditions, demonstrating strong performance in identifying where price is out of sync with its natural state. User backtesting is strongly encouraged as it allows traders to gain familiarity with the ribbon using their preferred instruments and timeframes.
Optimization for Diverse Markets: The Manipulation Ribbon can be used on crypto, forex, indices, commodities and stocks. The Manipulation Ribbon's algorithmic foundation ensures consistent performance across a variety of instruments. The lack of complex settings makes it easy for the trader to set up and go.
Educational Resources and Support
Users of the Manipulation Ribbon benefit from comprehensive educational resources and full access to FxScripts Support. This ensures traders can maximize the potential of the Manipulation Ribbon and other tools in the Sigma Indicator Suite by learning best practices and gaining insights from an experienced team of traders.

Implied Move with NASA Ideas & Price LineThis script allows you to customize the Implied Move Percentage and fully customize the way it is shown.
Can be used on any stock that has earnings and works based on the Implied Move (Percent).
Basically, it lets you visualize how the stock moved after reporting earnings and seeing if it reached the implied move or not.
This is helpful as it's important to know what earnings are worth keeping an eye on and which should be avoided.
There is also an added custom text input which was inspired to make from a frogman named NASA.
It lets you input whatever text you want on whatever price you want.
To summarize, it's basically a Post-It Note that you can add to any price level for any stock.
Alerts can be set if wanted, They can be alerted for the Implied Moves (If the stock price goes Above/ Below the set percentage) and NASA Ideas (if the stock price goes Above/ Below the set price).
There is also an added custom price line which is mostly for having a nonintrusive price line and label.
This price line and label can be switched to show the (Open, High, Low, Close, Extended High, Extended Low, Yesterday's Open, Yesterday's High, Yesterday's Low, and Yesterday's Close).

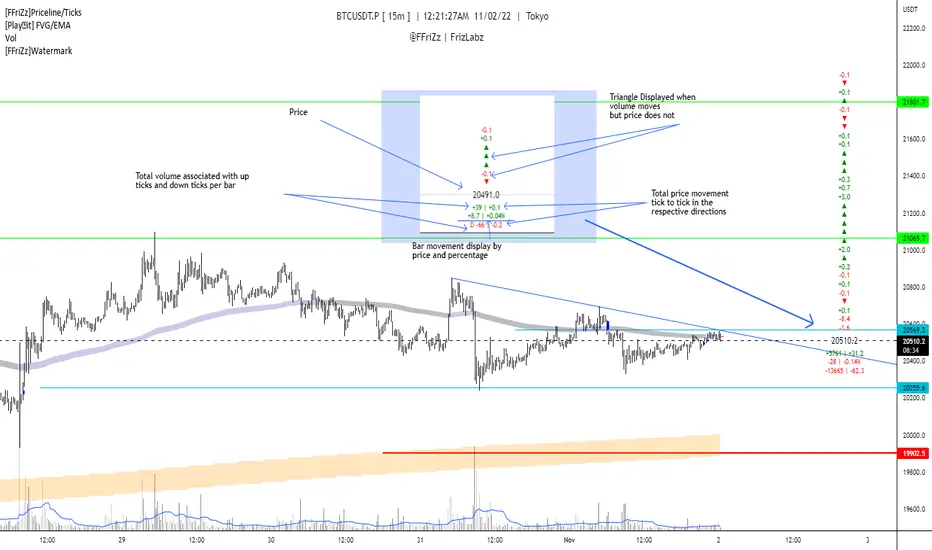
[FFriZz]Priceline/TicksFFriZz | FrizLabz -- Priceline/Ticks
Due to TradingView not allowing us to change the size or style of the Priceline I decided to make this
You can change the style, size, color of the Price line with this Script
There is also an option for the closing price to be plotted on the Priceline
-- Colors --
You can have the Line and/or the Closing price change colors with the price movements
both are adjustable to your preference
-- Ticks --
Will show the difference in price from tick to tick
when Volume moves but price doesn't it will show '▲▼'
-- Adjustments --
The offset of the Close and Ticks can be adjusted from left to right
Can Extend Priceline in all directions
Can change the Line style and Width
Can change all the Text sizes and Colors
Can also Change Colors to change with Price movements
Can Change number of Ticks to show
-- Priceline --
You don't have to but I suggest going to the settings of your Chart and turning off the Priceline
-- Challenge --
There is Some code at the bottom that will move the Label and Ticks to the x% of your screen in from the right once
the last bar is no longer visible. I decided not to use it because even when the feature is turned off any movement of the
chart resets the Ticks. If you find out a way to have it not reset the Ticks Let me know!
If you find any bugs or have any suggestions feel free to DM me or leave a comment!
Hope you Enjoy! -- FFriZz | FrizLabz
Price Line Extended to the Right with Price Label | by Octopu$🔖 Price Line Extended to the Right with Price Label | by Octopu$
This is an Add-On customization tool for your Chart Price Level.
Tired of having the TradingView's priceline all across the Chart?
And not having the Option to turn it off/extend to right only?
Worry you not. Got solutions for any problems you may have!
As well as many arms.
This Indicator provides an extended price line to the right only,
Starting from the current candle, towards the price levels.
Additionally, provides a quick price label for fast reference.
You can turn on/off the line,
As well as on/off the label.
Colors change according to candle direction:
Up/Down matching Green/Red.
Please remember to turn OFF TradingView's price line.
Otherwise it'll overlap. Price Line/Tag "replaces" that.
Works in Any Time Frame.
On Any Ticker.
(Using ES 5m just as an example:)
www.tradingview.com
SPY
Features:
• Price Tag
• Price Line
• Extend to Right
• Automatic color change
Options:
• Toggle On/Off Price Line
• Toggle On/Off Price Tag
Notes:
v1.0
Indicator release
Changes and updates can come in the future for additional functionalities or per requests.
Did you like it? Boost it. Shoot a message! I'd appreciate if you dropped by to say thanks.
- Octopu$
🐙

Fast ROI checker 50% Gann RetracementThis script is based on the Gann's 50% Retracement rule.
First, the ATH (All Time High) and ATL (All Time Low) are calculated; then, the 50% retracement level is found.
With this 50% level, we'll calculate the maximum price entry to keep a ROI which is set in the parameters.
For exemple, I only want to buy assets which can make a x16 before the 50% retracement , the script will calculate the maximum entry to respect this ROI .
If the Max entry price is above the ATL , the line will be green; if not, the line will be red.
To faster the search in the watchlist, when the price is between the Max Entry line and the ATL line, the background is painted in green.
It's not an investment strategy, you have to find your proper indicators to make purchases.
Enjoy !

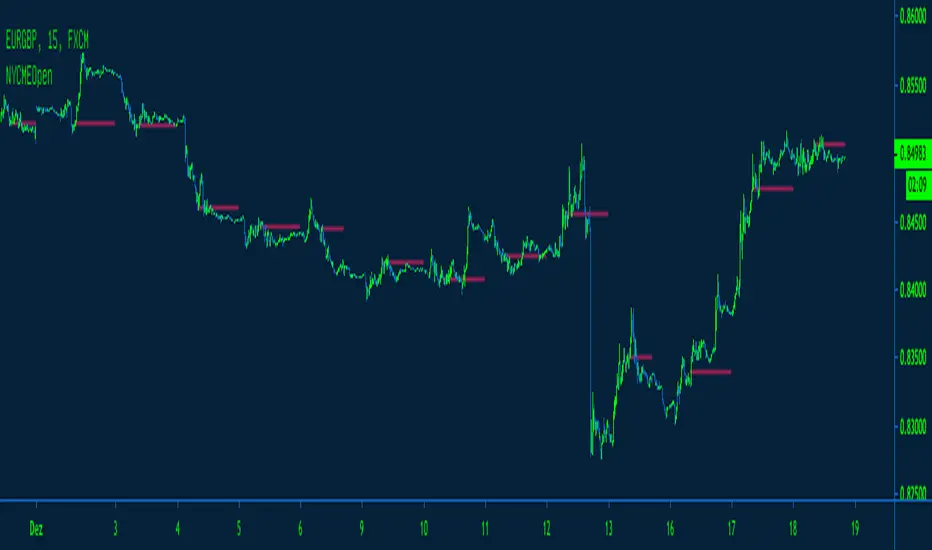
VapeundTrade - CME Open PricelinePlease use New York Timezone for it.
Usable from m1 - m15 Timeframe
Please change the Style of the plotted timeline to "Line with breaks"
DH: True-Price DOTS for Heikin AshiTrue-Price DOTS for Heikin Ashi (open/close/current)
USE:
Must Set Tradingview Candle Type to Heikin Ashi.
Works on all Timeframes and symbols.
BENEFITS:
Helps keep you aware of the actual price action as you trade and historically by adding subtle DOTS and step-lines over your Heikin Ashi candles. With this indicator, you can benefit from the price averaging and smoothing effects of Heikin Ashi while benefiting from the accuracy of traditional candles and true active price levels. Helps maximize your buy and sell entries and exits.
HOW IT WORKS:
Adds true-price DOTS (showing current-price & close)
Adds STEP-LINE (showing true open) price level to Heikin Ashi candles.
DOTS will move & update on active candle with current price movement (as candle forms) . This is beneficial for accurate entry and exits during candle development period.
Option (on/off) to add current True-Price LINE (blue line) in input settings (recommended) .
NOTE:
You may need to right-click candles and arrange "visual order" so that DOTS are on top layer of chart. Otherwise some DOTS might hide behind candles.
ENJOY!
Dan Hollings
Master Crypto Grid Trader
Host of the "High Leverage Lounge"
Please Explore My Other Indicators, Scripts, Grids and Educational Ideas.
@DanHollings on Tradingview
