Infinity Algo═════════════════════════════════════════════════════════════════════════
█ THE PROBLEM
Most signal indicators are one-trick ponies — they work in trending markets but fail in ranges, or vice versa. Traders stack multiple indicators hoping for confluence, but end up with conflicting signals and cluttered charts.
█ THE SOLUTION
Infinity Algo V3.0 is a multi-mode signal system that adapts to market conditions. Switch between trend-following, contrarian, and sniper modes — all within one indicator. Add Auto-Tune optimization to automatically find the best parameters for your specific market.
Professional-grade signals. Adaptive risk management. Clean execution. Trusted by 8,000+ traders worldwide.
═════════════════════════════════════════════════════════════════════════
█ KEY FEATURES
✅ 5 Signal Modes: Normal, Smart, AI, HL Sniper, AI Sniper
✅ 3 Exit Modes: Percentage targets, Signal step-outs, Opposite signal
✅ 6 Take-Profit Levels with on-chart visualization
✅ Trailing Stop-Loss (Breakeven / Moving Target)
✅ Auto-Tune Parameter Optimization
✅ Visual Helpers: Bar coloring, gradient background, "signal coming" markers
✅ Webhook-ready alert payloads for automation
✅ Works on any market: Crypto, Forex, Stocks, Indices
═════════════════════════════════════════════════════════════════════════
█ WHAT MAKES INFINITY ALGO DIFFERENT
🧠 Auto-Tune Engine (The Core Innovation)
Most indicators use static settings that fail when volatility shifts. Infinity Algo's Auto-Tune runs 500+ parameter simulations in the background and selects the optimal configuration for your current asset — automatically.
🎯 Multi-Mode Signal System
One indicator, five signal modes:
Normal: Contrarian entries against the trend
Smart: Trend-following entries with the trend
AI: Auto-optimized momentum signals
HL Sniper: High-conviction trend triggers
AI Sniper: Auto-optimized sniper configuration
🛡️ Adaptive Risk Management
Trailing SL modes that respond to your TP hits — not arbitrary price levels. Lock in breakeven or ratchet your stop as profit grows.
👁️ Anticipation Markers
"Possible Long/Short Coming" labels appear when momentum approaches signal levels — giving you time to prepare before the signal fires.
═════════════════════════════════════════════════════════════════════════
█ SIGNAL MODES EXPLAINED 🎯
Normal + Smart (Default)
The dual-mode system that adapts to market conditions:
Normal Signals: Momentum threshold cross against the trend filter — contrarian plays for reversals and range boundaries
Smart Signals: Momentum threshold cross with the trend filter — trend-following plays for continuation moves
AI / Auto-Tune
Let the algorithm find optimal settings:
Tests multiple parameter combinations against historical data
Walk-Forward: Re-optimizes every N bars to adapt to regime changes
Static: Locks in the best settings from full history
Choose from 12 scoring metrics (Sharpe, Sortino, Win Rate, Profit Factor, etc.)
HL Sniper
For traders who prefer quality over quantity:
Trend-trigger mode for selective, high-conviction entries
Fewer signals, but higher probability setups
Best for volatile markets where precision matters
AI Sniper
The best of both worlds:
Auto-Tune optimizes the Sniper configuration for your specific market
Adapts trigger sensitivity based on historical performance
═════════════════════════════════════════════════════════════════════════
█ EXIT & RISK MANAGEMENT 🛡️
Percentage Targets
Up to 6 TP levels (TP1…TP6) with on-chart lines and labels
Configure price distance (%) and position size (%) for each level
Designed for scaling out positions systematically
Signal Step-Outs
Momentum-shift condition triggers partial exits
Optional higher-timeframe confirmation for stronger signals
"New TP Must Beat Last" prevents weak consecutive exits
Opposite Signal
Closes/flips position when the next opposite entry signal appears
Simple and effective for trend-following systems
Stop-Loss & Trailing
Fixed SL as % from entry (configurable separately for long/short)
Breakeven: Moves SL to entry price after chosen TP is hit
Moving Target: Advances SL to previous TP level as profit grows
═════════════════════════════════════════════════════════════════════════
█ VISUAL HELPERS 👁️
On-Chart TP/SL Lines: See your targets and stops directly on the chart
Bar Coloring: Candles colored by current signal bias
Background Gradient: Visual confirmation of position direction
"Possible Signal Coming" Markers: Anticipate entries before they trigger
Peak Profit Label: Track maximum unrealized profit during trades
═════════════════════════════════════════════════════════════════════════
█ AUTO-TUNE DASHBOARD 🤖
When Auto-Tune is enabled, the dashboard displays:
Current Parameters: Active sensitivity, thresholds, or sniper config
Simulated Performance: Trade count, win rate, P&L from internal backtest
Confidence Score: Stability indicator based on agreement among top configurations
⚠️ Important: Auto-Tune is automated parameter selection on historical data — not predictive AI. It cannot guarantee future performance.
═════════════════════════════════════════════════════════════════════════
█ USE CASES
📈 Trending Markets
Use "Smart" signals + Percentage TPs. Stay aligned with momentum while scaling out at multiple targets. Enable Moving Target trailing to maximize winners.
📉 Ranging / Choppy Markets
Use "Normal" signals (contrarian mode). Catch reversals at range boundaries. Tighter TP targets and quicker exits work best.
⚡ High Volatility / News Events
Use "HL Sniper" for selective entries. Fewer signals, higher conviction. Wider SL to survive stop hunts.
🧪 New Asset / Unfamiliar Market
Enable "AI" mode and let Auto-Tune find optimal parameters. Great for exploring new markets without manual optimization.
═════════════════════════════════════════════════════════════════════════
█ HOW TO USE 🔧
Apply to your chart (any timeframe, any market)
Choose your signal mode based on market conditions
Pick your direction (Long / Short / Both)
Select exit mode: Percentage, Signals, or Opposite Signal
Configure TP levels and position sizing
Enable Stop-Loss and choose a trailing mode
Optional: Enable Auto-Tune for adaptive optimization
Set alerts for signals and TP/SL events
═════════════════════════════════════════════════════════════════════════
█ ALERTS 🔔
Built-in alert conditions for:
All entry signal types (Normal, Smart, AI, HL Sniper, AI Sniper)
TP hits (percentage levels or signal-based steps)
SL touch events
"Possible Long/Short Coming" anticipation markers
💡 Tip: Create separate alerts for each condition. Use TradingView placeholders ({{ticker}}, {{close}}) in your alert messages.
═════════════════════════════════════════════════════════════════════════
█ WORKS ON
Crypto
Forex
Stocks
Indices
Commodities
═════════════════════════════════════════════════════════════════════════
Realistic Expectations:
No indicator wins 100% of the time — Infinity Algo is no exception
Signals should be combined with your own analysis
Auto-Tune optimizes on past data — it cannot predict the future
Always use proper position sizing and risk management
Paper trade or backtest before risking real capital
═════════════════════════════════════════════════════════════════════════
█ LIMITATIONS ⚠️
Signals and overlays are decision-support tools — they cannot eliminate losses
Auto-Tune can overfit if used without out-of-sample validation
Multi-timeframe logic confirms on higher-TF closes — slight delay is expected
Best evaluated on standard candles with realistic fee/slippage assumptions
═════════════════════════════════════════════════════════════════════════
█ DISCLAIMER 📜
This indicator is provided for educational and informational purposes only and does not constitute financial advice. Past performance is not indicative of future results. Trading involves substantial risk of loss, and you are solely responsible for your own trading decisions.
═════════════════════════════════════════════════════════════════════════
Profit

Take Profit XTake Profit X
Take Profit X solves the #1 problem in trading: knowing when to exit. Instead of guessing or using single indicators, it aggregates 8 technical signals to identify high-probability exit points through multi-confirmation consensus. This eliminates premature exits and emotional decision-making.
The indicator counts confirmations from your chosen technical tools:
Green dot = Multiple signals say "take profit on longs/exit shorts"
Red dot = Multiple signals say "take profit on shorts/exit longs"
Signals appear when you reach the minimum confirmations threshold you set.
Possible Settings:
Conservative (Swing Trading)
pine
Minimum Confirmations: 4
Use: RSI, MACD, CCI, Supertrend, Price Action
Disable: Stochastic, Bollinger Bands, EMA Cross
Look Back Bars: 10
Aggressive (Day Trading)
pine
Minimum Confirmations: 2
Use: All indicators ON
Look Back Bars: 3-5
RSI OB/OS: 75/25
Balanced (Most Markets)
pine
Minimum Confirmations: 3
Use: RSI, MACD, CCI, Supertrend
Price Action: ON
Look Back Bars: 5-7

Viprasol Elite Advanced Pattern Scanner# 🚀 Viprasol Elite Advanced Pattern Scanner
## Overview
The **Viprasol Elite Advanced Pattern Scanner** is a sophisticated technical analysis tool designed to identify high-probability double bottom (DISCOUNT) and double top (PREMIUM) patterns with unprecedented accuracy. Unlike basic pattern detectors, this elite scanner employs an AI-powered quality scoring system to filter out false signals and highlight only the most reliable trading opportunities.
## 🎯 Key Features
### Advanced Pattern Detection
- **DISCOUNT Patterns** (Double Bottoms): Identifies bullish reversal zones where price may bounce
- **PREMIUM Patterns** (Double Tops): Detects bearish reversal zones where price may decline
- Multi-point validation system (5-point structure)
- Symmetry analysis with customizable tolerance
### 🤖 AI Quality Scoring System
Each pattern receives a quality score (0-100) based on:
- **Symmetry Analysis** (32% weight): How closely the two bottoms/tops match
- **Trend Context** (22% weight): Strength of the preceding trend using ADX
- **Volume Profile** (22% weight): Volume confirmation at key points
- **Pattern Depth** (16% weight): Significance of the pattern's price range
- **Structure Quality** (16% weight): Overall pattern formation quality
Quality Grades:
- ⭐ **ELITE** (88-100): Highest probability setups
- ✨ **VERY STRONG** (77-87): Strong trade opportunities
- ✓ **STRONG** (67-76): Valid patterns with good potential
- ○ **VALID** (65-66): Acceptable patterns meeting minimum criteria
### 🎯 Intelligent Target System
Three target modes per pattern direction:
- **Conservative**: 0.618 Fibonacci extension (safer, closer targets)
- **Balanced**: 1.0 extension (moderate risk/reward)
- **Aggressive**: 1.618 extension (higher risk/reward)
Targets automatically adjust based on pattern quality score.
### 🔧 Advanced Filtering Options
- **Volatility Filter (ATR)**: Excludes patterns during extreme volatility
- **Momentum Filter (ADX)**: Ensures sufficient trend strength
- **Liquidity Filter (Volume)**: Confirms adequate trading volume
### 📊 Pattern Lifecycle Management
- Real-time neckline tracking with extension multiplier
- Pattern invalidation after extended wait period
- Breakout/breakdown confirmation
- Reversal detection (pattern failure scenarios)
- Target achievement tracking
### 🌈 Premium Visual System
- Color-coded quality levels
- Cyber-themed color scheme (Neon Green/Hot Pink/Purple/Cyan)
- Transparent fills for pattern zones
- Dynamic labels with pattern information
- Elite dashboard showing live pattern stats
## 📈 How To Use
### Basic Setup
1. Add indicator to your chart
2. Enable desired patterns (DISCOUNT and/or PREMIUM)
3. Adjust quality threshold (default: 65) - higher = fewer but better signals
4. Set your preferred target mode
### Trading DISCOUNT Patterns (Bullish)
1. Wait for pattern detection (labeled points 1-4)
2. Check quality score on dashboard
3. Entry on breakout above neckline (point 5)
4. Stop loss below the lowest bottom
5. Target shown automatically based on your mode
6. ⚠️ Watch for pattern failure (break below bottoms = SHORT signal)
### Trading PREMIUM Patterns (Bearish)
1. Wait for pattern detection (labeled points 1-4)
2. Check quality score on dashboard
3. Entry on breakdown below neckline (point 5)
4. Stop loss above the highest top
5. Target shown automatically based on your mode
6. ⚠️ Watch for pattern failure (break above tops = LONG signal)
## ⚙️ Input Settings Guide
### 🔍 Detection Engine
- **Left/Right Pivots**: Higher = fewer but cleaner patterns (default: 6/4)
- **Min Pattern Width**: Minimum bars between bottoms/tops (default: 12)
- **Symmetry Tolerance**: Max % difference allowed between levels (default: 1.8%)
- **Extension Multiplier**: How long to wait for breakout (default: 2.2x pattern width)
### ⭐ Quality AI
- **Min Quality Score**: Only show patterns above this score (default: 65)
- **Weight Distribution**: Customize what matters most (symmetry/trend/volume/depth/structure)
### 🔧 Filters
- **Volatility Filter**: Avoid choppy markets (recommended: ON)
- **Momentum Filter**: Ensure trend strength (recommended: ON)
- **Liquidity Filter**: Volume confirmation (recommended: ON)
### 💎 Target System
- Choose target aggression for each pattern type and direction
- Higher quality patterns get adjusted targets automatically
## 🎨 Visual Customization
- Adjust colors for DISCOUNT/PREMIUM patterns
- Set quality-based color coding
- Customize label sizes
- Toggle dashboard visibility and position
- Show/hide historical patterns
## 🚨 Alert System
Set up TradingView alerts for:
- 🚀 **LONG Signals**: DISCOUNT breakout, PREMIUM failure
- 📉 **SHORT Signals**: PREMIUM breakdown, DISCOUNT failure
- ✅ **Target Achievement**: When price hits your target
## 💡 Pro Tips
1. **Higher Timeframes = Better Signals**: Patterns on 4H, Daily, Weekly are more reliable
2. **Quality Over Quantity**: Focus on ELITE and VERY STRONG grades
3. **Combine with Trend**: DISCOUNT in uptrend, PREMIUM in downtrend = best results
4. **Watch Pattern Failures**: Failed patterns often provide strong counter-trend signals
5. **Adjust for Your Style**: Intraday traders use Conservative, swing traders use Aggressive
## 🔒 Pattern Invalidation
Patterns become invalid if:
- No breakout/breakdown within extension period
- Support/resistance levels are broken prematurely
- Pattern shown in faded colors = no longer active
## ⚠️ Risk Disclaimer
This indicator is a tool for technical analysis and does not guarantee profitable trades. Always:
- Use proper risk management
- Combine with other analysis methods
- Never risk more than you can afford to lose
- Past performance does not indicate future results

Profitsmaxx DayProfitProfitsMaxx DayProfit is the ultimate all-in-one indicator designed for traders who want consistent, high-quality trade signals across any coin and any timeframe. Built for day traders, it delivers precise entry and exit alerts that adapt seamlessly to market conditions — whether you’re trading crypto, forex, or indices.
Powered by advanced algorithms that combine market structure, momentum, and trend analysis, ProfitsMaxx Day Profit helps traders capture profitable moves while minimizing false signals. It’s trusted by both beginners and experienced traders as a reliable tool for daily trading success.
With its clear visuals, intuitive interface, and multi-market compatibility, Day Profit stands as the all-time best ProfitsMaxx indicator — giving you the edge to trade smarter, react faster, and grow your profits with confidence.
👉 Available now at www.profitsmaxx.com

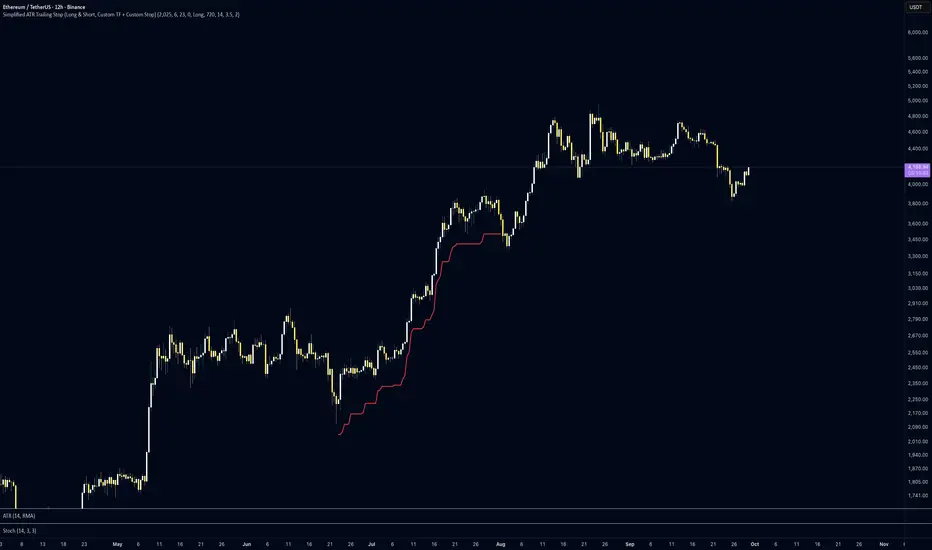
Simplified ATR Trailing Stop (Long & Short, Custom TF + Stop)This indicator plots a dynamic ATR-based trailing stop that adapts to price volatility and keeps you protected whether you’re trading long or short. It’s lightweight, customisable, and designed for traders who want clean risk management without unnecessary complexity.
✨ Key Features:
📅 Custom Entry Date & Price – choose the exact day you want the trailing stop to begin, or let it auto-start from the close.
🔀 Long or Short Mode – flip between bullish and bearish trade setups.
⏱️ Custom Timeframe Support – calculate ATR stops on any higher/lower timeframe (from 10m to 1M) for maximum flexibility.
📏 ATR-Based Logic – trailing stop adjusts dynamically using a multiplier of ATR, keeping stops adaptive to volatility.
🎯 Custom First-Day Stop – set a different ATR factor for day one to handle entries more cautiously.
✅ Stop Trigger Mode – choose between:
Stop on Wick Breach (default intraday aggressiveness)
Stop on Candle Close (extra confirmation, fewer false stops).
📊 How to Use:
Set your entry date and price (or leave price = 0 to use that day’s close).
Select trade direction (Long or Short).
Pick your ATR period, multiplier, and timeframe.
Watch the trailing stop line update automatically until it’s breached.
This tool is great for swing traders, intraday strategists, and anyone who wants a simple yet powerful trailing stop that adapts to price volatility.
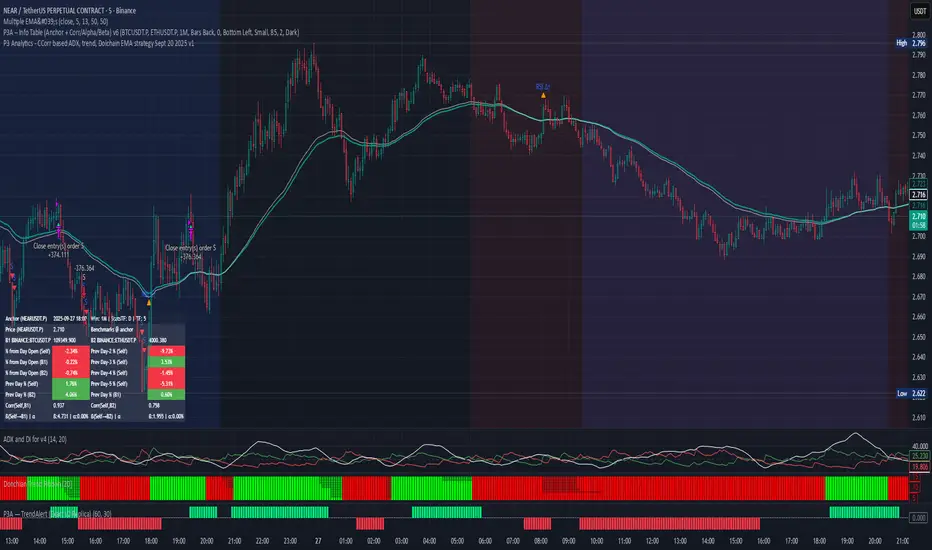
PPP – Info Table (Anchor + Corr/Alpha/Beta) v3PPP – Info Table (Anchor + Corr/Alpha/Beta)
- By P3 Analytics, run by Puranam Pradeep Picasso Sharma
🔎 Overview
This indicator creates a clean, dynamic information table on your chart that lets you quickly analyze how your chosen asset is performing relative to BTC, ETH, or any other benchmarks.
With a single glance, you can see:
% change from today’s open (for the anchor asset, BTC, and ETH)
Previous day % change (self + benchmarks)
Correlation, Beta, and Alpha statistics for the selected window (1W, 1M, 1Y)
Anchor values at any bar you choose (via Bars Back or Anchor Time)
Perfect for traders who want to measure coin strength vs benchmarks and make better rotation, risk, or hedging decisions.
📊 Key Metrics
Correlation (Corr): How closely the asset moves with the benchmark.
+1 = moves together, 0 = no relation, -1 = moves opposite.
Beta (β): Sensitivity of returns vs the benchmark.
β = 1 → moves 1:1 with BTC.
β > 1 → more volatile (amplifies BTC moves).
β < 1 → less volatile (defensive).
Alpha (α): Excess return beyond what Beta predicts.
Positive α = outperforming benchmark-adjusted expectation.
Negative α = underperforming.
⚙️ Features
Flexible Anchor Mode:
Bars Back → quickly step through bars.
Time → pin analysis to a specific historical candle.
Customizable Benchmarks: Default BTC & ETH (futures), but replaceable with any ticker.
Adjustable Stats Window:
1 Week, 1 Month, 1 Year (auto-scales if using chart timeframe).
Compact Mode for a smaller table layout.
Dark/Light Theme, font size, corner placement, transparency, and decimal control.
Runs efficiently with minimal chart clutter.
🧑💻 About P3 Analytics
This indicator is developed under P3 Analytics, a research & trading technology initiative led by Puranam Pradeep Picasso Sharma.
P3 Analytics builds tools that merge machine learning, statistics, and trading strategy into accessible products for traders across crypto, equities, forex, and commodities.
✅ How to Use
Add indicator to your chart.
In settings:
Pick your benchmarks (default = BTCUSDT.P, ETHUSDT.P).
Choose your anchor (Bars Back or Time).
Set window length for correlation/alpha/beta.
Read the table:
Left side = your asset.
Right side = benchmarks.
Colors: Green = positive % change, Red = negative.
🚀 Why Use This?
Quickly compare your asset vs BTC/ETH without juggling multiple charts.
Spot whether a coin is truly leading or just following BTC.
Identify outperformance (alpha) coins for rotation or trend plays.
Manage risk by knowing which assets are high beta (high leverage-like moves).
✦ Indicator by P3 Analytics
✦ Created & published by Puranam Pradeep Picasso Sharma
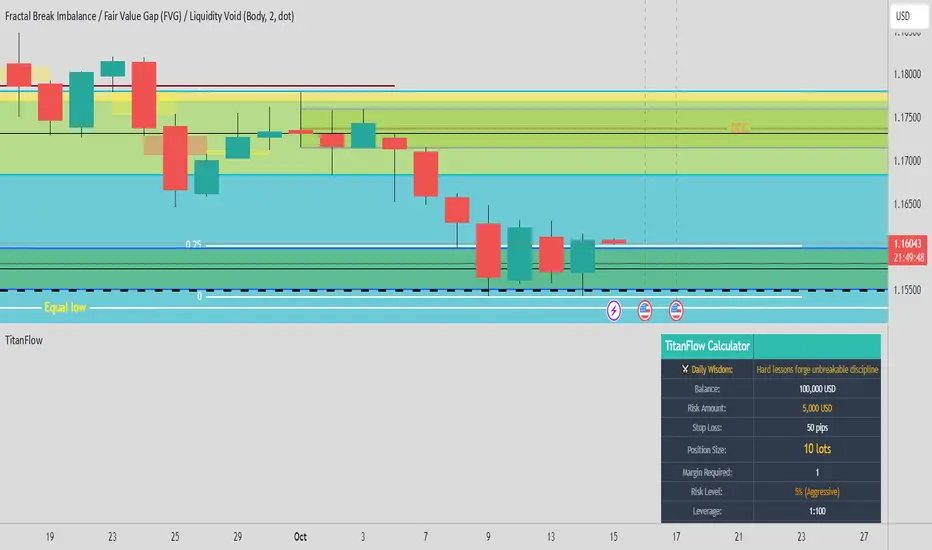
TitanFlow Position CalculatorTitanFlow Position Calculator - Professional Risk Management Tool
Transform your trading with precision position sizing and advanced risk management
The TitanFlow Position Calculator is a comprehensive Pine Script indicator designed for serious traders who demand professional-grade risk management tools. Whether you're trading forex, commodities, indices, or crypto, this calculator ensures you never risk more than intended while maximizing your profit potential.
🎯 Key Features:
SMART POSITION SIZING
Automatic lot size calculation based on your risk parameters
Support for percentage risk, fixed amount, or losing streak buffer modes
Real-time position size updates as market conditions change
Double-up mode for aggressive trading strategies
MULTI-ASSET SUPPORT
Pre-configured settings for Forex Major/Minor pairs
Commodities: Gold, Silver, Oil with accurate pip values
Stock indices with proper contract specifications
Cryptocurrency trading support
Custom instrument configuration for any asset
ADVANCED RISK MANAGEMENT
Visual risk level categorization (Conservative, Moderate, Aggressive, Extreme)
Color-coded risk warnings with threshold alerts
Margin requirement calculations with leverage integration
Take profit level planning with lot distribution
PROFESSIONAL THEMES
TitanFlow Dark theme matching the professional trading platform
TitanFlow Light theme for bright chart environments
Classic dark/light themes for traditional traders
Full custom colour control for personalized setups
COMPREHENSIVE LEVERAGE SUPPORT
Complete leverage options from 1:1 to 1:500 including:
1:1, 1:10, 1:15, 1:20, 1:30, 1:50, 1:100, 1:200, 1:300, 1:400, 1:500
📊 What You'll See:
REAL-TIME CALCULATIONS
Position size in lots displayed prominently
Risk level percentage with color coding
Margin requirements in your account currency
Stop loss distance in pips
Take profit distribution across multiple levels
CLEAN INFORMATION TABLE
Account balance and currency display
Current risk amount being wagered
Calculated position size and margin needs
Risk categorization with visual indicators
Leverage ratio confirmation
SMART ALERTS
Extreme risk warnings (>5% per trade)
Large position alerts (>10 lots)
High margin usage notifications (>50% account)
Real-time risk assessment updates
🚀 Take Your Trading Further with TitanFlow
Want more than just position sizing?
Visit titanflow.co.uk to discover the complete TitanFlow trading ecosystem:
✅ Advanced Trading Dashboard - Comprehensive portfolio tracking and analytics
✅ Trade Journal Integration - Log and analyze every trade automatically
✅ AI-Powered Coaching - Get personalized trading insights and recommendations
✅ Monthly Performance Reports - Detailed analytics delivered to your inbox
✅ Risk Management Suite - Professional tools for serious traders
✅ Trading Calendar - Never miss important market events
✅ Community Access - Connect with successful traders worldwide
Special Offer: TradingView users get exclusive access to premium features. Transform your trading from guesswork to systematic success. coming soon
🎨 Customization Options:
Theme Selection
Choose from 5 professional themes
Customize every colour element
Match your chart aesthetic perfectly
Professional branding options
Display Controls
Position table in any corner
Show/hide alerts and warnings
Adjustable text sizes
Clean, distraction-free interface
💡 Perfect For:
Day Traders who need quick position sizing decisions
Swing Traders planning multi-level exits
Scalpers requiring precise risk control
Portfolio Managers overseeing multiple accounts
Risk Managers monitoring exposure levels
Trading Educators teaching proper risk management
🚀 How to Use:
Set Your Account - Enter balance and currency
Choose Risk Mode - Percentage (recommended 1-2%), fixed amount, or losing streak buffer
Configure Instrument - Select asset type or use custom settings
Set Stop Loss - Enter your stop distance in pips
Read Results - Get instant position size and risk analysis
⚠️ Risk Management Excellence:
This calculator embodies the core principle that successful trading is about risk management, not just profit hunting. By using proper position sizing, you'll:
Survive losing streaks with capital intact
Compound profits systematically
Sleep better knowing your risk is controlled
Build consistent trading habits
Protect your trading capital long-term
Ready to elevate your entire trading operation? Start with this position calculator, then visit titanflow.co.uk to unlock the full potential of systematic, professional trading.
This indicator is part of the TitanFlow trading ecosystem. titanflow.co.uk coming soon here you'll be able to obtain the complete professional trading platform.
Futures PnL Levels [MFFU]Futures PnL Levels is a purpose-built indicator designed specifically for futures traders using TradingView. Whether you're backtesting strategies, planning trades, or managing live positions, this tool gives you a clean, visual overlay of your Profit & Loss directly on the chart, based on your custom input.
Why This Indicator is Different
If you trade using Tradovate through TradingView , you’ve likely noticed a major limitation: TradingView does not show your real-time PnL. This has made it nearly impossible to track live profits and losses within the charting platform until now.
Futures PnL Levels bridges that gap . By inputting your entry, TP, SL, and contract size, you can now replicate a live, dynamic PnL experience directly on your TradingView chart. This solves a long-standing issue for Tradovate users and significantly improves real-time trade awareness.
Key Features
Trade Modeling
Define your trade parameters upon activating the indicator:
Set your entry price , profit target , and stop loss
Input the number of contracts to reflect real-world position sizing
Visual PnL Display
Auto-drawing Take Profit (TP) , Stop Loss (SL) , and Breakeven levels
Live PnL tracking that moves with current market price
Optional live display of floating PnL values and breakeven zones
Styling & Display Options
Adjust line colors and widths for TP/SL/Breakeven
Differentiate real-time positive vs. negative PnL with separate colors
Toggle visibility of label lines and full readouts
Customize label size , price rounding , and other chart elements
Position Summary Table
View a compact summary of your trade parameters
Float this table anywhere on the chart (e.g., top right )
Provides an at-a-glance view of your current setup
Built for CME Futures
Fully compatible with CME instruments like ES, NQ, CL, GC , and more
Supports both long and short positions
Works with auto-detected or manually defined futures contracts
Who It’s For
Futures traders looking to plan trades visually before entering a position
Backtesters and strategy developers who need PnL clarity during analysis
Active traders using Tradovate through TradingView who are missing live PnL tracking
Why Use Futures PnL Levels ?
Unlike generic TP/SL indicators, this tool offers a true replacement for missing PnL visibility in the TradingView + Tradovate ecosystem. Instead of manually inputting your profits, this indicator lets you see your trade’s performance unfold in real time — directly on the chart .
Whether you're preparing a precise entry or managing an open position, Futures PnL Levels adds structure, confidence, and clarity to every trade.

Squeeze Momentum Indicator With EMAThis is a upgraded verison of the most popular Squeeze Momentum Indicator with highlighted lines on the chart to better show entry and exits.
Also includes arrows for easy visibility.
Can also set up ALERTS easily and you can change the color of the momentum highlighted areas to your preference.
HOW TO USE :
***ENTER/EXIT WHEN***
1.Ema 56 / 112 / 672 lines up
2.WHEN CROSSOVER ABOVE = Highlighted green with arrows means bullish entry or bearish exit.
3.WHEN CROSSOVER DOWN = Highlighted red with arows means bearish entry or bullish exit.
4.Exit when black areas occur
***AVOID TRADING WHEN***
1.Arrows within black areas (Non momentum areas or non-squeeze areas)
2.Arrows not following trend(Down arrow during an upwards EMA trend)
**Caution**
You can decide to hold onto a position if you'd like durin the trend, but look at price action before exiting.

Correlation Coefficient📊 Correlation Coefficient (CC)
This indicator measures the statistical correlation between two selected securities over a defined period, scaled from -100 to +100.
It helps you quickly assess whether assets are moving:
Together (positive correlation)
Opposite (negative correlation)
Independently (zero correlation)
🔧 Features:
Select any two symbols (default: NIFTY & BANKNIFTY)
Adjustable length parameter for short-term or long-term correlation analysis
Clean, color-coded plot with horizontal levels to easily identify key correlation zones
📈 Useful For:
Pair trading setups
Hedging strategies
Detecting market regime shifts or intermarket divergences
⚠️ Disclaimer: This is not trading or investment advice.
This indicator is intended for informational purposes only and is not recommended for making
direct trading decisions.

Delta Zones🔶 Delta Zones — A Precision Tool for Time-Price Mapping 🔶
The Delta Zones indicator is a refined structure-mapping tool that dynamically tracks zones of dominant trading activity across recent sessions.
These zones are projected forward in time, offering traders a reliable visual guide to where significant interactions between buyers and sellers are likely to take place.
This tool was designed for intraday use, but its adaptability makes it powerful even on higher timeframes, giving traders insights into market behavior without the noise. You need to change session setting from indicator to higher TF that the chart. For intra, its by default on daily.
🔧 What This Indicator Does
Detects and displays the key activity zone for the current session (today).
Recalls the most active zone from the previous session, allowing you to track momentum or reversal bias.
Color codes each zone based on where price currently trades relative to it:
Neutral gradient (orange/white) for today’s zone, showing where price is consolidating or reacting.
Bullish green fade if price is trading above yesterday’s zone.
Bearish red fade if price is trading below yesterday’s zone.
Extends each zone forward (default 200 bars) so you can observe price behavior as it revisits these areas over time.
📈 How to Use Delta Zones
Trend Continuation:
If price pushes beyond today's zone and maintains momentum, it may suggest strength in that direction. Watch how price reacts on retests of this zone.
Fade or Mean Reversion:
When price strays far from a Delta Zone and struggles to gain ground, it often rotates back into that region. These situations can offer attractive risk-reward setups.
Zone Polarity from Prior Sessions:
Yesterday’s zone serves as a directional cue — if price opens and stays above it (green-filled), sentiment favors strength. If it stays below (red-filled), weakness may persist.
Support/Resistance Anchors:
Use zones as dynamic S/R levels — watch for wick tests, engulfing candles, or volume surges at zone edges for potential trade entries or exits.
🎛️ Inputs You Can Control
Session Length (Default: Daily): Defines how often a new zone is calculated.
💡 Pro Tip
These zones act like magnetic fields around price — not only can they contain price, but they also attract it. The key is to recognize when price is respecting, rejecting, or absorbing at the edges of the zone.
Pair Delta Zones with your favorite price action, momentum, or volume tools for sharper decision-making. For example, "Accumulation/Distribution Money Flow" script which I published few days ago.
⚠️ Note
This is a conceptually adaptive framework designed to simplify the visual structure of the market. While no model guarantees predictive accuracy, Delta Zones are especially useful for contextualizing price behavior and anticipating where meaningful reactions may occur.
This is an educational idea, use it at your own risk.
Past performance does not guarantee future success.

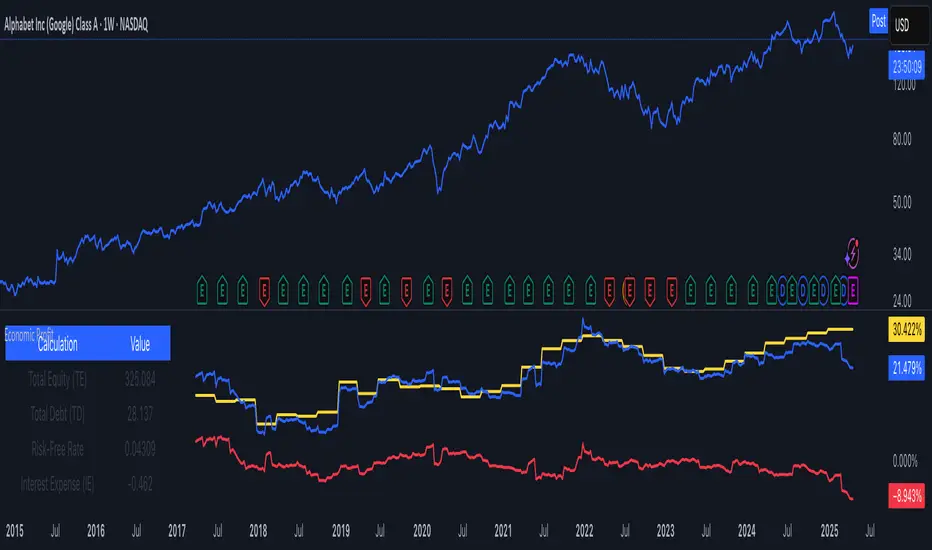
Economic Profit (YavuzAkbay)The Economic Profit Indicator is a Pine Script™ tool for assessing a company’s economic profit based on key financial metrics like Return on Invested Capital (ROIC) and Weighted Average Cost of Capital (WACC). This indicator is designed to give traders a more accurate understanding of risk-adjusted returns.
Features
Customizable inputs for Risk-Free Rate and Corporate Tax Rate assets for people who are trading in other countries.
Calculates Economic Profit based on ROIC and WACC, with values shown as both plots and in an on-screen table.
Provides detailed breakdowns of all key calculations, enabling deeper insights into financial performance.
How to Use
Open the stock to be analyzed. In the settings, enter the risk-free asset (usually a 10-year bond) of the country where the company to be analyzed is located. Then enter the corporate tax of the country (USCTR for the USA, DECTR for Germany). Then enter the average return of the index the stock is in. I prefer 10% (0.10) for the SP500, different rates can be entered for different indices. Finally, the beta of the stock is entered. In future versions I will automatically pull beta and index returns, but in order to publish the indicator a bit earlier, I have left it entirely up to the investor.
How to Interpret
We see 3 pieces of data on the indicator. The dark blue one is ROIC, the dark orange one is WACC and the light blue line represents the difference between WACC and ROIC.
In a scenario where both ROIC and WACC are negative, if ROIC is lower than WACC, the share is at a complete economic loss.
In a scenario where both ROIC and WACC are negative, if ROIC has started to rise above WACC and is moving towards positive, the share is still in an economic loss but tending towards profit.
A scenario where ROIC is positive and WACC is negative is the most natural scenario for a company. In this scenario, we know that the company is doing well by a gradually increasing ROIC and a stable WACC.
In addition, if the ROIC and WACC difference line goes above 0, the company is now economically in net profit. This is the best scenario for a company.
My own investment strategy as a developer of the code is to look for the moment when ROIC is greater than WACC when ROIC and WACC are negative. At that point the stock is the best time to invest.
Trading is risky, and most traders lose money. The indicators Yavuz Akbay offers are for informational and educational purposes only. All content should be considered hypothetical, selected after the facts to demonstrate my product, and not constructed as financial advice. Decisions to buy, sell, hold, or trade in securities, commodities, and other investments involve risk and are best made based on the advice of qualified financial professionals. Past performance does not guarantee future results.
This indicator is experimental and will always remain experimental. The indicator will be updated by Yavuz Akbay according to market conditions.
Kenji Indicator Version 2.0KenJi Indicator Version 2.0
Indicator Class : Average analysis/trend following
Trading type : Any
Time frame : Any
Purpose : Trend-based trading
Level of aggressiveness : Flexible
Introduction
The basic rule of trading is as follows: "trend is your friend." Means, it is extremely important to follow the current market sentiments rather than resisting them. Following this principle allows a trader to feel as comfortable as possible during the trading: positions typically are in a profit zone and there is no psychological pressure of a negative financial result that often leads to hasty position closures.
Despite the advantages of trend-following strategies, many traders struggle to accurately identify the prevailing trend and market sentiments, resulting in bad trading decisions and, consequently, unfavorable trading outcomes.
To address these challenges, streamline the analysis process, and enhance the overall quality of trading decisions, our team of analysts has developed The KenJi Indicator Version 2.0.
About the KenJi Indicator Version 2.0
The KenJi Indicator Version 2.0 offers a novel approach to traditional average-based analysis. Many conventional strategies relying on averages tend to generate numerous false signals, especially in “flat” markets where frequent crossovers and shifts in direction are common. This reduces the overall effectiveness of average analysis.
The KenJi Indicator Version 2.0 addresses these issues by incorporating a unique algorithm, which combines correlation and moving average analysis to avoid the pitfalls of traditional methods. It accurately identifies market conditions—indicated by colors: red for a downtrend, blue for an uptrend, and green for a “flat” market—thereby improving the quality of signals and helping traders manage trends more effectively.
The KenJi Indicator Version 2.0 indicator not only identifies optimal entry points but also assists in timing exits for profit-taking. Moreover, it assesses the aggressiveness of signals, making it suitable for both novice and experienced traders.
Trading Rules
Using the KenJi Indicator Version 2.0 is straightforward. When the price enters the buy or sell zone—represented by a blue or red area between the fast and slow averages—it generates a signal to enter a position. This position remains active until the market condition changes (such as a shift from a downtrend to “flat”) or until a close signal appears, indicated by a significant divergence shown by a blue or red cross.
Indicator Structure
The KenJi Indicator Version 2.0 consists of colored zones, level lines and stop crosses:
Trend Zones : These are color-coded (blue, red, or green) to highlight trend conditions and entry points.
Level Lines : The lines indicate the nearest support/resistance lines (red for resistance, blue for support). Available for 4H time-frame and below
Stop Crosses : Blue or Red crosses are displayed on the Chart to show the moments of extreme price divergence from the current trend. A good moment to fix profits.
For ease of use, the indicator shows buy and sell signals directly on the chart.
Signal Types:
Standard : Uses the basic lot size for trades.
Aggressive : Uses double the standard lot size for higher risk/reward trades.
Profit zones are marked by blue/red x-crosses: red x-crosses indicate "sell" take-profit zones, while blue x-crosses indicate "buy" take-profit zones.
Alerts and Notifications
The indicator includes built-in alerts and notifications, ensuring traders don’t miss any "buy" or "sell" signals.
Input Parameters
The KenJi Indicator Version 2.0 offers several input parameters for customization:
Slow Average Period : Defines the period for the slow average. Longer periods provide a more stable, conservative response to price changes.
Fast Average Period : Defines the period for the fast average. Similar to the slow average, a longer period provides more conservative signals.
Correlation Period : Used to calculate the Pearson correlation coefficient and estimate the relationship between the fast and slow averages, improving trend identification.
Divergence Sensitivity : Determines the placement of take-profit zones, with higher values increasing the distance of these zones.
Access to the KenJi Indicator Version 2.0
For more information or to request access to the Kenji 2.0 Indicator, please send inquiries via private messages.

Partial Profit Calculator [TFO]This indicator was built to help calculate the outcome of trades that utilize multiple profit targets and/or multiple entries.
In its simplest form, we can have a single entry and a single profit target. As shown below in this long trade example, the indicator will draw risk and reward boxes (red and green, respectively) with several annotations. On the left-hand side, all entries will be displayed (in this case there is only one entry, "E1"). On the bottom, the "SL" label indicates the trade's stop loss placement. On the top, all target prices are displayed (in this case there is only one target, "TP1"). Lastly, on the right-hand side a label will display the total R that is to be expected from a winning trade, where R is one's unit of risk.
In the following example, we have two target prices - one at 18600 and one at 18700. You can input as many target prices as you'd like, separated by commas, i.e. "18600,18700" in this example. Make sure the values are separated by commas only, and not spaces, new lines, etc. As a result, we can see that the indicator draws where our profit targets would be with respect to our entry, E1. The indicator assumes that equal parts of the trade position are taken off at each target price. In this example on Nasdaq futures (NQ1!), since we have 2 target prices, this would be equivalent to assuming that we take exactly half the trade position off at TP1, and the remaining half of the position at TP2.
If we wanted to take more of the position off at a certain target, we could simply duplicate the target price. Here I set the target prices to "18600,18600,18700" to enforce that two thirds of the position be taken off at TP1 and TP2, while the remaining third gets taken off at TP3.
We can also show outcome annotations to describe how much R is generated from each possible trade outcome. Using the below chart as an example, the stop loss indicates a -1R loss. The total R from this trade criteria is 1.33 R, and each target price shows how much R is being generated if one were to take off an equal part of the position at said target prices. In this case, we would generate 0.17 R from taking one third of the position off at TP1, another 0.5 R from taking one third of the position off at TP2, and another 0.67 R from taking the remaining one third of the position off at TP3, all adding up to the total R indicated on the right-hand side label.
Using multiple entries works the same way as using multiple target prices, where the input should indicate each entry price separated by commas. In this example I've used "18550,18450" to achieve an average price of 18500, as indicated by the "E_avg" label that appears when more than one entry price is utilized. We can also opt to display risk as dollars instead of R values, where you can input your desired risk per trade, and all values are shown as dollar amounts instead of R multiples, as shown below with a risk per trade of $100.
This is meant to be an educational tool for trades that utilize multiple profit targets and/or entries. Hope you like it!

Average SL% Calculator with TP Levels by GorkiAverage Stop Loss And Take Profit Calculator For Futures Trading by Gorki
Description
The "Average SL% Calculator with TP Levels" script, is a simple tool for traders to plan the trades and check how much loss they are going to receive if they run this strategy. This script calculates the average price of up to four entry points, determines the percentage distance to the stop-loss level, and provides potential loss information based on margin and leverage. Additionally, it includes multiple take-profit levels to help traders systematically capture profits. Visual elements such as horizontal lines and labels make it easy to monitor key levels directly on the chart.
Why To Use This Indicator?
Risk Management: Automatically calculates the percentage distance to the stop-loss level, helping you to understand potential losses.
Profit Optimization: Supports up to four take-profit levels, enabling a structured approach to capturing gains.
Visual Clarity: Displays key levels and important information directly on the chart for easy monitoring.
Alerts: Generates alerts when the price crosses specified levels, ensuring you never miss critical trading signals.
How to Use the Script
Add the Script to Your Chart: Apply the script to your TradingView chart.
Set Input Values: Entry Points: Define up to four limit prices (LIMIT 1, LIMIT 2, LIMIT 3, LIMIT 4).
Stop-Loss: Set your stop-loss price (STOP LOSS).
Take Profits: Specify up to four take-profit levels (Take Profit 1, Take Profit 2, Take Profit 3, Take Profit 4).
Leverage: Input your leverage factor.
Margin: Enter the total margin amount for the trade.
View Calculations: The script will calculate the average entry price, the percentage distance to the stop-loss, and the potential loss based on margin and leverage.
Monitor Levels: Horizontal lines and labels will appear on the chart, showing entry points, stop-loss, and take-profit levels.
Set Alerts: Alerts will trigger when the price crosses your defined levels, helping you to take timely action.
Calculation Details
Average Price: Calculated as the mean of the specified limit prices.
Distance to Stop-Loss: Determined as the percentage difference between the average price and the stop-loss level.
Leveraged Distance: The stop-loss distance percentage multiplied by the leverage factor.
Potential Loss: Calculated by applying the leveraged distance percentage to the margin amount.
Take Profit Percentages: The percentage difference between the average price and each take-profit level.
This comprehensive indicator is a must-have for any trader looking to manage risks effectively while maximizing potential profits. Happy trading!

Sniper BreakoutThis indicator is based on 3 indicator :=
1) Forex Market Session 2) Ema 200 3) Volume
This indicator is for Forex market ..in Forex market (ex- Eur/Usd ) price often (67%) do rotation in every session means example :let suppose a trade take trade in asian session and have 30 pips stop loss 67 % chance price will come back to entry price after London session or New York session so trade have less chance to make trade without hitting stop loss
in this indicator we are using Forex market session indicator to get session range start to end ..this indicator will only search opportunity in London And New York Session range and that can be customize from input section . user can select time zone and time of session from input section indicator and color of session .
next indicator using 200 length Exponential Moving Average for trend identification .if close price is above 200 Ema means trend is upside moving & if close price is below 200 Ema means price is moving downside .user can change length and source of Ema from input section .
Third and most important part is volume indicator when a session start (Example-London session it keep Look back 6 previous candle and compare volume imbalance between look back candle .look back candle can be customize from input section default look back candle input is (6).
next we are using trade range time to only show trade on certain time because often market convert into trading range so given specific input time it only take trade when volume and price is rising or falling .time range can be selected from input section .
Trade Entry Buy Signal -if price is either London or New York session and price is above 200 Ema and volume not in imbalance last number of candle it give Feb (first entry buy ) we keep save high price of every candle after Feb (label ) signal .if any candle break above Feb label it show a confirm buy signal ..Below in example as we can see
Example Image Buy Signal -
in this above example step -1 we searching imbalance of volume and price as we can see imbalance of volume and price on green candle .next we look price is above 200 ema .next step(2) we got Feb (first entry buy ) signal this is not a confirm buy signal .we save high of candle next candle high close above previous candle high we got confirm buy signal .
Trade Entry Sell Signal - if price is either London or New York session and price is below 200 Ema and volume not in imbalance last number of candle it give Feb (first entry Sell ) we keep save low price of every candle after Fes (label ) signal .if any candle break below Fes label it show a confirm sell signal ..Below in example as we can see
step-1 starting of london session we start getting imbalance between price and volume .price is getting rejected but volume is rising on green candle we got fes (first entry sell signal ).next we save low of fes candle but price close above that low of candle we dont get confirm sell entry next price break below low of previous candle so open a new sell signal ..
Example 3 - No Confirm buy/sell Signal
In this above Image example we did not get any confirm signal...we got first entry buy signal but price did not close high of candle in london session .so that day chance price can go any side ..
Example 4 -Feb signal and later confirm buy entry
in this above example we got imbalance of volume and feb(first entry buy signal) but we dont get any confirm buy signal price is just going high then previous candle ..later we see price crossover high of previous candle we got confirm buy signal
Use Of Indicator - This indicator helps traders identify potential trade setups by signaling the first entry points and confirming them later. It's particularly useful for avoiding getting caught in price rotations and aligning trades with significant volume and price movements. Traders should analyze price action and news before confirming a trade.

Volatility Adjusted Profit Target
In my 'Volatility Adjusted Profit Target' indicator, I've crafted a dynamic tool for calculating target profit percentages suitable for both long and short trading strategies. It evaluates the highest and lowest prices over the anticipated duration of your trade, establishing a profit target that shifts with market volatility. As volatility increases, the potential for profit follows, with the target percentage rising accordingly; conversely, it declines with decreasing volatility. As a trader, setting an optimal Take Profit level has always been a challenge. This indicator not only helps in determining that level but also dynamically adjusts it throughout the trade's duration, providing a strategic edge in volatile markets.

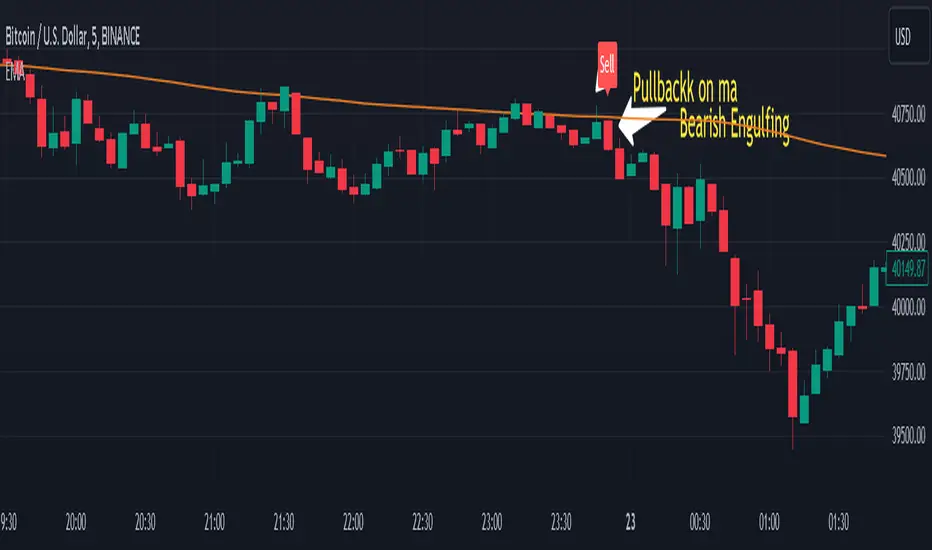
Engulfing pullbackThis Indicator searching for pullback on input Moving Average with Engulfing candle
Rules for indicator :-
Buy Signal -
1) search for pullback on ma if price above ma and come back and touches ma
2)after pullback on ma searching for bullish engulfing pattern on next candle
3)if pullback on previous candle and bullish engulfing for buy signal form
Sell Signal -
1) search for pullback on ma if price below ma and come back touches ma
2)after pullback on ma searching for bearish engulfing pattern on next candle
3)if pullback on previous candle and bearish engulfing for buy signal form
Disclaimer -Traders can use this script as a starting point for further customization or as a reference for developing their own trading strategies. It's important to note that past performance is not indicative of future results, and thorough testing and validation are recommended before deploying any trading strategy.
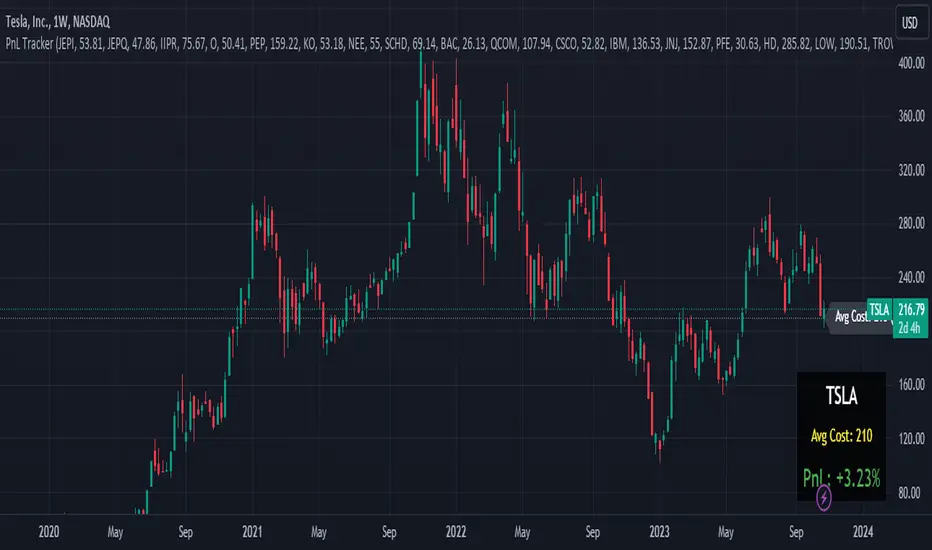
Portfolio PnL Tracker
This is a personal portfolio tracker that helps you track your daily profits and losses. You can track up to 64 stocks or cryptocurrencies. You can set them by specifying the symbol and average price.
FEATURES
- Set up to 64 stock or crypto symbols.
- Shows the average price line
- Show profit or loss as a percentage
- Shows only when on the chart that matches the symbol settings.
HOW TO USE
1. Double click the PnL Tracker indicator at the top left of the chart
2. Enter your symbol and average cost
The average cost line shows your current position.
PnL is calculated based on the average cost you input.
The Profit and Loss (PnL) box and the average cost line will only be displayed when your input symbol matches the chart you are currently viewing.
Realized Profit & Loss [BigBeluga]The Realized Loss & Profit indicator aims to find potential dips and tops in price by utilizing the security function syminfo.basecurrency + "_LOSSESADDRESSES".
The primary objective of this indicator is to present an average, favorable buying/selling opportunity based on the number of people currently in profit or loss.
The script takes into consideration the syminfo.basecurrency, so it should automatically adapt to the current coin.
🔶 USAGE
Users have the option to enable the display of either Loss or Profit, depending on their preferred visualization.
Examples of displaying Losses:
Example of displaying Profits:
🔶 CONCEPTS
The concept aims to assign a score to the data in the ticker representing the realized losses. This score will provide users with an average of buying/selling points that are better to the typical investor.
🔶 SETTINGS
Users have complete control over the script settings.
🔹 Calculation
• Profit: Display people in profit on an average of the selected length.
• Loss: Display people in loss on an average of the selected length.
🔹 Candle coloring
• True: Color the candle when data is above the threshold.
• False: Do not color the candle.
🔹 Levels
- Set the level of a specific threshold.
• Low: Low losses (green).
• Normal: Low normal (yellow).
• Medium: Low medium (orange).
• High: Low high (red).
🔹 Z-score Length: Length of the z-score moving window.
🔹 Threshold: Filter out non-significant values.
🔹 Histogram width: Width of the histogram.
🔹 Colors: Modify the colors of the displayed data.
🔶 LIMITATIONS
• Since the ticker from which we obtain data works only on the daily timeframe, we are
restricted to displaying data solely from the 1D timeframe.
• If the coin does not have any realized loss data, we can't use this script.

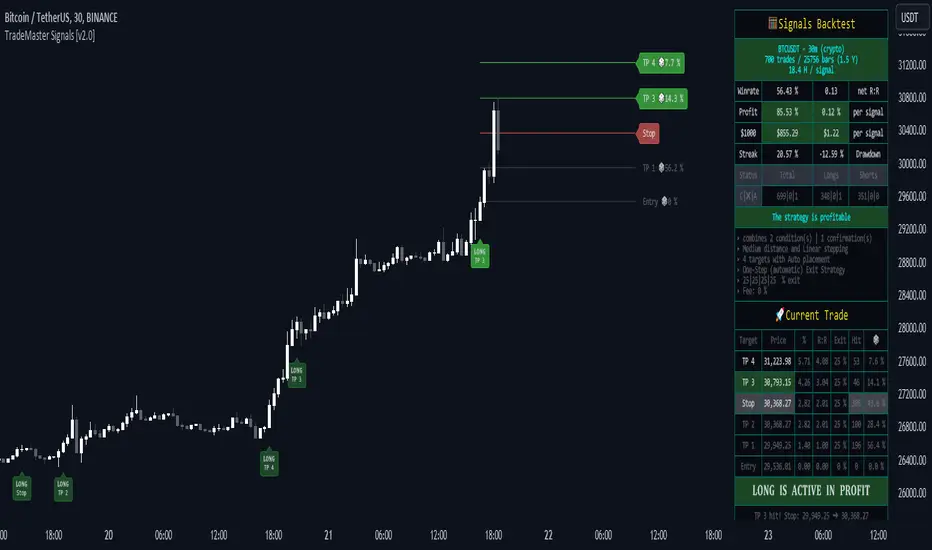
TradeMaster SignalsTrading effectively requires a range of techniques, experience, and expertise. From technical analysis to market fundamentals, traders must navigate multiple factors, including market sentiment and economic conditions. However, traders often find themselves overwhelmed by market noise, making it challenging to filter out distractions and make informed decisions. To address this, we present a powerful indicator package designed to assist traders on their journey to success.
The TradeMaster indicator package encompasses a variety of trading strategies, including the SMC (Supply, Demand, and Price Action) approach, along with many other techniques. By leveraging concepts such as price action trading, support and resistance analysis, supply and demand dynamics, these indicators can empower traders to analyze entry and exit positions with precision. Unlike other forms of technical analysis that produce values or plots based on historical price data, Price Action brings you the facts straight from the source - the current price movements.
The indicator package consists of three powerful indicators that can be used individually or together to maximize trading effectiveness.
⭐ About the Signals Indicator
This indicator offers a unique opportunity for traders to design their own personalized trading strategy. It has a built-in backtesting system, which allows you to thoroughly analyze the performance of your strategy before implementing it in live trading. With the ability to customize and test your strategy using historical data, the Signals indicator empowers you to make data-driven decisions and refine your trading approach.
👉 How does it work?
The Signals indicator provides users with the ability to select trigger conditions and further narrow them down using confirmations.
Conditions are quantitative factors that influence the generation of signals on the chart and in the backtest table. You can enable multiple conditions to create a comprehensive set of criteria for signal generation.
Confirmations, on the other hand, are qualitative factors that selectively filter out conditions based on their alignment with the chosen confirmations. This helps refine the signals and provide more targeted trading opportunities. Multiple confirmations can be enabled to further enhance the precision of the signals.
A well-balanced strategy in the Signals indicator involves carefully selecting a combination of conditions and confirmations to generate accurate trading signals. Finding the right balance between them is crucial for consistent and profitable trading.
To offer even more flexibility, the Signals indicator includes two powerful main functions:
Target Placement System: This feature allows you to set up to 6 targets with a stop loss level and partial exit percentages. You can choose between automatic target creation or manual customization, giving you control over your profit targets.
Exit Strategy: With this feature, you can define your preferred trailing stop strategy, allowing you to implement a systematic approach to exiting trades. By setting appropriate trailing stop levels, you can limit potential losses, while the system secures profits by automatically closing positions partially when certain price targets are reached. This may help you to maintain discipline in your trading and optimize your risk-reward ratio.
With over 30 unique conditions, 10 confirmations, and the deep Target Placement and Exit Strategy systems, the Signals indicator offers a vast array of possibilities. In fact, there are potentially millions of different strategy outputs available for each ticker. Despite its complexity, the script remains lightweight and fast, ensuring smooth performance.
The Signals Backtest table provides a comprehensive overview of your strategy's performance. You can track your current position with all the necessary details, allowing you to monitor your trades effectively and make informed decisions based on the backtest results.
⚠️ WARNING!
Backtest results do not guarantee future performance. Strategies tested on synthetic data may not accurately represent real-world results. Testing should be conducted on charts that reflect actual closing prices.
The indicator displays buy/sell signals intended to support traders' analysis. There are numerous possibilities and combinations available to create your own unique strategies, whether trading with or against the trend or capturing oversold bounces. These are just a few of the many options! Our indicator can easily be tailored to fit your trading strategy.
The settings that influence the signal-generating algorithm play a crucial role in effectively utilizing the signals. We provide users with the flexibility to modify the settings to align with their trading style, while also offering simple adjustment methods using various techniques.
Each method for modifying the signal settings has been designed to meet specific user needs. It is important to understand that one method is not necessarily more accurate than another.
It is essential to understand that signal indications generally serve as trend confirmations, rather than direct entry and exit points. Focusing on the easy use of signal settings and utilizing other functionalities in our toolkit will likely be a better decision than attempting to find the "holy grail" of optimized signal settings and solely relying on following the signals.
⭐ Conclusion
We hold the view that the true path to success is the synergy between the trader and the tool, contrary to the common belief that the tool itself is the sole determinant of profitability. The actual scenario is more nuanced than such an oversimplification. Our aim is to offer useful features that meet the needs of the 21st century and that we actually use.
🛑 Risk Notice:
Everything provided by trademasterindicator – from scripts, tools, and articles to educational materials – is intended solely for educational and informational purposes. Past performance does not assure future returns.
ATR profit and loss linesWhat is ATR?
Taking a candlestick, the following 3 transactions are calculated:
1-The difference between the high of the day and the low of the day
2-The difference between today's high and yesterday's close
3-The difference between today's low and yesterday's close
Atr takes the average of these 14-day candlesticks after making their calculations and it predicts how high or low a candle can go and these give us support and resistance helps with points
If you have noticed a rise in your chart and have no idea how high it will go, you can use Atr profit and loss lines.
The red zone is the stop point, the blue zones are the snow zones.
Must be used with macd. macd is validator.
There is an increase in your chart, you opened the atr profit and loss lines upwards and if macd gives you an increase, it is recommended that you enter the trade at that time. It is recommended to increase your loss line 1 step in the direction of profit every 2 profit breaks on atr profit and loss lines.
ATR Nedir?
Bir mum barı ele alınarak şu 3 işlem hesaplanır:
1-Günün yükseği ile günün düşüğü farkı
2-Günün yükseği ile dünün kapanışının farkı
3-Günün düşüğü ile dünkü kapanışın farkı
ATR ise 14 günlük bu mum barlarının hesaplarını yaptıktan sonra ortalamasını alır ve bir mumum ne kadar yükselip düşebileceği konusunda tahmin verir ve bunlar bize destek ve direnç noktaları konusunda yardımcı olur
Eğer grafiğinizde bir yükseliş farketmişseniz ne kadar yükseleceği konusunda fikriniz yoksa Atr kar zarar çizgilerini kullanabilirsiniz.
Kırmızı bölge durdurma noktası,mavi bölgeler kar bölgeleridir.
Macd ile birlikte kullanılmalıdır.macd doğrulayıcıdır.
Grafiğinizde yükseliş var,atr kar zarar çizgilerini yukarı yönlü açtınız ve macd size yükseliş veriyorsa işte o sırada işleme girmeniz tavsiye edilir.atr kar zarar çizgilerinde her 2 kar kırılımında bir zarar çizginizi kar yönünde 1 kademe arttırmanız önerilir

AFRHi everyone! Sorry for not posting anything for so long again. I will be active in July, after passing my university exams. I bought some S&C magazine archives, so await my new post strategies and indicator in July, as things are gonna get real interesting! But for now let me hand you some new and interesting stuff — AFR indicator.
Actually, this is my third time republishing this indicator after a big timeout because of the battles with TV mods on reference politics (which I lost).
This is indicator was originaly made by some user from other trading website, which I can't mention because of TV reference politics.
Which principles are behind AFR?
First we define our own low and high (OL and OH respectively), which are equal to:
OL = open - ATR * ATR_Factor
OH = open + ATR * ATR_Factor,
where ATR — Average True Range,
ATR_Factor — "Factor" in the settings — multiplier for ATR.
On each tick we remember AFR's value from previous bar, if it is not 0.
When OL is greater then AFR, then AFR is equal to OL. It means that there is probably an uptrend, so we adjust AFR accordingly.
When OH is lower then AFR, then AFR is equal to OH. It means that there is probably a downtrend, so we adjust AFR accordingly.
How to use?
Green AFR — bullish trend.
Red AFR — bearish trend.
Green AFR's triangle up — buy signal — appears when AFR changes it's colour from red to green.
Red AFR's triangle down— sell signal — appears when AFR changes it's colour from green to red.
ALERTS INCLUDED!
My personal ecommendations
- You can AFR as a tool to find short-term and middle-term trends, as it does it's best to find such trends;
- If are a scalper, then you probably should try AFR on low factor settings, as AFR alone can find good scalping entries.
- As AFR is a trend indicator, please use it with other confirmation indicator to make better entries.
Hope you will find this script useful.
Take your profits!
- Tarasenko Fyodor
