PS ATR VariantProfit Sniper ATR Variant v0.1 is completely new but based off of the Profit Sniper 3.0 you know and love :
The original SNIPER operates off two timeframes in parallel, your Trend Timeframe (Higher Timeframe concerned with identifying market up & down trends), and your Trade Timeframe (Lower Timeframe to actually trade Longs & Shorts in).
Within each timeframe, you can tailor your preference for waiting for either Stochastic Ribbon cross only, or Ribbon Cross followed by Chande Confirmation for that additional market structure confidence. Flags & Alerts will then provide you with numerous trading Long & Short trading opportunities per day.
You also have the option to trade with trend so the indicator will automatically flag & alert only Shorts in a Short trend, and Longs in a Long Trend.
This version has the ATR (Average True Range) Indicator incorporated, to give trend direction (only tke longs in long trend and vice versa) and some additional safety features using ATR values.
For access please send a DM
With some extra features. such as ATR ( Average True Range ) trade entry which measures market volatility by analysing the range of asset price during a specified period.
Profit

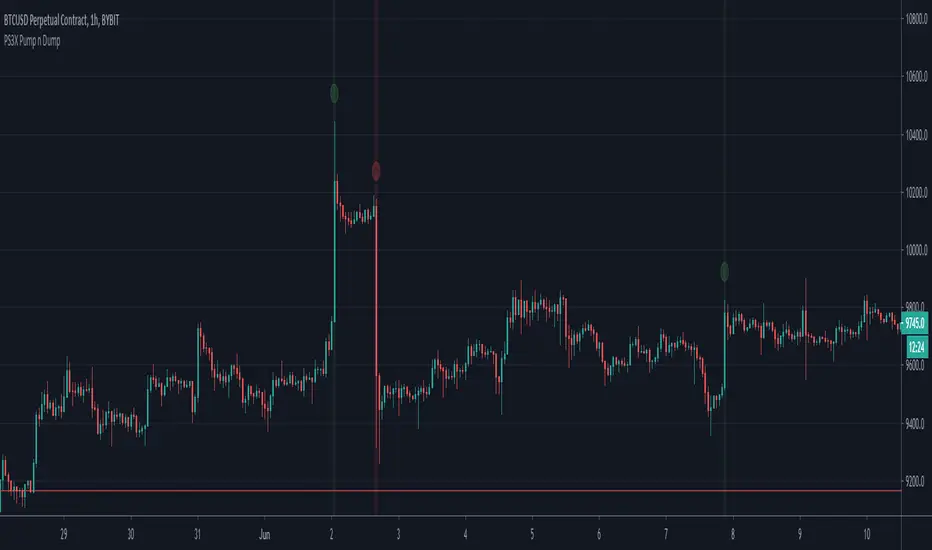
PS3X Pump n DumpA simple strategy that signals when price moves X amount over Y number of candles. Useful for identifying when to pause trading after a large move up or down
For access please send a DM
Swing Low Sweet ChariotI've been using this indicator now for the past few months and seen some very large profits as a result of it.
I've been using this successfully on the one hour FX charts, but seems to work equally as well on higher or lower time frames (not less than 30min).
I've added in some support and resistance functionality and plenty of settings to play with to fine tune to your strategy.
One of the main reasons that I've added in some support and resistance is that there are some times when an indicator is triggered very close to a S&R point then I may not take the trade.
Additionally to the indicator, I'll use trend lines, ADX and RSI to confirm the trend.
Alerts are set up for Long Entry, Short Entry, Long Exit and Short Exit.
Not that the exit points are approximate and won't hit the peaks, however they will prevent price retracement.
Offering 5-day free use of the indicator and then after that it will be £100/yr if you like the indicator. This will also cover all future updates.
Happy to answer any questions or send over other screenshots of currency pairs. Also happy to work with any other users if they have any ideas for improving (i.e. automated trend lines).
Cheers
Mike

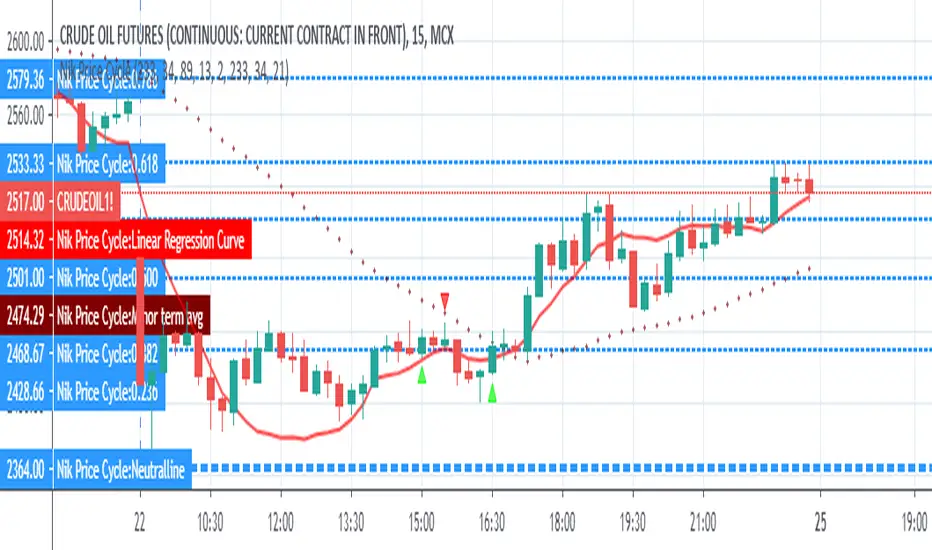
Nikesh Price CycleEvery Script has a pattern and it follows a cyclic movement which results into many small and big swings. We have tried to capture these cyclic pattern. Division line acts here as a pivot point which defines a holistic view of bulls and bear power. Price moving above division line indicates bullish trend and price moving below division line indicates bearish trend. Price scale bar defines trend momentum. when price crosses price scale bar with green scale bar colour it shows we should enter. we will keep on booking our profit on near next fib level. we will exit the trend once price candle crosses linear regression line. for safe entry in case of bulls entry-- price scale bar,linear regression line and mid avg term line should be below price candle. In case of bears entry--price scale bar,linear regression line and mid avg term line should be above price candle.

Nik Price CycleEvery script follow a pattern in their price cycle. This can be defined by division of price cycle. Division line will act as pivot point.Above this bar this any price movement is indication of bullish trend while below this line any price movement is indication of bearish trend. This Nik price signal will give great result in combination of magicsignal which is also one of our developed signal. Although we have included various calculation for analysis purpose in this indicator. i suggest to go in setting and uncheck all channel lines and shapes for getting clear picture of trend and entry point. for more details on how to use this indicator people can message us
PS3X MACD CompanionPS3X MACD Companion to be used as a visual tool alongside "Profit Sniper 3.0" Strategy, MACD Companion uses the standard MACD with signals for Histo cross & Histo change in % or absolute value to indicate trend changes.
If you would like access, please send me a PM.

[Daveatt] BEST Trade Manager Pivots 1.0Hello BEST traders
The BEST Trade Manager got upgraded with many more features
This version allows setting automatically the TP levels on either Fibonacci/Traditional/Camarilla/Woodie pivots
I. 💎 SCRIPTS ACCESS 💎
1. Available only with one-time payment on my website.
2. My website URL is in this script signature at the very bottom (you'll have to scroll down a bit and going past the long description) and in my profile status available here: Daveatt
3. Many video tutorials explaining clearly how all our indicators work are available on your website > guides section.
4. You may also contact me directly for more information
II. 🔎 What is the BEST Trade Manager?🔎
2.1 Concept
The BEST Trade Manager is compatible with any indicator.
Once connected, it adds another layer of good stuff with real-time user custom defined stop loss (8 available options), take profits (4 possible options) + alerts compatible for trading automation.
2.2 How hard is it to update your indicator?
We'll send to our customers, a comprehensive and easy tutorial, to make any indicator compatible.
I guarantee you, it should take no more than 2 minutes per indicator. We made it easy, fun, and awesome. #bolder #statement
III. The amazing benefits of our Plug&Play system
I hope you're ready to be impressed. Because, what I'm about to introduce, is my best-seller feature - and available across many of my indicators.
The BEST Trade manager can be connected to any external indicator
Let's assume you want to connect your RSI divergence to your Trade Manager.
I mentioned an RSI divergence but you may connect any oscillator ( MACD, On balance volume, stochastic RSI, True Strenght index, and many more..) or non-oscillator (divergence, trendline break, higher highs/lower lows, candlesticks pattern, price action, harmonic patterns, ...) indicators.
THE SKY IS (or more likely your imagination) is the limit :)
We go in-depth on our website why the Plug&Play is an untapped opportunity for many traders out there - URL available on my profile status and signature
IV. 🧰 Features 🧰
Candles can be colored to highlight the trend direction better [/b [
4.1 Stop-Loss Management
For what's following, let's assume that 2 is the stop-loss value you inserted in the indicator, and the Algorithm Builder gives a BUY signal.
This is NOT a recommendation at all, only an example to explain how this feature works.
- %Trailing: The Stop-Loss starts 2% away from the entry price - and will move up (because we're on a BUY trade as per our example) every time your trade will gain 2% profit
- Pips Trailing: Same as above but using a distance in pips/USD value
- Percentage: The Stop-Loss stays static 2% away from the entry price. There is no trailing here
- TP Trailing: Trail your stop-loss every time a Take Profit level is hit
- Supertrend: embedded supertrend use as a trailing stop
- Fixed: Set the Stop-Loss at a fixed position (value should be in currency/units)
- ATR multiple: Set the Stop-loss at a multiple of ATR
- External connector: Let's say your indicator already contains embedded stop-loss levels, you can add them in the Trade Manager
4.2 Take Profits Management
You can manage up to 3 take profit levels defined as a percentage or price value or ATR multiple.
The expected input is in percentage value (for instance, setting the % target of TP1 to 2% will set the TP1 level 2% away from the entry price
This version allows setting automatically the TP levels on either Fibonacci/Traditional/Camarilla/Woodie pivots
4.3 Built-in Risk-to-Reward Panel with real-time analytics
The good stuff doesn't stop here.
You'll notice that this sometimes green (when in a LONG), sometimes red (when in a SHORT) panel at the right of your chart.
- Entry Price: the price when the Algorithm Builder will give a signal.
- The Trade PnL in percentage.
- Entry Stop Loss: Distance (in currency/units) between the selected stop-loss algorithm (percent, trailing, TP trailing, etc.) and the entry price.
- Entry TP1/TP2/TP3: Distance (in currency/units) between the entry price and the first take profit
- Risk/Reward TP1/TP2/TP3: Using the Stop-loss distance at entry, and Take Profit 1/2/3 at the entry to compute the risk-to-reward ratio.
- Max drawdown and Max opportunity (value and percentage): respectively the maximum loss and maximum win per trade
For more details, please check the guides section of my website. Links are in my signature and profile status.
V. 🔔 Alerts 🔔
We enabled the alerts on the:
1. Stop-Loss hit
2. Take Profit 1/2/3 hit
3. custom hard exits based on either MACD / RSI divergence/ MM cross
5.1 🤖 Compatible with trading bots? 🤖
It's compatible with all third-parties out there capturing alerts and forwarding them to the brokers.
We enabled TradingConnector and ProfitView alert templates so far.
If you have any doubts or questions, please hit me up directly or ask in the comments section of this script.
BEST regards,
Dave

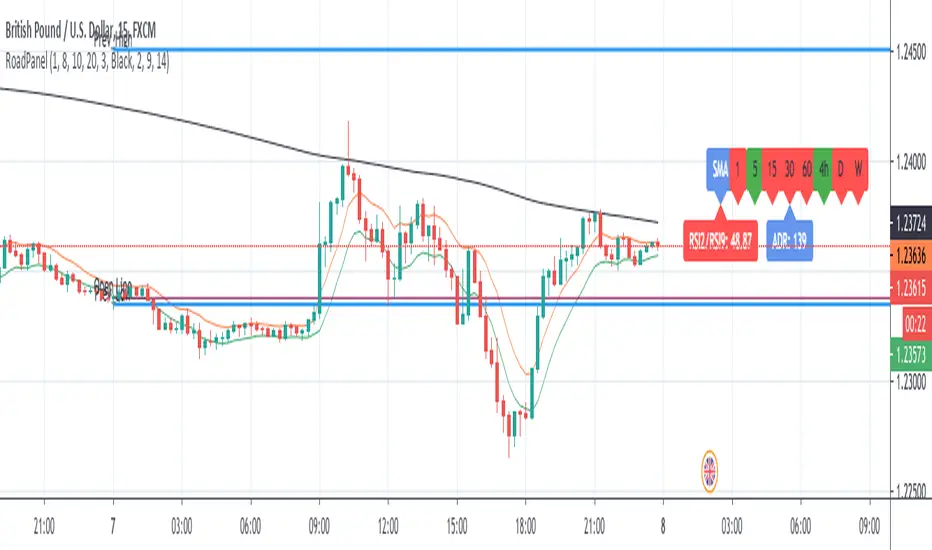
RoadMap PanelThis study is usefull for who follows the rules of "Laura's RoadMap" trading strategy.
If someone doesn't know what I'm talking about, google it because I cannot post link here.
It could be used for scaliping too.
Basically, the rules are:
- Open only in direction of Multitimeframe SMA200
- EMA high/low channel shall be above(buy) or below (Sell) SMA200
- RSI2/RSI9 shall be above(buy) or below (sell) 50
- Look at ADR, last day high/low, daily open for possible supports/resistance.
Next improvement (only to whom is interested to this script and follows me): ADR, last day high/low, daily open to be added to this study.
Next improvement (only to whom is interested to this script and follows me): Alerts to be added.
Please use comment section for any feedback.
********************************** IMPORTANT********************************************************************
I have developed an expert advisor for metatrader4 (MT4) with good results in 2019-April 2020
*********************************************************************************************************************
This study is free to use but code is private. If you like or have question please use comment section.
Check also my other scripts at www.tradingview.com
Thanks for your feedbaks.
Fixed Percent Stop Loss & Take Profit % - For Study Scripts===========
Fixed Percent Stop Loss & Take Profit % - { FOR STUDY SCRIPTS! }
===========
A neat example of how to set up Fixed Stops and Take Profit as a percent of the entry price - This is for setting Alerts within your own Study Script for when either your SL or TP get hit.
Yup, that's about it!
You can ignore the actual entry/exit orders - they're based on a simple MA cross and are therefore NOT relevant, NOT profitable and NOT recommended!
You should be using this code as a way of adding Stops and Takes to your own scripts - hope it helps!
Set your "Open Long/Short" Alerts to be triggered "Once per Bar Close" - Set your "SL/TP" Alerts to trigger "Once per Bar".
--
We wrote this with a bit of a rush on! ~ If you spot any mistakes/bugs just let us know and we'll get round to them asap!
-----------
Good Luck and Happy Trading!

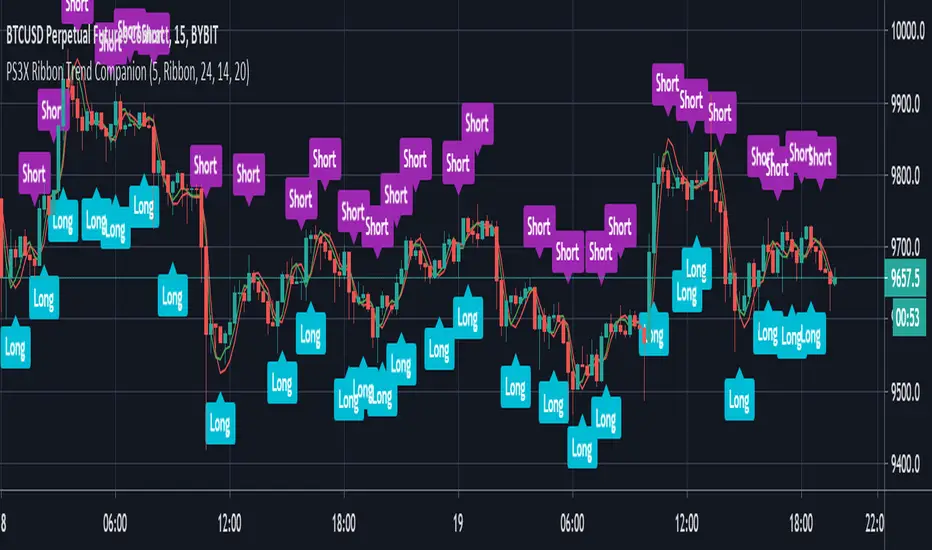
PS3X Ribbon Trend CompanionPS3X Ribbon Trend Companion indicator to use ideally on higher timeframes (HTF) to alert on trend changes and potential trade exits.
To be used as a visual tool alongside "Profit Sniper 3.0" Indicator to allow you to identify market changing between trending & ranging state and trade Long or Short accordingly, example use is on the 30 minute Heiken Ashi to identify bullish or bearish trends to guide lower timeframe trading plays.
If you would like access, please send me a PM.
Profit Sniper 3.0Profit Sniper 3.0 is a completely new Indicator built from the ground up as a successor to previous 1.0 and 2.0 versions of Profit Sniper.
Offering up huge improvements, including multiple position triggers, derived from Bollinger Bands and Chande Momentum as well as our own bespoke stochastic ribbons that provide trend pivots .
Profit Sniper 3.0 has been specifically re-written to simplify usage, and for use with automation, including our own in-house trading robot known as C.A.T (Crypto Algo Trader). Another big decision was to remove the MACD from the indicator package, as invariably users preferred using the built-in MACD .
So how does it work?
3.0 operates off two timeframes in parallel, your Trend Timeframe (Higher Timeframe concerned with identifying market up & down trends), and your Trade Timeframe (Lower Timeframe to actually trade Longs & Shorts in).
Within each timeframe, you can tailor your preference for waiting for either Stochastic Ribbon cross only, or Ribbon Cross followed by Chande Confirmation for that additional market structure confidence. Flags & Alerts will then provide you with numerous trading Long & Short trading opportunities per day.
You also have the option to trade with trend so the indicator will automatically flag & alert only Shorts in a Short trend, and Longs in a Long Trend.
If you would like access, please send me a PM.

PS3X BB CompanionTo be used as a visual tool alongside "Profit Sniper 3.0" Indicator to allow you to identify suitable exit points for trades relating to price crossing Bollinger Bands, example use is on the 30 minute chart to identify bullish or bearish trends to guide lower timeframe trading plays.
Send me a PM to get access.

PS3X BB CompanionPS3X BB Companion indicator to use ideally on higher timeframes (HTF) to alert on trend changes and potential trade exits.
To be used as a visual tool alongside "Profit Sniper 3.0" Indicator to allow you to identify suitable exit points for trades relating to price crossing Bollinger Bands, example use is on the 30 minute chart to identify bullish or bearish trends to guide lower timeframe trading plays.
Send me a PM to get access.

Profit Sniper : Insiders EditionProfit Sniper : Insiders Edition is an Indicator designed to plot (& alert) long & short flags to facilitate trading in BTCUSD.
The flags are derived from Bollinger Bands and Chande Momentum as well as our own bespoke stochastic ribbons that when combined, provide unique insight into trend pivots as they happen.
For access, please send us a Personal Message.

Badshai Trading ToolsBadshai Trading Tools is the tool where Buy and sell signals generates automatically according to the candles behavior.
It uses WD Gann Levels to calculate entry point with the help of VWAP .
Pivot points determines the recent support and resistance levels.
Trading rule for this indicator
This indicator is designed for Indian equity stocks
Best performance is expected on 10 minutes chart basic user can use 5 minutes chart for stock value less than 500 rupees, else 15 minutes chart
Plotted line shows the market sentiment, green for buy, red for sell and black for neutral market.
Order thumb rule
For buy signals there is a up triangle in green color
For sell signal there is a down triangle in red color
1. avoid any trade signal before 9:35 AM Indian time
2. signal and related stop loss candle must be formed in the same day
3. if order placed in 5 minutes chart then don't go for a target of 15 minutes chart
4. if order placed in 15 minutes time frame and target is too far then check the target in 5 minutes time frame
5. if signal candle touches the target then avoid the signal.
6. Money management is most important for this indicator.
7. Take trade only if it satisfy risk reward ratio.
8. It has long target but need patience.
Signal
using vwap calculates gann square of 9 levels and if any smart money activity on that level then checks the confirmation of the trend by higherhigh or lowerlow formation
Buy Entry : entry price should be on the high of the candle before signal for buy and sl on bottom of flagged candle just before signal
SellEntry : entry price should be on the low of the candle before signal for sell and sl on top of flagged candle just before signal
Please add some extra value to the Stop Loss for safe trading
Warning : Don't place any order without stop loss, This tool is made for educational and learning purpose only, take any trade at your own risk.

Takashi Triangular Arbitrage | 2nd Gen | [Alerts]Spot discrepancies between three currencies: these opportunities are rare and usually benefit to traders using advanced programs. You can now set up alerts and discover those for yourself.
This indicator signals opportunities for executing triangular arbitrage. Triangular arbitrage is the result of a discrepancy between three different currencies that occurs when the currency's exchange rates do not exactly match up. These opportunities are more frequent at cryptocurrency markets. The trader would exchange an amount at one rate (Currency_B/Currency_A), convert it again (Currency_C/Currency_B) and then convert it finally back to the original (Currency_C/Currency_A), and assuming low transaction costs, net a profit.
Example:
As per standard inputs, the trader would use US dollars to buy BTC (BITFINEX:BTCUSD), use BTC to buy NEO (BITFINEX:NEOBTC), use NEO to buy US dollars back (BITFINEX:NEOUSD). Whenever the quantity of US dollars bought back is higher than 1% from the initial amount, the indicator will send an alert signaling an arbitrage possibility.
Disclaimer: triangular arbitrage requires advanced automation tools and is only possible if there is enough liquidity to quickly execute all 3 trades at prices used on the indicator.
Inputs
Symbol 1
Symbol input. First step currency to initiate triangular arbitrage. (Currency_B/Currency_A)
Symbol 2
Symbol input. Second step currency to continue triangular arbitrage. (Currency_C/Currency_B)
Symbol 3
Symbol input. Final step currency to finalize triangular arbitrage. (Currency_C/Currency_A)
Discrepancy %
Float input. Amount in percent of profit return after triangular arbitrage is finished. Transaction fees not included.
To get access to this and other scripts check links below.

SBER Coppock Curve with 14EMA (Prefer with 1 HR)Modified coppock curve along with 14EMA can be used by non-aggressive traders as per detailed rules explained in video on "Trading made easy with secret coppock curve"

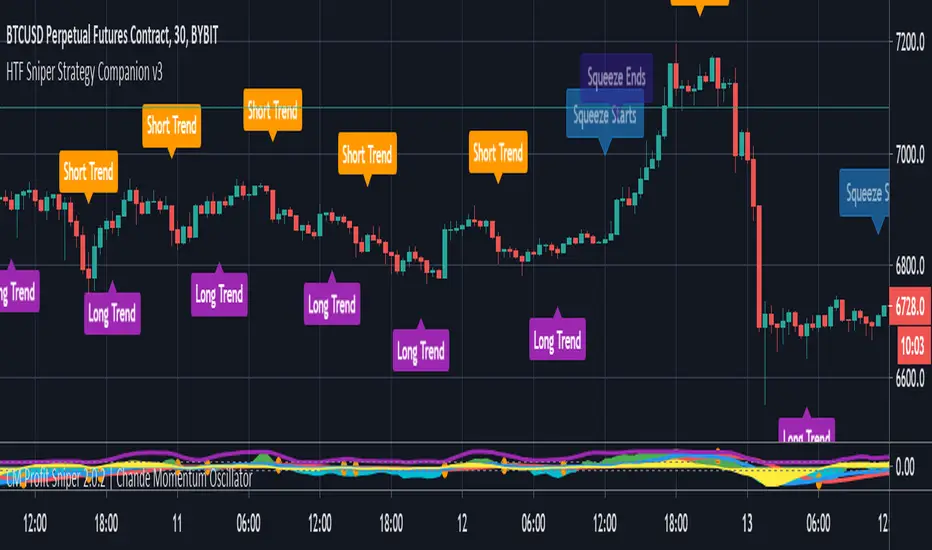
HTF Sniper Strategy CompanionProfit Sniper companion indicator to use ideally on higher timeframes (HTF) to alert on trend changes and Bollinger Band Squeeze Conditions.
To be used as a visual tool alongside "Profit Sniper 2.0" Indicator to allow you to identify market changing between trending & ranging state and trade Long or Short accordingly, example use is on the 30 minute Heiken Ashi to identify bullish or bearish trends to guide lower timeframe trading plays.
Profit Sniper 2.0 Visual Scalper CompanionProfit Sniper companion indicator for scalping, derived from standard Chande Momentum that can be changed to display Heiken-Ashi Chande while Japanese candles are displayed on the screen.
To be used as a visual tool alongside "Profit Sniper 2.0" Indicator to allow you to clearly and easily verify Heiken-Ashi Chande Momentum precise position and general trend at the time a "Sight" label is painted onto your chart from the main "Profit Sniper 2.0" Indicator.
We'll be adding further indicators in the near future to match legacy Profit Sniper.

Profit Sniper 2.0Profit Sniper 2.0 is a completely new Indicator designed as a successor to previous 1.0 versions of Profit Sniper
Offering up huge improvements, including multiple position triggers, derived from Bollinger Bands and Chande Momentum as well as our own bespoke stochastic ribbons that provide trend pivots .
Profit Sniper now works with regular Japanese candles, however, it still provides the flexibility of Heiken Ashi settings for certain elements of the indicator, this allows the accuracy of Japanese candlestick prices, and the smooth trends of HA.
Profit Sniper 2.0 has been specifically re-written for use with automation, including our own in-house trading robot known as C.A.T (Crypto Algo Trader) and as such we have chosen to remove several noisy elements of the now defunct Profit Sniper that were underused, such as the PPO and RSI variants.
Another big decision was to remove the MACD from the indicator package, as invariably users preferred using the built-in MACD .
So how does it work?
HUNT
In true Sniper fashion, when our stochastic HA ribbons pivot between short and long trends, the indicator will offer up a colour coded flag the says “1. HUNT” green for long, red for short.
SIGHT
At this stage, the indicator is now looking for a second condition, this is displayed as “2. Sight” at this point the indicator as noticed a drop in the previous momentum, to pre-empt a flip between long and short. Red is for short, green is for Long
FIRE
The final condition to be met is based on the positioning of the Bollinger Bands , which is show as the “3. Fire Flag” again, as with hunt and sight, red is for short and green is for long.

RSI LevelsRSI Levels
- The relative strength index ( RSI ) is a technical indicator used in the analysis of financial markets.
It is intended to chart the current and historical strength or weakness of a stock or market based on the closing prices of a recent trading period.
- This indicator allows us to visualize the levels of rsi in the chart, so that we can calculate take profit and stop points in a simple way,
knowing what position the price is currently in relation to these levels and how much space we have.
- We can also visualize the slope of the three levels of rsi , overbought, oversold and level 50, something that is not possible in the oscillator version.
- It allows you to display 2 rsi values at the same time.
- Allows to change the color of candlesticks based on rsi.

Divergence of DecisionPoint Breadth Swenlin Trading [LazyBear]// This source code is subject to the terms of the Mozilla Public License 2.0 at mozilla.org
// © 03.freeman
//This is indicator from LazyBear is very accurate for stocks and indexes.
//I added some code snippets for spot and draw divergences automatically
//
// @author LazyBear
//
//
Best use with daily time frame.
Enter when a divergence is found (Bull or Bear label) and wait at least a couple of candles before exit.
Next improvement: alerts ready made for webhooks and screener for multiple tickers.
Please use comment section for any feedback.

Study for Squeeze Momentum Indicator [LazyBear]This study is based on LazyBear Squeeze Momentum Indicator and my strategy developed using it.
I added some custom feature and filters.
Main improvements are:
1- study is updated to version 4 of pine script;
2- I added alerts for entry rules and exit rules.
3- Alert syntax can be customized for webhooks: I added one example only for long entry.
You can customize a lot of features to get a profitable strategy.
Here is a link to original study.
Please use comment section for any feedback.
